VOTING POWER100.00%
DOWNVOTE POWER100.00%
RESOURCE CREDITS100.00%
REPUTATION PROGRESS0.00%
Net Worth
0.000USD
STEEM
0.001STEEM
SBD
0.000SBD
Effective Power
1.176SP
├── Own SP
0.000SP
└── Incoming DelegationsDeleg
+1.176SP
Detailed Balance
| STEEM | ||
| balance | 0.001STEEM | STEEM |
| market_balance | 0.000STEEM | STEEM |
| savings_balance | 0.000STEEM | STEEM |
| reward_steem_balance | 0.000STEEM | STEEM |
| STEEM POWER | ||
| Own SP | 0.000SP | SP |
| Delegated Out | 0.000SP | SP |
| Delegation In | 1.176SP | SP |
| Effective Power | 1.176SP | SP |
| Reward SP (pending) | 0.000SP | SP |
| SBD | ||
| sbd_balance | 0.000SBD | SBD |
| sbd_conversions | 0.000SBD | SBD |
| sbd_market_balance | 0.000SBD | SBD |
| savings_sbd_balance | 0.000SBD | SBD |
| reward_sbd_balance | 0.000SBD | SBD |
{
  "balance": "0.001 STEEM",
  "savings_balance": "0.000 STEEM",
  "reward_steem_balance": "0.000 STEEM",
  "vesting_shares": "0.000000 VESTS",
  "delegated_vesting_shares": "0.000000 VESTS",
  "received_vesting_shares": "1912.543513 VESTS",
  "sbd_balance": "0.000 SBD",
  "savings_sbd_balance": "0.000 SBD",
  "reward_sbd_balance": "0.000 SBD",
  "conversions": []
}
Account Info
| name | areitz |
| id | 1286993 |
| rank | 1,653,231 |
| reputation | 11435762 |
| created | 2019-06-22T00:01:03 |
| recovery_account | steem |
| proxy | None |
| post_count | 3 |
| comment_count | 0 |
| lifetime_vote_count | 0 |
| witnesses_voted_for | 0 |
| last_post | 2020-03-02T01:46:15 |
| last_root_post | 2020-03-02T01:46:15 |
| last_vote_time | 1970-01-01T00:00:00 |
| proxied_vsf_votes | 0, 0, 0, 0 |
| can_vote | 1 |
| voting_power | 0 |
| delayed_votes | 0 |
| balance | 0.001 STEEM |
| savings_balance | 0.000 STEEM |
| sbd_balance | 0.000 SBD |
| savings_sbd_balance | 0.000 SBD |
| vesting_shares | 0.000000 VESTS |
| delegated_vesting_shares | 0.000000 VESTS |
| received_vesting_shares | 1912.543513 VESTS |
| reward_vesting_balance | 0.000000 VESTS |
| vesting_balance | 0.000 STEEM |
| vesting_withdraw_rate | 0.000000 VESTS |
| next_vesting_withdrawal | 1969-12-31T23:59:59 |
| withdrawn | 0 |
| to_withdraw | 0 |
| withdraw_routes | 0 |
| savings_withdraw_requests | 0 |
| last_account_recovery | 1970-01-01T00:00:00 |
| reset_account | null |
| last_owner_update | 1970-01-01T00:00:00 |
| last_account_update | 1970-01-01T00:00:00 |
| mined | No |
| sbd_seconds | 0 |
| sbd_last_interest_payment | 1970-01-01T00:00:00 |
| savings_sbd_last_interest_payment | 1970-01-01T00:00:00 |
{
  "id": 1286993,
  "name": "areitz",
  "owner": {
    "weight_threshold": 1,
    "account_auths": [],
    "key_auths": [
      [
        "STM6BaXEVELpYbcB3qBnSSqTEFi64Z2zt6zgp292ZGXHJWh3CkBCR",
        1
      ]
    ]
  },
  "active": {
    "weight_threshold": 1,
    "account_auths": [],
    "key_auths": [
      [
        "STM6KZqZuRqVeuxt8KMh6RYDZZijyukaiqU1c58LNu9frMU55cuSK",
        1
      ]
    ]
  },
  "posting": {
    "weight_threshold": 1,
    "account_auths": [],
    "key_auths": [
      [
        "STM5AfECW75Nf85mpERLMB4586WCin6XNmCViQ5nS1en19n1YsynV",
        1
      ]
    ]
  },
  "memo_key": "STM6hhjDc1uoD9As5zadA67RqF1rGQWBQ4en51CMxhsWPF1tgbYw9",
  "json_metadata": "{}",
  "posting_json_metadata": "",
  "proxy": "",
  "last_owner_update": "1970-01-01T00:00:00",
  "last_account_update": "1970-01-01T00:00:00",
  "created": "2019-06-22T00:01:03",
  "mined": false,
  "recovery_account": "steem",
  "last_account_recovery": "1970-01-01T00:00:00",
  "reset_account": "null",
  "comment_count": 0,
  "lifetime_vote_count": 0,
  "post_count": 3,
  "can_vote": true,
  "voting_manabar": {
    "current_mana": 1912543513,
    "last_update_time": 1607221359
  },
  "downvote_manabar": {
    "current_mana": 478135878,
    "last_update_time": 1607221359
  },
  "voting_power": 0,
  "balance": "0.001 STEEM",
  "savings_balance": "0.000 STEEM",
  "sbd_balance": "0.000 SBD",
  "sbd_seconds": "0",
  "sbd_seconds_last_update": "1970-01-01T00:00:00",
  "sbd_last_interest_payment": "1970-01-01T00:00:00",
  "savings_sbd_balance": "0.000 SBD",
  "savings_sbd_seconds": "0",
  "savings_sbd_seconds_last_update": "1970-01-01T00:00:00",
  "savings_sbd_last_interest_payment": "1970-01-01T00:00:00",
  "savings_withdraw_requests": 0,
  "reward_sbd_balance": "0.000 SBD",
  "reward_steem_balance": "0.000 STEEM",
  "reward_vesting_balance": "0.000000 VESTS",
  "reward_vesting_steem": "0.000 STEEM",
  "vesting_shares": "0.000000 VESTS",
  "delegated_vesting_shares": "0.000000 VESTS",
  "received_vesting_shares": "1912.543513 VESTS",
  "vesting_withdraw_rate": "0.000000 VESTS",
  "next_vesting_withdrawal": "1969-12-31T23:59:59",
  "withdrawn": 0,
  "to_withdraw": 0,
  "withdraw_routes": 0,
  "curation_rewards": 0,
  "posting_rewards": 0,
  "proxied_vsf_votes": [
    0,
    0,
    0,
    0
  ],
  "witnesses_voted_for": 0,
  "last_post": "2020-03-02T01:46:15",
  "last_root_post": "2020-03-02T01:46:15",
  "last_vote_time": "1970-01-01T00:00:00",
  "post_bandwidth": 0,
  "pending_claimed_accounts": 0,
  "vesting_balance": "0.000 STEEM",
  "reputation": 11435762,
  "transfer_history": [],
  "market_history": [],
  "post_history": [],
  "vote_history": [],
  "other_history": [],
  "witness_votes": [],
  "tags_usage": [],
  "guest_bloggers": [],
  "rank": 1653231
}
Withdraw Routes
| Incoming | Outgoing |
|---|---|
Empty | Empty |
{
  "incoming": [],
  "outgoing": []
}From Date
To Date
2020/12/06 02:22:39
2020/12/06 02:22:39
| delegatee | areitz |
| delegator | steem |
| vesting shares | 1912.543513 VESTS |
| Transaction Info | Block #49203953/Trx 31881c50070a1755e5ae927fd952dea533895540 |
View Raw JSON Data
{
  "block": 49203953,
  "op": [
    "delegate_vesting_shares",
    {
      "delegatee": "areitz",
      "delegator": "steem",
      "vesting_shares": "1912.543513 VESTS"
    }
  ],
  "op_in_trx": 0,
  "timestamp": "2020-12-06T02:22:39",
  "trx_id": "31881c50070a1755e5ae927fd952dea533895540",
  "trx_in_block": 0,
  "virtual_op": 0
}2020/05/08 06:31:27
2020/05/08 06:31:27
| delegatee | areitz |
| delegator | steem |
| vesting shares | 5859.933421 VESTS |
| Transaction Info | Block #43189828/Trx 03bcc9be9eb6f93adb495a200a5622416c865a85 |
View Raw JSON Data
{
  "block": 43189828,
  "op": [
    "delegate_vesting_shares",
    {
      "delegatee": "areitz",
      "delegator": "steem",
      "vesting_shares": "5859.933421 VESTS"
    }
  ],
  "op_in_trx": 0,
  "timestamp": "2020-05-08T06:31:27",
  "trx_id": "03bcc9be9eb6f93adb495a200a5622416c865a85",
  "trx_in_block": 12,
  "virtual_op": 0
}areitzupvoted (100.00%) @areitz / tuscobia-20192020/04/28 15:19:51
areitzupvoted (100.00%) @areitz / tuscobia-2019
2020/04/28 15:19:51
| author | areitz |
| permlink | tuscobia-2019 |
| voter | areitz |
| weight | 10000 (100.00%) |
| Transaction Info | Block #42919203/Trx 2cce528560df2707d429e231bd784dc75d752bbb |
View Raw JSON Data
{
  "block": 42919203,
  "op": [
    "vote",
    {
      "author": "areitz",
      "permlink": "tuscobia-2019",
      "voter": "areitz",
      "weight": 10000
    }
  ],
  "op_in_trx": 0,
  "timestamp": "2020-04-28T15:19:51",
  "trx_id": "2cce528560df2707d429e231bd784dc75d752bbb",
  "trx_in_block": 11,
  "virtual_op": 0
}areitzflagged (-100.00%) @areitz / tuscobia-20192020/04/28 15:19:39
areitzflagged (-100.00%) @areitz / tuscobia-2019
2020/04/28 15:19:39
| author | areitz |
| permlink | tuscobia-2019 |
| voter | areitz |
| weight | -10000 (-100.00%) |
| Transaction Info | Block #42919199/Trx 360d5439204c5b96a35e1a92d511d20bde5fe8cc |
View Raw JSON Data
{
  "block": 42919199,
  "op": [
    "vote",
    {
      "author": "areitz",
      "permlink": "tuscobia-2019",
      "voter": "areitz",
      "weight": -10000
    }
  ],
  "op_in_trx": 0,
  "timestamp": "2020-04-28T15:19:39",
  "trx_id": "360d5439204c5b96a35e1a92d511d20bde5fe8cc",
  "trx_in_block": 17,
  "virtual_op": 0
}filipinoupvoted (10.00%) @areitz / tuscobia-20192020/03/02 08:41:57
filipinoupvoted (10.00%) @areitz / tuscobia-2019
2020/03/02 08:41:57
| author | areitz |
| permlink | tuscobia-2019 |
| voter | filipino |
| weight | 1000 (10.00%) |
| Transaction Info | Block #41295893/Trx ff08f5c16613d5c453d08d7523c41f5cd6898bf2 |
View Raw JSON Data
{
  "block": 41295893,
  "op": [
    "vote",
    {
      "author": "areitz",
      "permlink": "tuscobia-2019",
      "voter": "filipino",
      "weight": 1000
    }
  ],
  "op_in_trx": 0,
  "timestamp": "2020-03-02T08:41:57",
  "trx_id": "ff08f5c16613d5c453d08d7523c41f5cd6898bf2",
  "trx_in_block": 16,
  "virtual_op": 0
}laissez-faireupvoted (100.00%) @areitz / tuscobia-20192020/03/02 01:47:36
laissez-faireupvoted (100.00%) @areitz / tuscobia-2019
2020/03/02 01:47:36
| author | areitz |
| permlink | tuscobia-2019 |
| voter | laissez-faire |
| weight | 10000 (100.00%) |
| Transaction Info | Block #41287619/Trx d15c54a2332131e40b7c91c21bf30d94e79e4ee4 |
View Raw JSON Data
{
  "block": 41287619,
  "op": [
    "vote",
    {
      "author": "areitz",
      "permlink": "tuscobia-2019",
      "voter": "laissez-faire",
      "weight": 10000
    }
  ],
  "op_in_trx": 0,
  "timestamp": "2020-03-02T01:47:36",
  "trx_id": "d15c54a2332131e40b7c91c21bf30d94e79e4ee4",
  "trx_in_block": 23,
  "virtual_op": 0
}anomalyupvoted (1.00%) @areitz / tuscobia-20192020/03/02 01:47:24
anomalyupvoted (1.00%) @areitz / tuscobia-2019
2020/03/02 01:47:24
| author | areitz |
| permlink | tuscobia-2019 |
| voter | anomaly |
| weight | 100 (1.00%) |
| Transaction Info | Block #41287615/Trx f332dfe8c153aac26896e2470e0798e947be7d05 |
View Raw JSON Data
{
  "block": 41287615,
  "op": [
    "vote",
    {
      "author": "areitz",
      "permlink": "tuscobia-2019",
      "voter": "anomaly",
      "weight": 100
    }
  ],
  "op_in_trx": 0,
  "timestamp": "2020-03-02T01:47:24",
  "trx_id": "f332dfe8c153aac26896e2470e0798e947be7d05",
  "trx_in_block": 7,
  "virtual_op": 0
}beemenginesent 0.001 STEEM to @areitz- "💎 Awesome Community Offer: auto booster with 10x extra votes, passive curation earnings and more. Checkout https://www.steembeem.com 🤙 or try it for one month with ONLY 1 STEEM 🤯 to @beemengine wit..."2020/03/02 01:47:18
beemenginesent 0.001 STEEM to @areitz- "💎 Awesome Community Offer: auto booster with 10x extra votes, passive curation earnings and more. Checkout https://www.steembeem.com 🤙 or try it for one month with ONLY 1 STEEM 🤯 to @beemengine wit..."
2020/03/02 01:47:18
| amount | 0.001 STEEM |
| from | beemengine |
| memo | 💎 Awesome Community Offer: auto booster with 10x extra votes, passive curation earnings and more. Checkout https://www.steembeem.com 🤙 or try it for one month with ONLY 1 STEEM 🤯 to @beemengine with memo: subscribe |
| to | areitz |
| Transaction Info | Block #41287613/Trx 8fc096bb6a1e0ca8e6c18737ee73c3e491b34ad2 |
View Raw JSON Data
{
  "block": 41287613,
  "op": [
    "transfer",
    {
      "amount": "0.001 STEEM",
      "from": "beemengine",
      "memo": "💎 Awesome Community Offer: auto booster with 10x extra votes, passive curation earnings and more. Checkout https://www.steembeem.com 🤙 or try it for one month with ONLY 1 STEEM 🤯 to @beemengine with memo: subscribe",
      "to": "areitz"
    }
  ],
  "op_in_trx": 0,
  "timestamp": "2020-03-02T01:47:18",
  "trx_id": "8fc096bb6a1e0ca8e6c18737ee73c3e491b34ad2",
  "trx_in_block": 46,
  "virtual_op": 0
}asmuniupvoted (100.00%) @areitz / tuscobia-20192020/03/02 01:47:12
asmuniupvoted (100.00%) @areitz / tuscobia-2019
2020/03/02 01:47:12
| author | areitz |
| permlink | tuscobia-2019 |
| voter | asmuni |
| weight | 10000 (100.00%) |
| Transaction Info | Block #41287611/Trx 7117202a85bd4f9f4d6d6b47744bf5ef2db84f73 |
View Raw JSON Data
{
  "block": 41287611,
  "op": [
    "vote",
    {
      "author": "areitz",
      "permlink": "tuscobia-2019",
      "voter": "asmuni",
      "weight": 10000
    }
  ],
  "op_in_trx": 0,
  "timestamp": "2020-03-02T01:47:12",
  "trx_id": "7117202a85bd4f9f4d6d6b47744bf5ef2db84f73",
  "trx_in_block": 12,
  "virtual_op": 0
}areitzpublished a new post: tuscobia-20192020/03/02 01:46:15
areitzpublished a new post: tuscobia-2019
2020/03/02 01:46:15
| author | areitz |
| body | # Tuscobia 2019 Last year I did the Tuscobia Winter Ultra 80 mile race by bike. I did this as a test for my gear going into the Arrowhead 135. Overall I learned a lot doing my first long-distance winter race. It was rough and didn't go as smoothly as I would have liked, but I did finish. This year I wanted to come back and attempt to do it properly. I decided that doing the 160-mile ride was a good idea. Again, to get some practice for the Arrowhead, to push myself, and to have some fun. Last year, I ran into some issues. My light went out quickly because it turned on in my pack. I've since learned how to use the lock function. My backup light due to battery performance in the cold wasn’t as bright as I would have liked, so it was slow rolling in the dark. I also managed to put my car in the ditch before the race and started about an hour late. Basically, the start and end of the race were pretty rough, but everything in between was fun and went pretty smoothly. Overall I finished in 12 hours from my start time, so 13 hours from the actual race start. I felt like this year I should be able to do better. In 2018 I was stopping frequently, fell hard on the ice once and just felt undertrained and underprepared. 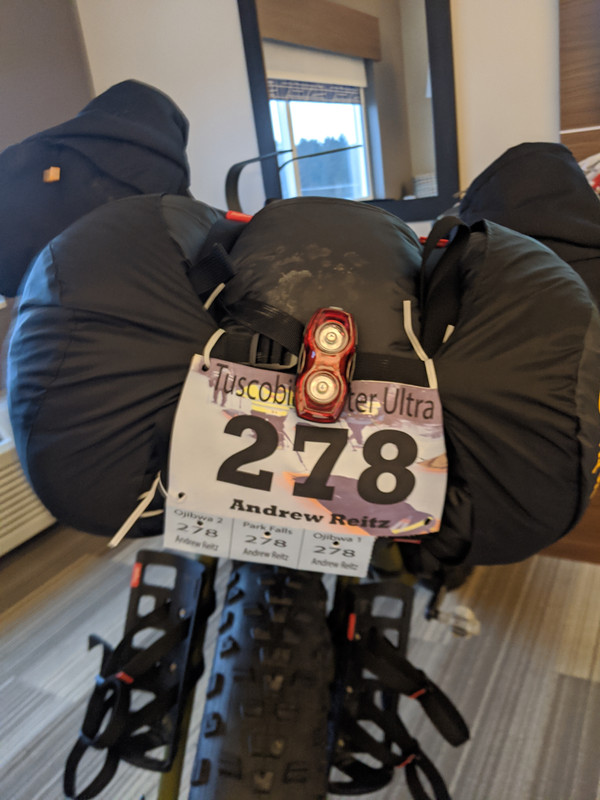 Based on last year's speed I sort of figured this year getting to the halfway point would take at **most** 12 hours and I should finish in 24 - 26 hours if I didn’t sleep. The day before the race I realized there wasn't going to be a little rain and mostly snow as I had anticipated. Instead, it was going to be warm, right around the freezing point, and rain a lot. This caused me to leave a bit of extra gear in my hotel room. Had I seen the weather before I left the house I might have brought some changes of clothes, although as I type this I don't think that would have mattered. Changing into dry clothes would just cause them to get them wet in a few minutes and then I'd be carrying multiple pairs of heavy wet clothes. So, I ditched some gear, like facemasks, heavyweight gloves, heavy backup jackets. I also didn't have a dry bag with me for my sleeping bag, since snow should just brush right off the stuff sack. Rain is a different story. Luckily, a good friend of mine told me to not trust dry bags, and to wrap my sleeping bag in my bivy sack (shout out Paul). This was vital, a -20℉ down sleeping bag soaked through would probably weigh at least an extra 20 pounds and be useless if I needed it. The only other change I did with my gear due to rain was stuff some electronics in ziplock bags. I am certain that my cheap mp3 player is not water-resistant. ## Race day I woke up about 30 minutes before my alarm. I'm a pretty anxious person when it comes to being on time, and races cause me to lose a lot of sleep. It's so bad, that sometimes I think about not doing races to avoid this stress, but I'm hoping, despite doing this for 4 years now that it will eventually get better. I get ready and head to the start with my partner Kristi (Thanks for putting up with me getting up before 5 am!). I finish loading my bike at the start and then hang out waiting to get going. The wait is long because, well I was very early, anxiety you know... I line up on the trail about 5 minutes before the start. There is no gun or fireworks to signal the start, the race director just says "alright get going" and we all take off. I miss pretty much the **only** turn on the trail at mile 4 and probably end up adding 2 extra miles to my ride. I can't read well without my glasses and when riding in the winter I've pretty much given up on wearing eyewear. They make my nose and ears cold and they always fog or ice up at some point. No big deal though, one of these days I'll get the start of Tuscobia right. I feel strong and am moving at a good pace. This is the first time I've ever done any real training for a race, and it felt like it paid off. Around mile 20 is when things start to slow down. The snow becomes like sand and my cadence becomes low as I struggle to keep moving forwards. I'm not the only one, there are a few people ahead of me and we all are playing leapfrog with each other. I drop the air pressure in my tires which helps a little bit. Then the rain begins. Everything gets a nice ice coating at first. Then as the day warms up everything is wet. I don't put on my rain jacket, mostly because I didn't want to get it out and stick with my Patagonia Nano-Air Light jacket, which performs great. It soaks up the water and becomes heavy but I stay warm and don't notice that I'm wet at all. 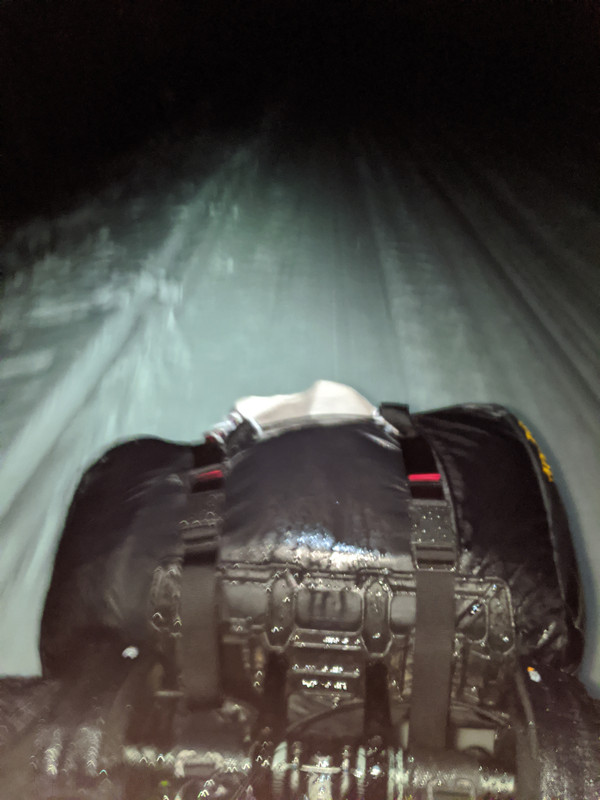 My clothing choices this year have changed to clothing that dries as fast as possible. I sweat a lot when biking, even in the winter, and moisture trapped in your clothes will make you cold. I didn't want to spend time trying to change in and out of clothes as they get wet, but rather be able to just keep on what I have. This year, I went with a bunch of different Patagonia alpine climbing gear since it's meant to be worn without being taken off for long periods. They are also meant to be used for stop and start aerobic activities such as climbing and belaying where you move a lot then stand still for a long time, this may be a little overkill for cycling but if I did get mechanical I'd appreciate this. With all the testing I did, I'd say my setup works great for me. After the excitement of missing a turn, nothing of significance happens, from this point on. It just continues to snow wet and heavy snow. I make it to the checkpoint, eat a bit, mix up some more drink mix, fill my water bottles and continue. I realize it took me 7 hours to get to the checkpoint which feels very slow. I leave the checkpoint and continue to pedal on, my knees start to hurt, when high force and low cadence are used to keep going on the crappy wet snow, it starts to strain the knees. Somewhere between the first checkpoint and the second, I start to get a lot of anxiety about trying to stay out overnight. I worry that if I have to bivy I'll be in a wet sleeping bag, that will end up weighing 60 pounds in the morning. I worry that any clothes I could change into for sleeping or getting warm as the night comes on are soaked through. I worry about what to do with my boots if I were to bivy; leave them outside to get filled with water, or try to wear them to a bed where they will soak my sleeping bag. The food I keep in my pockets to snack on is also soaked and falling apart. I snack to keep myself awake, but I also won’t be able to do that as easily tonight. All these fill my mind as I trudge along with my knees hurting and stomach starting to ache (I think I ended up eating too much, which has never been an issue for me before). All of these issues start to get to me and I start to think I should call it a day. I text Kristi that I'll be dropping at the halfway checkpoint. The roads are terrible and it will take her 2 hours to come to get me. That said I assumed it would take me at least another 2 hours from where I was to get to the checkpoint, so it seems fine and I continue. As I get close to the checkpoint and off the actual Tuscobia Tail onto the city streets I see what Kristi was talking about when she said the roads were bad. They were covered in ice. I had to be very careful about getting to the checkpoint. I get to the checkpoint which is in a bar and am greeted by very friendly faces. They cheer as I come inside, I feel like a rockstar. I try to eat some food, but my stomach is still bothering me. As I get talking to others it sounds like a lot of them are dropping as well. So, I don't feel too bad about dropping at this time, as I sit longer and begin to feel better I start to regret not going on to finish. A guy I had been playing leapfrog with all day, and who also missed the turn with me at the beginning of the race, said he was going back out. When I met up with him later, at the Arrowhead 135, I found out he ended up dropping at mile 120 because the conditions were so bad. So I feel okay about my decision. As with any race, I learned some new things and will adjust my food, nutrition, and gear for the future. Not finishing this race has me wanting to come back for more next year but also had me very worried about the training I've been doing for the Arrowhead but more about that another time. 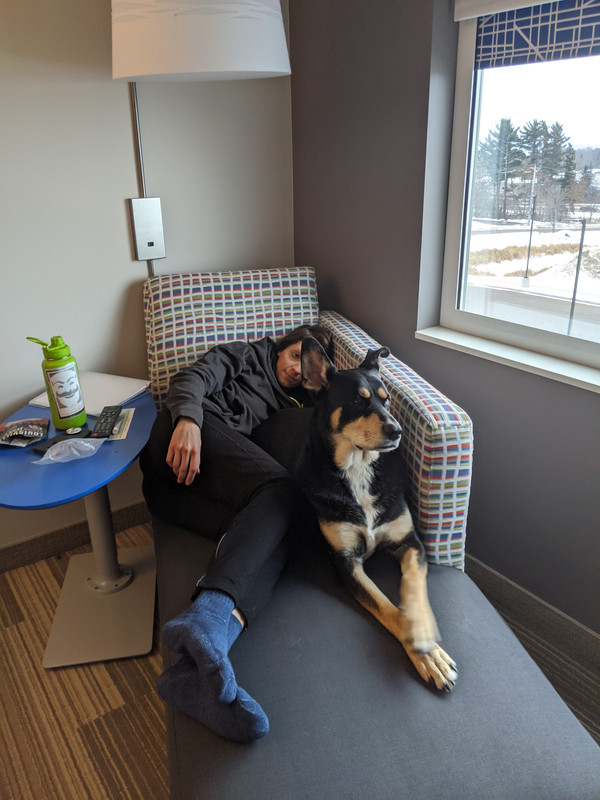 My loving support crew and editor. |
| json metadata | {"tags":["bike","tuscobia","winter-ultra","cycling"],"image":["https://i.postimg.cc/PqVfFz41/IMG-20191227-161636.jpg","https://i.postimg.cc/zBLDmbt6/IMG-20191228-172616.jpg","https://i.postimg.cc/3wxJBbgK/IMG-20191227-152722.jpg"],"app":"steemit/0.2","format":"markdown"} |
| parent author | |
| parent permlink | bike |
| permlink | tuscobia-2019 |
| title | Tuscobia 2019 |
| Transaction Info | Block #41287592/Trx f164b7ab0708a3fb13aabe81521af35eee3f1e27 |
View Raw JSON Data
{
"block": 41287592,
"op": [
"comment",
{
"author": "areitz",
"body": "# Tuscobia 2019\n\nLast year I did the Tuscobia Winter Ultra 80 mile race by bike. I did this as a test for my gear going into the Arrowhead 135. Overall I learned a lot doing my first long-distance winter race. It was rough and didn't go as smoothly as I would have liked, but I did finish. This year I wanted to come back and attempt to do it properly. I decided that doing the 160-mile ride was a good idea. Again, to get some practice for the Arrowhead, to push myself, and to have some fun. \n\nLast year, I ran into some issues. My light went out quickly because it turned on in my pack. I've since learned how to use the lock function. My backup light due to battery performance in the cold wasn’t as bright as I would have liked, so it was slow rolling in the dark. I also managed to put my car in the ditch before the race and started about an hour late. Basically, the start and end of the race were pretty rough, but everything in between was fun and went pretty smoothly. Overall I finished in 12 hours from my start time, so 13 hours from the actual race start. I felt like this year I should be able to do better. In 2018 I was stopping frequently, fell hard on the ice once and just felt undertrained and underprepared. \n\n\n\nBased on last year's speed I sort of figured this year getting to the halfway point would take at **most** 12 hours and I should finish in 24 - 26 hours if I didn’t sleep. The day before the race I realized there wasn't going to be a little rain and mostly snow as I had anticipated. Instead, it was going to be warm, right around the freezing point, and rain a lot. This caused me to leave a bit of extra gear in my hotel room. Had I seen the weather before I left the house I might have brought some changes of clothes, although as I type this I don't think that would have mattered. Changing into dry clothes would just cause them to get them wet in a few minutes and then I'd be carrying multiple pairs of heavy wet clothes. So, I ditched some gear, like facemasks, heavyweight gloves, heavy backup jackets. I also didn't have a dry bag with me for my sleeping bag, since snow should just brush right off the stuff sack. Rain is a different story. Luckily, a good friend of mine told me to not trust dry bags, and to wrap my sleeping bag in my bivy sack (shout out Paul). This was vital, a -20℉ down sleeping bag soaked through would probably weigh at least an extra 20 pounds and be useless if I needed it. The only other change I did with my gear due to rain was stuff some electronics in ziplock bags. I am certain that my cheap mp3 player is not water-resistant.\n\n## Race day\n\nI woke up about 30 minutes before my alarm. I'm a pretty anxious person when it comes to being on time, and races cause me to lose a lot of sleep. It's so bad, that sometimes I think about not doing races to avoid this stress, but I'm hoping, despite doing this for 4 years now that it will eventually get better. I get ready and head to the start with my partner Kristi (Thanks for putting up with me getting up before 5 am!). I finish loading my bike at the start and then hang out waiting to get going. The wait is long because, well I was very early, anxiety you know... I line up on the trail about 5 minutes before the start. There is no gun or fireworks to signal the start, the race director just says \"alright get going\" and we all take off. I miss pretty much the **only** turn on the trail at mile 4 and probably end up adding 2 extra miles to my ride. I can't read well without my glasses and when riding in the winter I've pretty much given up on wearing eyewear. They make my nose and ears cold and they always fog or ice up at some point. No big deal though, one of these days I'll get the start of Tuscobia right. I feel strong and am moving at a good pace. This is the first time I've ever done any real training for a race, and it felt like it paid off. Around mile 20 is when things start to slow down. The snow becomes like sand and my cadence becomes low as I struggle to keep moving forwards. I'm not the only one, there are a few people ahead of me and we all are playing leapfrog with each other. I drop the air pressure in my tires which helps a little bit. Then the rain begins. Everything gets a nice ice coating at first. Then as the day warms up everything is wet. I don't put on my rain jacket, mostly because I didn't want to get it out and stick with my Patagonia Nano-Air Light jacket, which performs great. It soaks up the water and becomes heavy but I stay warm and don't notice that I'm wet at all.\n\n\n\nMy clothing choices this year have changed to clothing that dries as fast as possible. I sweat a lot when biking, even in the winter, and moisture trapped in your clothes will make you cold. I didn't want to spend time trying to change in and out of clothes as they get wet, but rather be able to just keep on what I have. This year, I went with a bunch of different Patagonia alpine climbing gear since it's meant to be worn without being taken off for long periods. They are also meant to be used for stop and start aerobic activities such as climbing and belaying where you move a lot then stand still for a long time, this may be a little overkill for cycling but if I did get mechanical I'd appreciate this. With all the testing I did, I'd say my setup works great for me.\n\nAfter the excitement of missing a turn, nothing of significance happens, from this point on. It just continues to snow wet and heavy snow. I make it to the checkpoint, eat a bit, mix up some more drink mix, fill my water bottles and continue. I realize it took me 7 hours to get to the checkpoint which feels very slow. I leave the checkpoint and continue to pedal on, my knees start to hurt, when high force and low cadence are used to keep going on the crappy wet snow, it starts to strain the knees.\n\nSomewhere between the first checkpoint and the second, I start to get a lot of anxiety about trying to stay out overnight. I worry that if I have to bivy I'll be in a wet sleeping bag, that will end up weighing 60 pounds in the morning. I worry that any clothes I could change into for sleeping or getting warm as the night comes on are soaked through. I worry about what to do with my boots if I were to bivy; leave them outside to get filled with water, or try to wear them to a bed where they will soak my sleeping bag. The food I keep in my pockets to snack on is also soaked and falling apart. I snack to keep myself awake, but I also won’t be able to do that as easily tonight. All these fill my mind as I trudge along with my knees hurting and stomach starting to ache (I think I ended up eating too much, which has never been an issue for me before). All of these issues start to get to me and I start to think I should call it a day.\n\nI text Kristi that I'll be dropping at the halfway checkpoint. The roads are terrible and it will take her 2 hours to come to get me. That said I assumed it would take me at least another 2 hours from where I was to get to the checkpoint, so it seems fine and I continue. As I get close to the checkpoint and off the actual Tuscobia Tail onto the city streets I see what Kristi was talking about when she said the roads were bad. They were covered in ice. I had to be very careful about getting to the checkpoint.\n\nI get to the checkpoint which is in a bar and am greeted by very friendly faces. They cheer as I come inside, I feel like a rockstar. I try to eat some food, but my stomach is still bothering me. As I get talking to others it sounds like a lot of them are dropping as well. So, I don't feel too bad about dropping at this time, as I sit longer and begin to feel better I start to regret not going on to finish. A guy I had been playing leapfrog with all day, and who also missed the turn with me at the beginning of the race, said he was going back out. When I met up with him later, at the Arrowhead 135, I found out he ended up dropping at mile 120 because the conditions were so bad. So I feel okay about my decision.\n\nAs with any race, I learned some new things and will adjust my food, nutrition, and gear for the future. Not finishing this race has me wanting to come back for more next year but also had me very worried about the training I've been doing for the Arrowhead but more about that another time.\n\n\nMy loving support crew and editor.",
"json_metadata": "{\"tags\":[\"bike\",\"tuscobia\",\"winter-ultra\",\"cycling\"],\"image\":[\"https://i.postimg.cc/PqVfFz41/IMG-20191227-161636.jpg\",\"https://i.postimg.cc/zBLDmbt6/IMG-20191228-172616.jpg\",\"https://i.postimg.cc/3wxJBbgK/IMG-20191227-152722.jpg\"],\"app\":\"steemit/0.2\",\"format\":\"markdown\"}",
"parent_author": "",
"parent_permlink": "bike",
"permlink": "tuscobia-2019",
"title": "Tuscobia 2019"
}
],
"op_in_trx": 0,
"timestamp": "2020-03-02T01:46:15",
"trx_id": "f164b7ab0708a3fb13aabe81521af35eee3f1e27",
"trx_in_block": 17,
"virtual_op": 0
}areitzupvoted (100.00%) @areitz / the-gradle-profiler-part-1-introduction2020/02/08 00:09:39
areitzupvoted (100.00%) @areitz / the-gradle-profiler-part-1-introduction
2020/02/08 00:09:39
| author | areitz |
| permlink | the-gradle-profiler-part-1-introduction |
| voter | areitz |
| weight | 10000 (100.00%) |
| Transaction Info | Block #40624746/Trx 60bd5be0dadbf96e5c3c7aef4714080cfdb9a994 |
View Raw JSON Data
{
  "block": 40624746,
  "op": [
    "vote",
    {
      "author": "areitz",
      "permlink": "the-gradle-profiler-part-1-introduction",
      "voter": "areitz",
      "weight": 10000
    }
  ],
  "op_in_trx": 0,
  "timestamp": "2020-02-08T00:09:39",
  "trx_id": "60bd5be0dadbf96e5c3c7aef4714080cfdb9a994",
  "trx_in_block": 27,
  "virtual_op": 0
}areitzupvoted (100.00%) @areitz / the-gradle-profiler-part-two-finding-the-best-jvm-args2020/02/08 00:09:39
areitzupvoted (100.00%) @areitz / the-gradle-profiler-part-two-finding-the-best-jvm-args
2020/02/08 00:09:39
| author | areitz |
| permlink | the-gradle-profiler-part-two-finding-the-best-jvm-args |
| voter | areitz |
| weight | 10000 (100.00%) |
| Transaction Info | Block #40624746/Trx cec2f57ee509303d46b291243ef1fd2cefbc0604 |
View Raw JSON Data
{
  "block": 40624746,
  "op": [
    "vote",
    {
      "author": "areitz",
      "permlink": "the-gradle-profiler-part-two-finding-the-best-jvm-args",
      "voter": "areitz",
      "weight": 10000
    }
  ],
  "op_in_trx": 0,
  "timestamp": "2020-02-08T00:09:39",
  "trx_id": "cec2f57ee509303d46b291243ef1fd2cefbc0604",
  "trx_in_block": 5,
  "virtual_op": 0
}2019/09/22 17:50:57
2019/09/22 17:50:57
| delegatee | areitz |
| delegator | steem |
| vesting shares | 9895.913509 VESTS |
| Transaction Info | Block #36650526/Trx ac182dd9c1bd1eab0c3b647bc43c461c9e975f71 |
View Raw JSON Data
{
  "block": 36650526,
  "op": [
    "delegate_vesting_shares",
    {
      "delegatee": "areitz",
      "delegator": "steem",
      "vesting_shares": "9895.913509 VESTS"
    }
  ],
  "op_in_trx": 0,
  "timestamp": "2019-09-22T17:50:57",
  "trx_id": "ac182dd9c1bd1eab0c3b647bc43c461c9e975f71",
  "trx_in_block": 6,
  "virtual_op": 0
}areitzupvoted (100.00%) @coinsity / a-guide-to-make-money-with-bitcoin-lightning-network-nodes2019/07/04 02:11:39
areitzupvoted (100.00%) @coinsity / a-guide-to-make-money-with-bitcoin-lightning-network-nodes
2019/07/04 02:11:39
| author | coinsity |
| permlink | a-guide-to-make-money-with-bitcoin-lightning-network-nodes |
| voter | areitz |
| weight | 10000 (100.00%) |
| Transaction Info | Block #34354748/Trx 86953946e802fb723c95e89eca10c54c893f3265 |
View Raw JSON Data
{
  "block": 34354748,
  "op": [
    "vote",
    {
      "author": "coinsity",
      "permlink": "a-guide-to-make-money-with-bitcoin-lightning-network-nodes",
      "voter": "areitz",
      "weight": 10000
    }
  ],
  "op_in_trx": 0,
  "timestamp": "2019-07-04T02:11:39",
  "trx_id": "86953946e802fb723c95e89eca10c54c893f3265",
  "trx_in_block": 39,
  "virtual_op": 0
}areitzpublished a new post: the-gradle-profiler-part-two-finding-the-best-jvm-args2019/06/23 17:00:00
areitzpublished a new post: the-gradle-profiler-part-two-finding-the-best-jvm-args
2019/06/23 17:00:00
| author | areitz |
| body |  ### The Gradle Profiler: Part Two, finding the best JVM args. In [part one](https://medium.com/andrews-tech-blog/the-gradle-profiler-part-1-introduction-bdcbe70efe08) I covered what the Gradle Profiler is and how to use it. This time I will be taking a closer look at how to make your build faster by finding the best JVM memory arguments. As mentioned in the [_Build Bigger, Better: Gradle for Large Projects_](https://youtu.be/sQC9-Rj2yLI?t=1783) talk at Google I/O, JVM heap size is a value you can change to get drastically better performance out of your build. In the talk they said they used build scans to find the best option, following their lead lets see how we can use the Gradle Profiler to automate this task and get the best results for our development computer. This article assumes you have already set up the [Gradle Profiler](https://github.com/gradle/gradle-profiler). If not refer back to [part one](https://medium.com/andrews-tech-blog/the-gradle-profiler-part-1-introduction-bdcbe70efe08). I will be using the [plaid](https://github.com/android/plaid) app to profile against again so you can follow along. First things first, I will create a scenarios file that will repeat the same task but with different JVM arguments. For this scenario I have chosen to run the `assembleDebug` task because it’s the task I will be running time and time again as I work on an app, so it will be the task I want to optimize for. My development builds will most likely not be clean builds either but rather a change in a Gradle module. To mimic this I’ll use `apply-abi-change-to` which will change the file causing that module the file is in and any other dependent modules to be recompiled. With these parameters in mind I created the following scenario file¹. This scenario file is large, and it will take a while to run. You can remove scenarios to save time, but you might end up skipping configurations that would be best for your environment. You’ll notice in the `default-scenarios` section I have the `abi-assemble-default` and only the even number heap size scenarios. This is to speed up how long it will take to run these benchmarks. When I get the results I can update the `default-scenarios` or pass arguments to the Gradle Profiler to better match what I found, speeding up the whole process. Let’s get profiling! After executing `gradle-profiler --benchmark --project-dir . --scenario-file jvm-args-abi.scenarios` in the plaid directory, I get these results:  Results I cut off the top portion of the results to save some space, but you’ll notice the first column is the first scenario, `abi-assemble-default`. This is our performance baseline. As you can see the second column, the `abi-assebmle-2gb` scenario has a 7.69% faster mean build time then the default JVM arguments whereas every other argument was actually slower! That means 2 GB is probably just right. To be sure I will run `gradle-profiler --benchmark --project-dir --scenario-file jvm-args-abi.scenarios abi-assemble-default abi-assemble-1gb abi-assemble-2gb abi-assemble-3gb`, since we skipped 1GB and 3GB in the last run, resulting in the following output:  Results for 1gb, 2gb, and 3gb You can see here that 3GB did the best and this will probably be the value I choose to set in my `gradle-user-home`. Just to be certain this value is what I want, I will run the 2gb and 3gb scenarios with the profiler using build scans, to double check the build length and see how much time each of these builds spend on garbage collection. `gradle-profiler --profile buildscan --project-dir . --scenario-file jvm-args-abi.scenarios abi-assemble-2gb abi-assemble-3gb` . You can see my results here: [2GB](https://scans.gradle.com/s/mtfosxreo652a/performance/build) and [3GB](https://scans.gradle.com/s/masz2zotabwgg/performance/build). These are already on the performance tab, which is where you will want to go for your build’s. Since plaid is a pretty small app there doesn’t appear to be much of a difference here and I will choose the 3GB option. To set 3GB as my max heap size I will edit my `gradle.properties` file in my Gradle User Home (in `$HOME/.gradle/` by default). If the `gradle.properties` file doesn’t exist, simply create one with that name. I will add `org.gradle.jvmargs=-Xmx3G` on a single line in the file and save it. Now, when the Gradle Daemon starts up it will be able to use a max head size of 3GB. You can specify more [JVM arguments](https://docs.oracle.com/javase/7/docs/technotes/tools/solaris/java.html) on the right side of the equals, but it’s recommended to only adjust the memory arguments. For instance `-Xmx`, `-Xms` and **maybe** `-XX:MaxMetaspaceSize`, and make sure you profile these before you change them! I cannot stress this enough, **do not copy my heap size value**. My machine is most likely different than yours. Also, you will want to make sure you’re not doing anything on your computer while these tests are running, as that will skew your results². It’s probably worth benchmarking on your average development machine for your project and setting the values found as the defaults in your project’s `gradle.properties`. It’s also probably worth benchmarking and setting some different values for your CI server. Lastly, it is also worth adding a script that will run the profiler, so the other devs on your team can can find the best values for their machines. Big thanks to [Brendon](https://twitter.com/brendonjustin_) and Kristi for proof reading the article![1] I know very little about the plaid project structure and just chose the `ImageUriProvider.kt` because it was in the core package and assumed all other modules depended on it. You will want to optimize your own build for whichever module you change the most. IE. if you work on a certain feature that has it’s own module in your app, you will probably want the `apply-abi-change-to` to point to something in that module. [2] You probably noticed that 2GB didn’t do as well this time as last time, this is probably due to my computer falling asleep while I was running these tests. Why didn’t I re-run them? Mainly because you should not copy my results for you own machine, so it really doesn’t matter what I display here. |
| json metadata | {"tags":["android","kotlin","gradle","build-perf"],"image":["https://cdn-images-1.medium.com/max/800/1*tCw6MvZIDMgrugy95w7Zzw.jpeg","https://cdn-images-1.medium.com/max/800/1*ZtHD-ckBfbzV_zPwHr7_tw.png","https://cdn-images-1.medium.com/max/800/1*7GHrUty-tUAwE7J0LfT2Zw.png"],"links":["https://medium.com/andrews-tech-blog/the-gradle-profiler-part-1-introduction-bdcbe70efe08","https://youtu.be/sQC9-Rj2yLI?t=1783","https://github.com/gradle/gradle-profiler","https://github.com/android/plaid","https://scans.gradle.com/s/mtfosxreo652a/performance/build","https://scans.gradle.com/s/masz2zotabwgg/performance/build","https://docs.oracle.com/javase/7/docs/technotes/tools/solaris/java.html","https://twitter.com/brendonjustin_"],"app":"steemit/0.1","format":"markdown"} |
| parent author | |
| parent permlink | android |
| permlink | the-gradle-profiler-part-two-finding-the-best-jvm-args |
| title | The Gradle Profiler: Part Two, finding the best JVM args. |
| Transaction Info | Block #34056185/Trx c064cbbe211844f03815378c9a62b56dd2993f48 |
View Raw JSON Data
{
"block": 34056185,
"op": [
"comment",
{
"author": "areitz",
"body": "\n\n\n\n### The Gradle Profiler: Part Two, finding the best JVM args.\n\nIn [part one](https://medium.com/andrews-tech-blog/the-gradle-profiler-part-1-introduction-bdcbe70efe08) I covered what the Gradle Profiler is and how to use it. This time I will be taking a closer look at how to make your build faster by finding the best JVM memory arguments.\n\nAs mentioned in the [_Build Bigger, Better: Gradle for Large Projects_](https://youtu.be/sQC9-Rj2yLI?t=1783) talk at Google I/O, JVM heap size is a value you can change to get drastically better performance out of your build. In the talk they said they used build scans to find the best option, following their lead lets see how we can use the Gradle Profiler to automate this task and get the best results for our development computer.\n\nThis article assumes you have already set up the [Gradle Profiler](https://github.com/gradle/gradle-profiler). If not refer back to [part one](https://medium.com/andrews-tech-blog/the-gradle-profiler-part-1-introduction-bdcbe70efe08). I will be using the [plaid](https://github.com/android/plaid) app to profile against again so you can follow along.\n\nFirst things first, I will create a scenarios file that will repeat the same task but with different JVM arguments. For this scenario I have chosen to run the `assembleDebug` task because it’s the task I will be running time and time again as I work on an app, so it will be the task I want to optimize for. My development builds will most likely not be clean builds either but rather a change in a Gradle module. To mimic this I’ll use `apply-abi-change-to` which will change the file causing that module the file is in and any other dependent modules to be recompiled. With these parameters in mind I created the following scenario file¹.\n\n\n\n\nThis scenario file is large, and it will take a while to run. You can remove scenarios to save time, but you might end up skipping configurations that would be best for your environment. You’ll notice in the `default-scenarios` section I have the `abi-assemble-default` and only the even number heap size scenarios. This is to speed up how long it will take to run these benchmarks. When I get the results I can update the `default-scenarios` or pass arguments to the Gradle Profiler to better match what I found, speeding up the whole process.\n\nLet’s get profiling! After executing `gradle-profiler --benchmark --project-dir . --scenario-file jvm-args-abi.scenarios` in the plaid directory, I get these results:\n\n\n\n\n\n\nResults\n\n\n\nI cut off the top portion of the results to save some space, but you’ll notice the first column is the first scenario, `abi-assemble-default`. This is our performance baseline. As you can see the second column, the `abi-assebmle-2gb` scenario has a 7.69% faster mean build time then the default JVM arguments whereas every other argument was actually slower! That means 2 GB is probably just right. To be sure I will run `gradle-profiler --benchmark --project-dir --scenario-file jvm-args-abi.scenarios abi-assemble-default abi-assemble-1gb abi-assemble-2gb abi-assemble-3gb`, since we skipped 1GB and 3GB in the last run, resulting in the following output:\n\n\n\n\n\n\nResults for 1gb, 2gb, and 3gb\n\n\n\nYou can see here that 3GB did the best and this will probably be the value I choose to set in my `gradle-user-home`. Just to be certain this value is what I want, I will run the 2gb and 3gb scenarios with the profiler using build scans, to double check the build length and see how much time each of these builds spend on garbage collection. `gradle-profiler --profile buildscan --project-dir . --scenario-file jvm-args-abi.scenarios abi-assemble-2gb abi-assemble-3gb` . You can see my results here: [2GB](https://scans.gradle.com/s/mtfosxreo652a/performance/build) and [3GB](https://scans.gradle.com/s/masz2zotabwgg/performance/build). These are already on the performance tab, which is where you will want to go for your build’s. Since plaid is a pretty small app there doesn’t appear to be much of a difference here and I will choose the 3GB option.\n\nTo set 3GB as my max heap size I will edit my `gradle.properties` file in my Gradle User Home (in `$HOME/.gradle/` by default). If the `gradle.properties` file doesn’t exist, simply create one with that name. I will add `org.gradle.jvmargs=-Xmx3G` on a single line in the file and save it. Now, when the Gradle Daemon starts up it will be able to use a max head size of 3GB. You can specify more [JVM arguments](https://docs.oracle.com/javase/7/docs/technotes/tools/solaris/java.html) on the right side of the equals, but it’s recommended to only adjust the memory arguments. For instance `-Xmx`, `-Xms` and **maybe** `-XX:MaxMetaspaceSize`, and make sure you profile these before you change them!\n\nI cannot stress this enough, **do not copy my heap size value**. My machine is most likely different than yours. Also, you will want to make sure you’re not doing anything on your computer while these tests are running, as that will skew your results².\n\nIt’s probably worth benchmarking on your average development machine for your project and setting the values found as the defaults in your project’s `gradle.properties`. It’s also probably worth benchmarking and setting some different values for your CI server. Lastly, it is also worth adding a script that will run the profiler, so the other devs on your team can can find the best values for their machines.\n\nBig thanks to [Brendon](https://twitter.com/brendonjustin_) and Kristi for proof reading the article![1] I know very little about the plaid project structure and just chose the `ImageUriProvider.kt` because it was in the core package and assumed all other modules depended on it. You will want to optimize your own build for whichever module you change the most. IE. if you work on a certain feature that has it’s own module in your app, you will probably want the `apply-abi-change-to` to point to something in that module.\n\n[2] You probably noticed that 2GB didn’t do as well this time as last time, this is probably due to my computer falling asleep while I was running these tests. Why didn’t I re-run them? Mainly because you should not copy my results for you own machine, so it really doesn’t matter what I display here.",
"json_metadata": "{\"tags\":[\"android\",\"kotlin\",\"gradle\",\"build-perf\"],\"image\":[\"https://cdn-images-1.medium.com/max/800/1*tCw6MvZIDMgrugy95w7Zzw.jpeg\",\"https://cdn-images-1.medium.com/max/800/1*ZtHD-ckBfbzV_zPwHr7_tw.png\",\"https://cdn-images-1.medium.com/max/800/1*7GHrUty-tUAwE7J0LfT2Zw.png\"],\"links\":[\"https://medium.com/andrews-tech-blog/the-gradle-profiler-part-1-introduction-bdcbe70efe08\",\"https://youtu.be/sQC9-Rj2yLI?t=1783\",\"https://github.com/gradle/gradle-profiler\",\"https://github.com/android/plaid\",\"https://scans.gradle.com/s/mtfosxreo652a/performance/build\",\"https://scans.gradle.com/s/masz2zotabwgg/performance/build\",\"https://docs.oracle.com/javase/7/docs/technotes/tools/solaris/java.html\",\"https://twitter.com/brendonjustin_\"],\"app\":\"steemit/0.1\",\"format\":\"markdown\"}",
"parent_author": "",
"parent_permlink": "android",
"permlink": "the-gradle-profiler-part-two-finding-the-best-jvm-args",
"title": "The Gradle Profiler: Part Two, finding the best JVM args."
}
],
"op_in_trx": 0,
"timestamp": "2019-06-23T17:00:00",
"trx_id": "c064cbbe211844f03815378c9a62b56dd2993f48",
"trx_in_block": 16,
"virtual_op": 0
}minibotupvoted (5.00%) @areitz / the-gradle-profiler-part-1-introduction2019/06/23 16:54:42
minibotupvoted (5.00%) @areitz / the-gradle-profiler-part-1-introduction
2019/06/23 16:54:42
| author | areitz |
| permlink | the-gradle-profiler-part-1-introduction |
| voter | minibot |
| weight | 500 (5.00%) |
| Transaction Info | Block #34056079/Trx 11e554005b9735901e6b672a8af6ae090d56caca |
View Raw JSON Data
{
  "block": 34056079,
  "op": [
    "vote",
    {
      "author": "areitz",
      "permlink": "the-gradle-profiler-part-1-introduction",
      "voter": "minibot",
      "weight": 500
    }
  ],
  "op_in_trx": 0,
  "timestamp": "2019-06-23T16:54:42",
  "trx_id": "11e554005b9735901e6b672a8af6ae090d56caca",
  "trx_in_block": 10,
  "virtual_op": 0
}2019/06/23 16:54:06
2019/06/23 16:54:06
| author | cheetah |
| body | Hi! I am a robot. I just upvoted you! I found similar content that readers might be interested in: https://medium.com/andrews-tech-blog/the-gradle-profiler-part-1-introduction-bdcbe70efe08 |
| json metadata | |
| parent author | areitz |
| parent permlink | the-gradle-profiler-part-1-introduction |
| permlink | cheetah-re-areitzthe-gradle-profiler-part-1-introduction |
| title | |
| Transaction Info | Block #34056067/Trx 0fe5588c2247d3346db5c3a3e1ee8157a07d6b0d |
View Raw JSON Data
{
  "block": 34056067,
  "op": [
    "comment",
    {
      "author": "cheetah",
      "body": "Hi! I am a robot. I just upvoted you! I found similar content that readers might be interested in:\nhttps://medium.com/andrews-tech-blog/the-gradle-profiler-part-1-introduction-bdcbe70efe08",
      "json_metadata": "",
      "parent_author": "areitz",
      "parent_permlink": "the-gradle-profiler-part-1-introduction",
      "permlink": "cheetah-re-areitzthe-gradle-profiler-part-1-introduction",
      "title": ""
    }
  ],
  "op_in_trx": 0,
  "timestamp": "2019-06-23T16:54:06",
  "trx_id": "0fe5588c2247d3346db5c3a3e1ee8157a07d6b0d",
  "trx_in_block": 7,
  "virtual_op": 0
}cheetahupvoted (0.08%) @areitz / the-gradle-profiler-part-1-introduction2019/06/23 16:54:00
cheetahupvoted (0.08%) @areitz / the-gradle-profiler-part-1-introduction
2019/06/23 16:54:00
| author | areitz |
| permlink | the-gradle-profiler-part-1-introduction |
| voter | cheetah |
| weight | 8 (0.08%) |
| Transaction Info | Block #34056065/Trx 1c0f040d1779bd66bb61ff041cdaa70943de7b42 |
View Raw JSON Data
{
  "block": 34056065,
  "op": [
    "vote",
    {
      "author": "areitz",
      "permlink": "the-gradle-profiler-part-1-introduction",
      "voter": "cheetah",
      "weight": 8
    }
  ],
  "op_in_trx": 0,
  "timestamp": "2019-06-23T16:54:00",
  "trx_id": "1c0f040d1779bd66bb61ff041cdaa70943de7b42",
  "trx_in_block": 17,
  "virtual_op": 0
}areitzpublished a new post: the-gradle-profiler-part-1-introduction2019/06/23 16:53:42
areitzpublished a new post: the-gradle-profiler-part-1-introduction
2019/06/23 16:53:42
| author | areitz |
| body |  ### The Gradle Profiler: Part 1 Introduction The [Gradle Profiler](https://github.com/gradle/gradle-profiler) is a tool that I’ve been using a lot lately for both my personal and work projects. It was mentioned briefly during [one of the Gradle talks at Google I/O](https://www.youtube.com/watch?v=sQC9-Rj2yLI), but I feel like it needs a bit more focus. The Gradle Profiler is a tool that lets you accurately run different build scenarios over and over again, allowing you, your co-workers, and CI to run the exact same builds, so there are no discrepancies between build times or configurations used. It can be used to compare different changes in your code and see how they affect the build speed (benchmarking), as well as look into performance issues of the build (profiling). Step one is to get the [Gradle Profiler](https://github.com/gradle/gradle-profiler). It can be found on [Github](https://github.com/gradle/gradle-profiler). You will need to install it by cloning the repo or downloading the master branch as a zip file, because there hasn’t been an official release or a release strategy created yet¹. Once you have the Gradle Profiler’s source code, run `./gradlew installDist` to create a jar and startup scripts in the `build/install/gradle-profiler` directory. I like to add this to my path so I can reference it everywhere by updating my `.bashrc` with `PATH=$HOME/Projects/gradle-profiler/build/install/gradle-profiler/bin:$PATH`. As mentioned before you can either benchmark or profile with the Gradle Profiler. Let’s first look at profiling. There are many options for profilers you can hook into, but for this post we will look at [build scans](https://scans.gradle.com/). We will use [build scans](https://scans.gradle.com/) because they are free, require no setup, and can be really helpful in figuring out common builds issues. Why use the profiler with build scans when you can already use them by themselves? The Gradle Profiler is better at running your builds with build scans because it will ensure you are using a warm Gradle daemon, that your build scripts have been optimized by the JVM, and it uses a different Gradle user home so there is no cache interference. This gives a more reliable scan for performance tuning to look at. I’ll be using the [Plaid App](https://github.com/android/plaid) to demonstrate how to use the Gradle Profiler. Feel free to follow along. You can get the source code here [https://github.com/android/plaid](https://github.com/android/plaid). You can run the profiler from the command line in the plaid directory with `gradle-profiler --profile buildscan --project-dir . assemble`. This will run two warm up builds and then run one final build generating a build scan that will look something like this [https://gradle.com/s/xdnccdd7ax674](https://gradle.com/s/xdnccdd7ax674). If you click your build scan url, and if this is your first time running it you’ll need to enter your email, then you can see all the information about your build. Using the build scan to track down performance issues is out of scope for this blog post, and Gradle has lots of information on how you can use them, so I won’t be covering them here. I found [this talk really helpful](https://www.youtube.com/watch?v=MofXNalZU-E) by the way.  Task execution timeline To run benchmarks it’s a similar command `gradle-profiler --benchmark --project-dir . assemble`. Benchmarks will run six warm up builds and ten measured builds. When it’s complete you will see output like this. > * Results written to /Projects/plaid/profile-out > /Projects/plaid/profile-out/benchmark.csv > /Projects/plaid/profile-out/benchmark.html If you open up the html file you can see a graph and calculated averages, like this.  This information is interesting, but doesn’t really show us much, which is also true of our previous profile run. If our build is setup correctly, an assemble task after the first warm up should not be recompiling anything. If you are seeing tasks recompile you have some issues with how your build is setup. You shouldn’t see anything happening here other than config time. _Side note: this shows how important it is to get your config time as fast as possible is_. How can we get more information out of these builds scans? For this we can use build scenarios. Scenarios are files (which can be named anything, but the convention is that they end in `.scenario(s)`) with type safe configuration information that describe how to run your build. For our example in the plaid app lets create a file that shows our configuration time, our clean build time, and what an ABI change looks like. The resulting file would look something like this. Now we can run it with `gradle-profiler --benchmark --project-dir . --scenario-file profiler.scenarios`. This runs all the scenarios in the file, if you want to run a specific scenario you can pass its name to the end of that last command. If you have a lot of scenarios, consider setting a default set of scenarios with this configuration at the top of the file `default-scenarios = ["cleanAssemble”]` The same `— scenario-file` input can also be used for profiling.  Let’s go over what’s in the scenario file. First is the name: this can be anything you want. Next is the body: we use `tasks` to specify what tasks we want to run on each scenario. You can add as many as you’d like. There are also `cleanup-tasks` which are tasks that should be run between builds and not included in the profile/benchmark time. In `cleanAssemble` we run `clean` and `cleanBuildCache` to make sure this build is like a clean build. In `abiAssemble` we are using `apply-abi-change-to` to tell the profiler to update the Kotlin file so that it causes the public api to change, which would cause other modules to recompile. Basically the profiler adds a public function to that file. There are a lot more parameters you can set setup, but hopefully this is enough to get you started. The data in this benchmark doesn’t really go together, so this would be a good scenario file for keeping track of build performance over time, or a using the a single scenario with a profiler to figure out issues with your build. I plan to create a few more blog posts about how we can use these scenario files to find more valuable information about our build and get our builds running in peak performance. Big thanks to my reviewers, Kristi, Chelsea, and Renee![1]: You should vote on this [issue](https://github.com/gradle/gradle-profiler/issues/8) if you want this, and hopefully someday we can install it with [brew](https://brew.sh/) or [sdkman](https://sdkman.io/). I did make a [gradle-profiler wrapper](https://github.com/AndrewReitz/gradle-profiler-wrapper) script that you are more than welcome to try out but it’s nowhere near prime time and only works on Linux and Mac computers. |
| json metadata | {"tags":["android","gradle","kotlin","build-perf"],"image":["https://cdn-images-1.medium.com/max/800/1*zdfdfygp-Tjmcn1bB3gcYw.jpeg","https://cdn-images-1.medium.com/max/800/1*sGk27u0lgjHtDHL_JXYNQQ.png","https://cdn-images-1.medium.com/max/800/1*1cRNkauRAgEnkoPKRHegpQ.png","https://cdn-images-1.medium.com/max/800/1*2WF6WdSxdzwrr71_wB_Ztw.png"],"links":["https://github.com/gradle/gradle-profiler","https://www.youtube.com/watch?v=sQC9-Rj2yLI","https://scans.gradle.com/","https://github.com/android/plaid","https://gradle.com/s/xdnccdd7ax674","https://www.youtube.com/watch?v=MofXNalZU-E","https://github.com/gradle/gradle-profiler/issues/8","https://brew.sh/","https://sdkman.io/","https://github.com/AndrewReitz/gradle-profiler-wrapper"],"app":"steemit/0.1","format":"markdown"} |
| parent author | |
| parent permlink | android |
| permlink | the-gradle-profiler-part-1-introduction |
| title | The Gradle Profiler: Part 1 Introduction |
| Transaction Info | Block #34056059/Trx df07f5392414627ced08a1d61f2a727a10aef60e |
View Raw JSON Data
{
"block": 34056059,
"op": [
"comment",
{
"author": "areitz",
"body": "\n\n\n\n### The Gradle Profiler: Part 1 Introduction\n\nThe [Gradle Profiler](https://github.com/gradle/gradle-profiler) is a tool that I’ve been using a lot lately for both my personal and work projects. It was mentioned briefly during [one of the Gradle talks at Google I/O](https://www.youtube.com/watch?v=sQC9-Rj2yLI), but I feel like it needs a bit more focus.\n\nThe Gradle Profiler is a tool that lets you accurately run different build scenarios over and over again, allowing you, your co-workers, and CI to run the exact same builds, so there are no discrepancies between build times or configurations used. It can be used to compare different changes in your code and see how they affect the build speed (benchmarking), as well as look into performance issues of the build (profiling).\n\nStep one is to get the [Gradle Profiler](https://github.com/gradle/gradle-profiler). It can be found on [Github](https://github.com/gradle/gradle-profiler). You will need to install it by cloning the repo or downloading the master branch as a zip file, because there hasn’t been an official release or a release strategy created yet¹.\n\nOnce you have the Gradle Profiler’s source code, run `./gradlew installDist` to create a jar and startup scripts in the `build/install/gradle-profiler` directory. I like to add this to my path so I can reference it everywhere by updating my `.bashrc` with `PATH=$HOME/Projects/gradle-profiler/build/install/gradle-profiler/bin:$PATH`.\n\nAs mentioned before you can either benchmark or profile with the Gradle Profiler. Let’s first look at profiling. There are many options for profilers you can hook into, but for this post we will look at [build scans](https://scans.gradle.com/). We will use [build scans](https://scans.gradle.com/) because they are free, require no setup, and can be really helpful in figuring out common builds issues.\n\nWhy use the profiler with build scans when you can already use them by themselves? The Gradle Profiler is better at running your builds with build scans because it will ensure you are using a warm Gradle daemon, that your build scripts have been optimized by the JVM, and it uses a different Gradle user home so there is no cache interference. This gives a more reliable scan for performance tuning to look at.\n\nI’ll be using the [Plaid App](https://github.com/android/plaid) to demonstrate how to use the Gradle Profiler. Feel free to follow along. You can get the source code here [https://github.com/android/plaid](https://github.com/android/plaid).\n\nYou can run the profiler from the command line in the plaid directory with `gradle-profiler --profile buildscan --project-dir . assemble`. This will run two warm up builds and then run one final build generating a build scan that will look something like this [https://gradle.com/s/xdnccdd7ax674](https://gradle.com/s/xdnccdd7ax674). If you click your build scan url, and if this is your first time running it you’ll need to enter your email, then you can see all the information about your build. Using the build scan to track down performance issues is out of scope for this blog post, and Gradle has lots of information on how you can use them, so I won’t be covering them here. I found [this talk really helpful](https://www.youtube.com/watch?v=MofXNalZU-E) by the way.\n\n\n\n\n\n\nTask execution timeline\n\n\n\nTo run benchmarks it’s a similar command `gradle-profiler --benchmark --project-dir . assemble`. Benchmarks will run six warm up builds and ten measured builds. When it’s complete you will see output like this.\n> * Results written to /Projects/plaid/profile-out \n> /Projects/plaid/profile-out/benchmark.csv \n> /Projects/plaid/profile-out/benchmark.html\n\nIf you open up the html file you can see a graph and calculated averages, like this.\n\n\n\n\n\n\n\n\nThis information is interesting, but doesn’t really show us much, which is also true of our previous profile run. If our build is setup correctly, an assemble task after the first warm up should not be recompiling anything. If you are seeing tasks recompile you have some issues with how your build is setup. You shouldn’t see anything happening here other than config time. _Side note: this shows how important it is to get your config time as fast as possible is_.\n\nHow can we get more information out of these builds scans? For this we can use build scenarios. Scenarios are files (which can be named anything, but the convention is that they end in `.scenario(s)`) with type safe configuration information that describe how to run your build. For our example in the plaid app lets create a file that shows our configuration time, our clean build time, and what an ABI change looks like. The resulting file would look something like this.\n\n\n\n\nNow we can run it with `gradle-profiler --benchmark --project-dir . --scenario-file profiler.scenarios`.\n\nThis runs all the scenarios in the file, if you want to run a specific scenario you can pass its name to the end of that last command. If you have a lot of scenarios, consider setting a default set of scenarios with this configuration at the top of the file `default-scenarios = ["cleanAssemble”]` The same `— scenario-file` input can also be used for profiling.\n\n\n\n\n\n\n\n\nLet’s go over what’s in the scenario file. First is the name: this can be anything you want. Next is the body: we use `tasks` to specify what tasks we want to run on each scenario. You can add as many as you’d like. There are also `cleanup-tasks` which are tasks that should be run between builds and not included in the profile/benchmark time. In `cleanAssemble` we run `clean` and `cleanBuildCache` to make sure this build is like a clean build. In `abiAssemble` we are using `apply-abi-change-to` to tell the profiler to update the Kotlin file so that it causes the public api to change, which would cause other modules to recompile. Basically the profiler adds a public function to that file.\n\nThere are a lot more parameters you can set setup, but hopefully this is enough to get you started. The data in this benchmark doesn’t really go together, so this would be a good scenario file for keeping track of build performance over time, or a using the a single scenario with a profiler to figure out issues with your build. I plan to create a few more blog posts about how we can use these scenario files to find more valuable information about our build and get our builds running in peak performance.\n\nBig thanks to my reviewers, Kristi, Chelsea, and Renee![1]: You should vote on this [issue](https://github.com/gradle/gradle-profiler/issues/8) if you want this, and hopefully someday we can install it with [brew](https://brew.sh/) or [sdkman](https://sdkman.io/). I did make a [gradle-profiler wrapper](https://github.com/AndrewReitz/gradle-profiler-wrapper) script that you are more than welcome to try out but it’s nowhere near prime time and only works on Linux and Mac computers.",
"json_metadata": "{\"tags\":[\"android\",\"gradle\",\"kotlin\",\"build-perf\"],\"image\":[\"https://cdn-images-1.medium.com/max/800/1*zdfdfygp-Tjmcn1bB3gcYw.jpeg\",\"https://cdn-images-1.medium.com/max/800/1*sGk27u0lgjHtDHL_JXYNQQ.png\",\"https://cdn-images-1.medium.com/max/800/1*1cRNkauRAgEnkoPKRHegpQ.png\",\"https://cdn-images-1.medium.com/max/800/1*2WF6WdSxdzwrr71_wB_Ztw.png\"],\"links\":[\"https://github.com/gradle/gradle-profiler\",\"https://www.youtube.com/watch?v=sQC9-Rj2yLI\",\"https://scans.gradle.com/\",\"https://github.com/android/plaid\",\"https://gradle.com/s/xdnccdd7ax674\",\"https://www.youtube.com/watch?v=MofXNalZU-E\",\"https://github.com/gradle/gradle-profiler/issues/8\",\"https://brew.sh/\",\"https://sdkman.io/\",\"https://github.com/AndrewReitz/gradle-profiler-wrapper\"],\"app\":\"steemit/0.1\",\"format\":\"markdown\"}",
"parent_author": "",
"parent_permlink": "android",
"permlink": "the-gradle-profiler-part-1-introduction",
"title": "The Gradle Profiler: Part 1 Introduction"
}
],
"op_in_trx": 0,
"timestamp": "2019-06-23T16:53:42",
"trx_id": "df07f5392414627ced08a1d61f2a727a10aef60e",
"trx_in_block": 5,
"virtual_op": 0
}2019/06/22 01:36:42
2019/06/22 01:36:42
| delegatee | areitz |
| delegator | steem |
| vesting shares | 29853.451127 VESTS |
| Transaction Info | Block #34008961/Trx 41975cd63bd8c14c81074e82d3936f0f98276e97 |
View Raw JSON Data
{
  "block": 34008961,
  "op": [
    "delegate_vesting_shares",
    {
      "delegatee": "areitz",
      "delegator": "steem",
      "vesting_shares": "29853.451127 VESTS"
    }
  ],
  "op_in_trx": 0,
  "timestamp": "2019-06-22T01:36:42",
  "trx_id": "41975cd63bd8c14c81074e82d3936f0f98276e97",
  "trx_in_block": 9,
  "virtual_op": 0
}2019/06/22 00:01:03
2019/06/22 00:01:03
| delegatee | areitz |
| delegator | steem |
| vesting shares | 30300.000000 VESTS |
| Transaction Info | Block #34007051/Trx 3ff623bc69eeff2202cbbc2248c848750dab36e5 |
View Raw JSON Data
{
  "block": 34007051,
  "op": [
    "delegate_vesting_shares",
    {
      "delegatee": "areitz",
      "delegator": "steem",
      "vesting_shares": "30300.000000 VESTS"
    }
  ],
  "op_in_trx": 0,
  "timestamp": "2019-06-22T00:01:03",
  "trx_id": "3ff623bc69eeff2202cbbc2248c848750dab36e5",
  "trx_in_block": 24,
  "virtual_op": 0
}2019/06/22 00:01:03
2019/06/22 00:01:03
| active | {"account_auths":[],"key_auths":[["STM6KZqZuRqVeuxt8KMh6RYDZZijyukaiqU1c58LNu9frMU55cuSK",1]],"weight_threshold":1} |
| creator | steem |
| extensions | [] |
| json metadata | {} |
| memo key | STM6hhjDc1uoD9As5zadA67RqF1rGQWBQ4en51CMxhsWPF1tgbYw9 |
| new account name | areitz |
| owner | {"account_auths":[],"key_auths":[["STM6BaXEVELpYbcB3qBnSSqTEFi64Z2zt6zgp292ZGXHJWh3CkBCR",1]],"weight_threshold":1} |
| posting | {"account_auths":[],"key_auths":[["STM5AfECW75Nf85mpERLMB4586WCin6XNmCViQ5nS1en19n1YsynV",1]],"weight_threshold":1} |
| Transaction Info | Block #34007051/Trx 3ff623bc69eeff2202cbbc2248c848750dab36e5 |
View Raw JSON Data
{
  "block": 34007051,
  "op": [
    "create_claimed_account",
    {
      "active": {
        "account_auths": [],
        "key_auths": [
          [
            "STM6KZqZuRqVeuxt8KMh6RYDZZijyukaiqU1c58LNu9frMU55cuSK",
            1
          ]
        ],
        "weight_threshold": 1
      },
      "creator": "steem",
      "extensions": [],
      "json_metadata": "{}",
      "memo_key": "STM6hhjDc1uoD9As5zadA67RqF1rGQWBQ4en51CMxhsWPF1tgbYw9",
      "new_account_name": "areitz",
      "owner": {
        "account_auths": [],
        "key_auths": [
          [
            "STM6BaXEVELpYbcB3qBnSSqTEFi64Z2zt6zgp292ZGXHJWh3CkBCR",
            1
          ]
        ],
        "weight_threshold": 1
      },
      "posting": {
        "account_auths": [],
        "key_auths": [
          [
            "STM5AfECW75Nf85mpERLMB4586WCin6XNmCViQ5nS1en19n1YsynV",
            1
          ]
        ],
        "weight_threshold": 1
      }
    }
  ],
  "op_in_trx": 0,
  "timestamp": "2019-06-22T00:01:03",
  "trx_id": "3ff623bc69eeff2202cbbc2248c848750dab36e5",
  "trx_in_block": 24,
  "virtual_op": 0
}Manabar
Voting Power100.00%
Downvote Power100.00%
Resource Credits100.00%
Reputation Progress0.00%
{
  "voting_manabar": {
    "current_mana": 1912543513,
    "last_update_time": 1607221359
  },
  "downvote_manabar": {
    "current_mana": 478135878,
    "last_update_time": 1607221359
  },
  "rc_account": {
    "account": "areitz",
    "rc_manabar": {
      "current_mana": "11830646378",
      "last_update_time": 1607221359
    },
    "max_rc_creation_adjustment": {
      "amount": "5970712957",
      "precision": 6,
      "nai": "@@000000037"
    },
    "max_rc": "7883256470"
  }
}
Account Metadata
| POSTING JSON METADATA | |
| None | |
| JSON METADATA | |
| None |
{
  "posting_json_metadata": {},
  "json_metadata": {}
}
Auth Keys
Owner
Single Signature
Public Keys
STM6BaXEVELpYbcB3qBnSSqTEFi64Z2zt6zgp292ZGXHJWh3CkBCR1/1
Active
Single Signature
Public Keys
STM6KZqZuRqVeuxt8KMh6RYDZZijyukaiqU1c58LNu9frMU55cuSK1/1
Posting
Single Signature
Public Keys
STM5AfECW75Nf85mpERLMB4586WCin6XNmCViQ5nS1en19n1YsynV1/1
Memo
STM6hhjDc1uoD9As5zadA67RqF1rGQWBQ4en51CMxhsWPF1tgbYw9
{
  "owner": {
    "weight_threshold": 1,
    "account_auths": [],
    "key_auths": [
      [
        "STM6BaXEVELpYbcB3qBnSSqTEFi64Z2zt6zgp292ZGXHJWh3CkBCR",
        1
      ]
    ]
  },
  "active": {
    "weight_threshold": 1,
    "account_auths": [],
    "key_auths": [
      [
        "STM6KZqZuRqVeuxt8KMh6RYDZZijyukaiqU1c58LNu9frMU55cuSK",
        1
      ]
    ]
  },
  "posting": {
    "weight_threshold": 1,
    "account_auths": [],
    "key_auths": [
      [
        "STM5AfECW75Nf85mpERLMB4586WCin6XNmCViQ5nS1en19n1YsynV",
        1
      ]
    ]
  },
  "memo": "STM6hhjDc1uoD9As5zadA67RqF1rGQWBQ4en51CMxhsWPF1tgbYw9"
}
Witness Votes
0 / 30
No active witness votes.
[]