@midastouch
47Our mission is to help investor and traders to become profitable & wealthy
steemit.com/@midastouchVOTING POWER100.00%
DOWNVOTE POWER100.00%
RESOURCE CREDITS100.00%
REPUTATION PROGRESS95.22%
Net Worth
0.684USD
STEEM
0.168STEEM
SBD
0.618SBD
Own SP
6.515SP
Detailed Balance
| STEEM | ||
| balance | 0.168STEEM | STEEM |
| market_balance | 0.000STEEM | STEEM |
| savings_balance | 0.000STEEM | STEEM |
| reward_steem_balance | 0.000STEEM | STEEM |
| STEEM POWER | ||
| Own SP | 6.515SP | SP |
| Delegated Out | 0.000SP | SP |
| Delegation In | 0.000SP | SP |
| Effective Power | 6.515SP | SP |
| Reward SP (pending) | 0.000SP | SP |
| SBD | ||
| sbd_balance | 0.225SBD | SBD |
| sbd_conversions | 0.000SBD | SBD |
| sbd_market_balance | 0.000SBD | SBD |
| savings_sbd_balance | 0.393SBD | SBD |
| reward_sbd_balance | 0.000SBD | SBD |
{
  "balance": "0.168 STEEM",
  "savings_balance": "0.000 STEEM",
  "reward_steem_balance": "0.000 STEEM",
  "vesting_shares": "10596.878789 VESTS",
  "delegated_vesting_shares": "0.000000 VESTS",
  "received_vesting_shares": "0.000000 VESTS",
  "sbd_balance": "0.225 SBD",
  "savings_sbd_balance": "0.393 SBD",
  "reward_sbd_balance": "0.000 SBD",
  "conversions": []
}
Account Info
| name | midastouch |
| id | 202507 |
| rank | 186,934 |
| reputation | 274876452974 |
| created | 2017-06-17T15:02:09 |
| recovery_account | steem |
| proxy | None |
| post_count | 152 |
| comment_count | 0 |
| lifetime_vote_count | 0 |
| witnesses_voted_for | 0 |
| last_post | 2023-06-20T17:27:21 |
| last_root_post | 2023-06-20T17:27:21 |
| last_vote_time | 2023-06-20T17:27:30 |
| proxied_vsf_votes | 0, 0, 0, 0 |
| can_vote | 1 |
| voting_power | 9,799 |
| delayed_votes | 0 |
| balance | 0.168 STEEM |
| savings_balance | 0.000 STEEM |
| sbd_balance | 0.225 SBD |
| savings_sbd_balance | 0.393 SBD |
| vesting_shares | 10596.878789 VESTS |
| delegated_vesting_shares | 0.000000 VESTS |
| received_vesting_shares | 0.000000 VESTS |
| reward_vesting_balance | 0.000000 VESTS |
| vesting_balance | 0.000 STEEM |
| vesting_withdraw_rate | 0.000000 VESTS |
| next_vesting_withdrawal | 1969-12-31T23:59:59 |
| withdrawn | 9755827393 |
| to_withdraw | 9755827393 |
| withdraw_routes | 0 |
| savings_withdraw_requests | 0 |
| last_account_recovery | 1970-01-01T00:00:00 |
| reset_account | null |
| last_owner_update | 1970-01-01T00:00:00 |
| last_account_update | 2022-10-23T08:58:54 |
| mined | No |
| sbd_seconds | 157,812,975 |
| sbd_last_interest_payment | 2022-10-23T08:56:24 |
| savings_sbd_last_interest_payment | 2020-06-25T21:38:51 |
{
  "active": {
    "account_auths": [],
    "key_auths": [
      [
        "STM6nErtHyDKMfNTQm9zHwZhKZaY6jx73HvWZGa528E2GeGotLU4n",
        1
      ]
    ],
    "weight_threshold": 1
  },
  "balance": "0.168 STEEM",
  "can_vote": true,
  "comment_count": 0,
  "created": "2017-06-17T15:02:09",
  "curation_rewards": 135,
  "delegated_vesting_shares": "0.000000 VESTS",
  "downvote_manabar": {
    "current_mana": 2649219697,
    "last_update_time": 1687282050
  },
  "guest_bloggers": [],
  "id": 202507,
  "json_metadata": "{\"profile\":{\"name\":\"MidasTouchConsulting\",\"location\":\"Munich\",\"about\":\"Our mission is to help investor and traders to become profitable & wealthy\",\"website\":\"https://www.midastouch-consulting.com\",\"cover_image\":\"https://www.midastouch-consulting.com/wp-content/uploads/2018/03/midas-touch-share-motiv-f.jpg\",\"profile_image\":\"https://postimg.org/image/eqeafo8d7/\"}}",
  "last_account_recovery": "1970-01-01T00:00:00",
  "last_account_update": "2022-10-23T08:58:54",
  "last_owner_update": "1970-01-01T00:00:00",
  "last_post": "2023-06-20T17:27:21",
  "last_root_post": "2023-06-20T17:27:21",
  "last_vote_time": "2023-06-20T17:27:30",
  "lifetime_vote_count": 0,
  "market_history": [],
  "memo_key": "STM6nXES3DY2mv1C44ZqstuL9sqTH16i2gUWqc1p3YJboT3s7oTLm",
  "mined": false,
  "name": "midastouch",
  "next_vesting_withdrawal": "1969-12-31T23:59:59",
  "other_history": [],
  "owner": {
    "account_auths": [],
    "key_auths": [
      [
        "STM7qnW5aLRaEC478SV8q51qPdzFUxMCAHZ7dq1Da2tDrxRhRYPsD",
        1
      ]
    ],
    "weight_threshold": 1
  },
  "pending_claimed_accounts": 0,
  "post_bandwidth": 0,
  "post_count": 152,
  "post_history": [],
  "posting": {
    "account_auths": [],
    "key_auths": [
      [
        "STM5ZjdDXzNP35hTAdWW1vRdavFQLbnV5bg4rXkgjPS65tBz2bR2y",
        1
      ]
    ],
    "weight_threshold": 1
  },
  "posting_json_metadata": "{\"profile\":{\"name\":\"MidasTouchConsulting\",\"location\":\"Munich\",\"about\":\"Our mission is to help investor and traders to become profitable & wealthy\",\"website\":\"https://www.midastouch-consulting.com\",\"cover_image\":\"https://cdn.steemitimages.com/DQmWE9M5BHdDJYiSU9SXgJsQ6FxpXZPAeEpMaSuc3B38TsS/Bitcoin%20&%20Gold.jpg\",\"profile_image\":\"https://postimg.org/image/eqeafo8d7/\",\"version\":2}}",
  "posting_rewards": 26783,
  "proxied_vsf_votes": [
    0,
    0,
    0,
    0
  ],
  "proxy": "",
  "received_vesting_shares": "0.000000 VESTS",
  "recovery_account": "steem",
  "reputation": "274876452974",
  "reset_account": "null",
  "reward_sbd_balance": "0.000 SBD",
  "reward_steem_balance": "0.000 STEEM",
  "reward_vesting_balance": "0.000000 VESTS",
  "reward_vesting_steem": "0.000 STEEM",
  "savings_balance": "0.000 STEEM",
  "savings_sbd_balance": "0.393 SBD",
  "savings_sbd_last_interest_payment": "2020-06-25T21:38:51",
  "savings_sbd_seconds": "0",
  "savings_sbd_seconds_last_update": "2020-06-25T21:38:51",
  "savings_withdraw_requests": 0,
  "sbd_balance": "0.225 SBD",
  "sbd_last_interest_payment": "2022-10-23T08:56:24",
  "sbd_seconds": "157812975",
  "sbd_seconds_last_update": "2022-10-31T11:46:15",
  "tags_usage": [],
  "to_withdraw": "9755827393",
  "transfer_history": [],
  "vesting_balance": "0.000 STEEM",
  "vesting_shares": "10596.878789 VESTS",
  "vesting_withdraw_rate": "0.000000 VESTS",
  "vote_history": [],
  "voting_manabar": {
    "current_mana": "10384941213",
    "last_update_time": 1687282050
  },
  "voting_power": 9799,
  "withdraw_routes": 0,
  "withdrawn": "9755827393",
  "witness_votes": [],
  "witnesses_voted_for": 0,
  "rank": 186934
}
Withdraw Routes
| Incoming | Outgoing |
|---|---|
Empty | Empty |
{
  "incoming": [],
  "outgoing": []
}From Date
To Date
alexmove.witnesssent 0.001 STEEM to @midastouch- "Hi, midastouch! If you like contests, then I invite you to take part in a series of contests "Workplace" from SelfDevelopment Club. Total prize fund: 375 STEEM. Details in the SelfDevelopment Club com..."2023/06/20 20:01:03
alexmove.witnesssent 0.001 STEEM to @midastouch- "Hi, midastouch! If you like contests, then I invite you to take part in a series of contests "Workplace" from SelfDevelopment Club. Total prize fund: 375 STEEM. Details in the SelfDevelopment Club com..."
2023/06/20 20:01:03
| amount | 0.001 STEEM |
| from | alexmove.witness |
| memo | Hi, midastouch! If you like contests, then I invite you to take part in a series of contests "Workplace" from SelfDevelopment Club. Total prize fund: 375 STEEM. Details in the SelfDevelopment Club community. Have a good day, midastouch! Good luck! 20230620 |
| to | midastouch |
| Transaction Info | Block #75681785/Trx 10cfa635514718f91fa6914e8a4e356530e80dec |
View Raw JSON Data
{
  "block": 75681785,
  "op": [
    "transfer",
    {
      "amount": "0.001 STEEM",
      "from": "alexmove.witness",
      "memo": "Hi, midastouch! If you like contests, then I invite you to take part in a series of contests \"Workplace\" from SelfDevelopment Club. Total prize fund: 375 STEEM. Details in the SelfDevelopment Club community. Have a good day, midastouch! Good luck! 20230620",
      "to": "midastouch"
    }
  ],
  "op_in_trx": 0,
  "timestamp": "2023-06-20T20:01:03",
  "trx_id": "10cfa635514718f91fa6914e8a4e356530e80dec",
  "trx_in_block": 7,
  "virtual_op": 0
}2023/06/20 17:27:30
2023/06/20 17:27:30
| author | midastouch |
| permlink | june-17th-2023-bitcoin-new-fantasy-despite-summer-lull-and-uncertainties |
| voter | midastouch |
| weight | 10000 (100.00%) |
| Transaction Info | Block #75678726/Trx 5fa33b79546e8171fe2e63b335b88ac7cbc3619d |
View Raw JSON Data
{
  "block": 75678726,
  "op": [
    "vote",
    {
      "author": "midastouch",
      "permlink": "june-17th-2023-bitcoin-new-fantasy-despite-summer-lull-and-uncertainties",
      "voter": "midastouch",
      "weight": 10000
    }
  ],
  "op_in_trx": 0,
  "timestamp": "2023-06-20T17:27:30",
  "trx_id": "5fa33b79546e8171fe2e63b335b88ac7cbc3619d",
  "trx_in_block": 2,
  "virtual_op": 0
}midastouchpublished a new post: june-17th-2023-bitcoin-new-fantasy-despite-summer-lull-and-uncertainties2023/06/20 17:27:21
midastouchpublished a new post: june-17th-2023-bitcoin-new-fantasy-despite-summer-lull-and-uncertainties
2023/06/20 17:27:21
| author | midastouch |
| body |  # [June 17th, 2023, Bitcoin – New fantasy despite summer lull and uncertainties](https://www.midastouch-consulting.com/17062023-bitcoin-new-fantasy-despite-summer-lull-and-uncertainties) With prices reaching nearly USD 31,000, Bitcoin’s recovery rally hit its peak on April 14th. This resulted in a doubling of prices within a span of five months. Our initial two price targets of USD 25,000 and USD 30,000 were achieved. Bitcoin – New fantasy despite summer lull and uncertainties. ### Review However, since mid-April, Bitcoin has been drifting into a sluggish consolidation, reaching lows of around USD 24,750 last Thursday, which represents a decline of over 20%. As a result of this correction, the overall market capitalization of the entire crypto sector decreased from USD 1.26 trillion down to USD 1.02 trillion, a decline of approximately 19%. Due to the significant downward pressure on most altcoins in recent weeks, the Bitcoin dominance has risen to 48%. #### Strong bounce in the last two days Nevertheless, in the past two days, Bitcoin bulls have made a comeback. With a sharp recovery, prices have already rebounded by around 8.2% to approximately USD 26,850. While it is not yet a sustainable trend reversal, it is at least a clear sign of life! The reason behind this increase is likely the announcement that Blackrock, the world’s largest asset manager, has filed an application with the US Securities and Exchange Commission (SEC) for a Bitcoin exchange-traded fund (ETF) based on spot prices. The approval of such an ETF by the SEC is highly uncertain, as previous Bitcoin ETF applications have faced significant resistance and concerns from regulatory authorities. If the SEC does approve Blackrock’s application, a flood of new Bitcoin ETF products could enter the market. 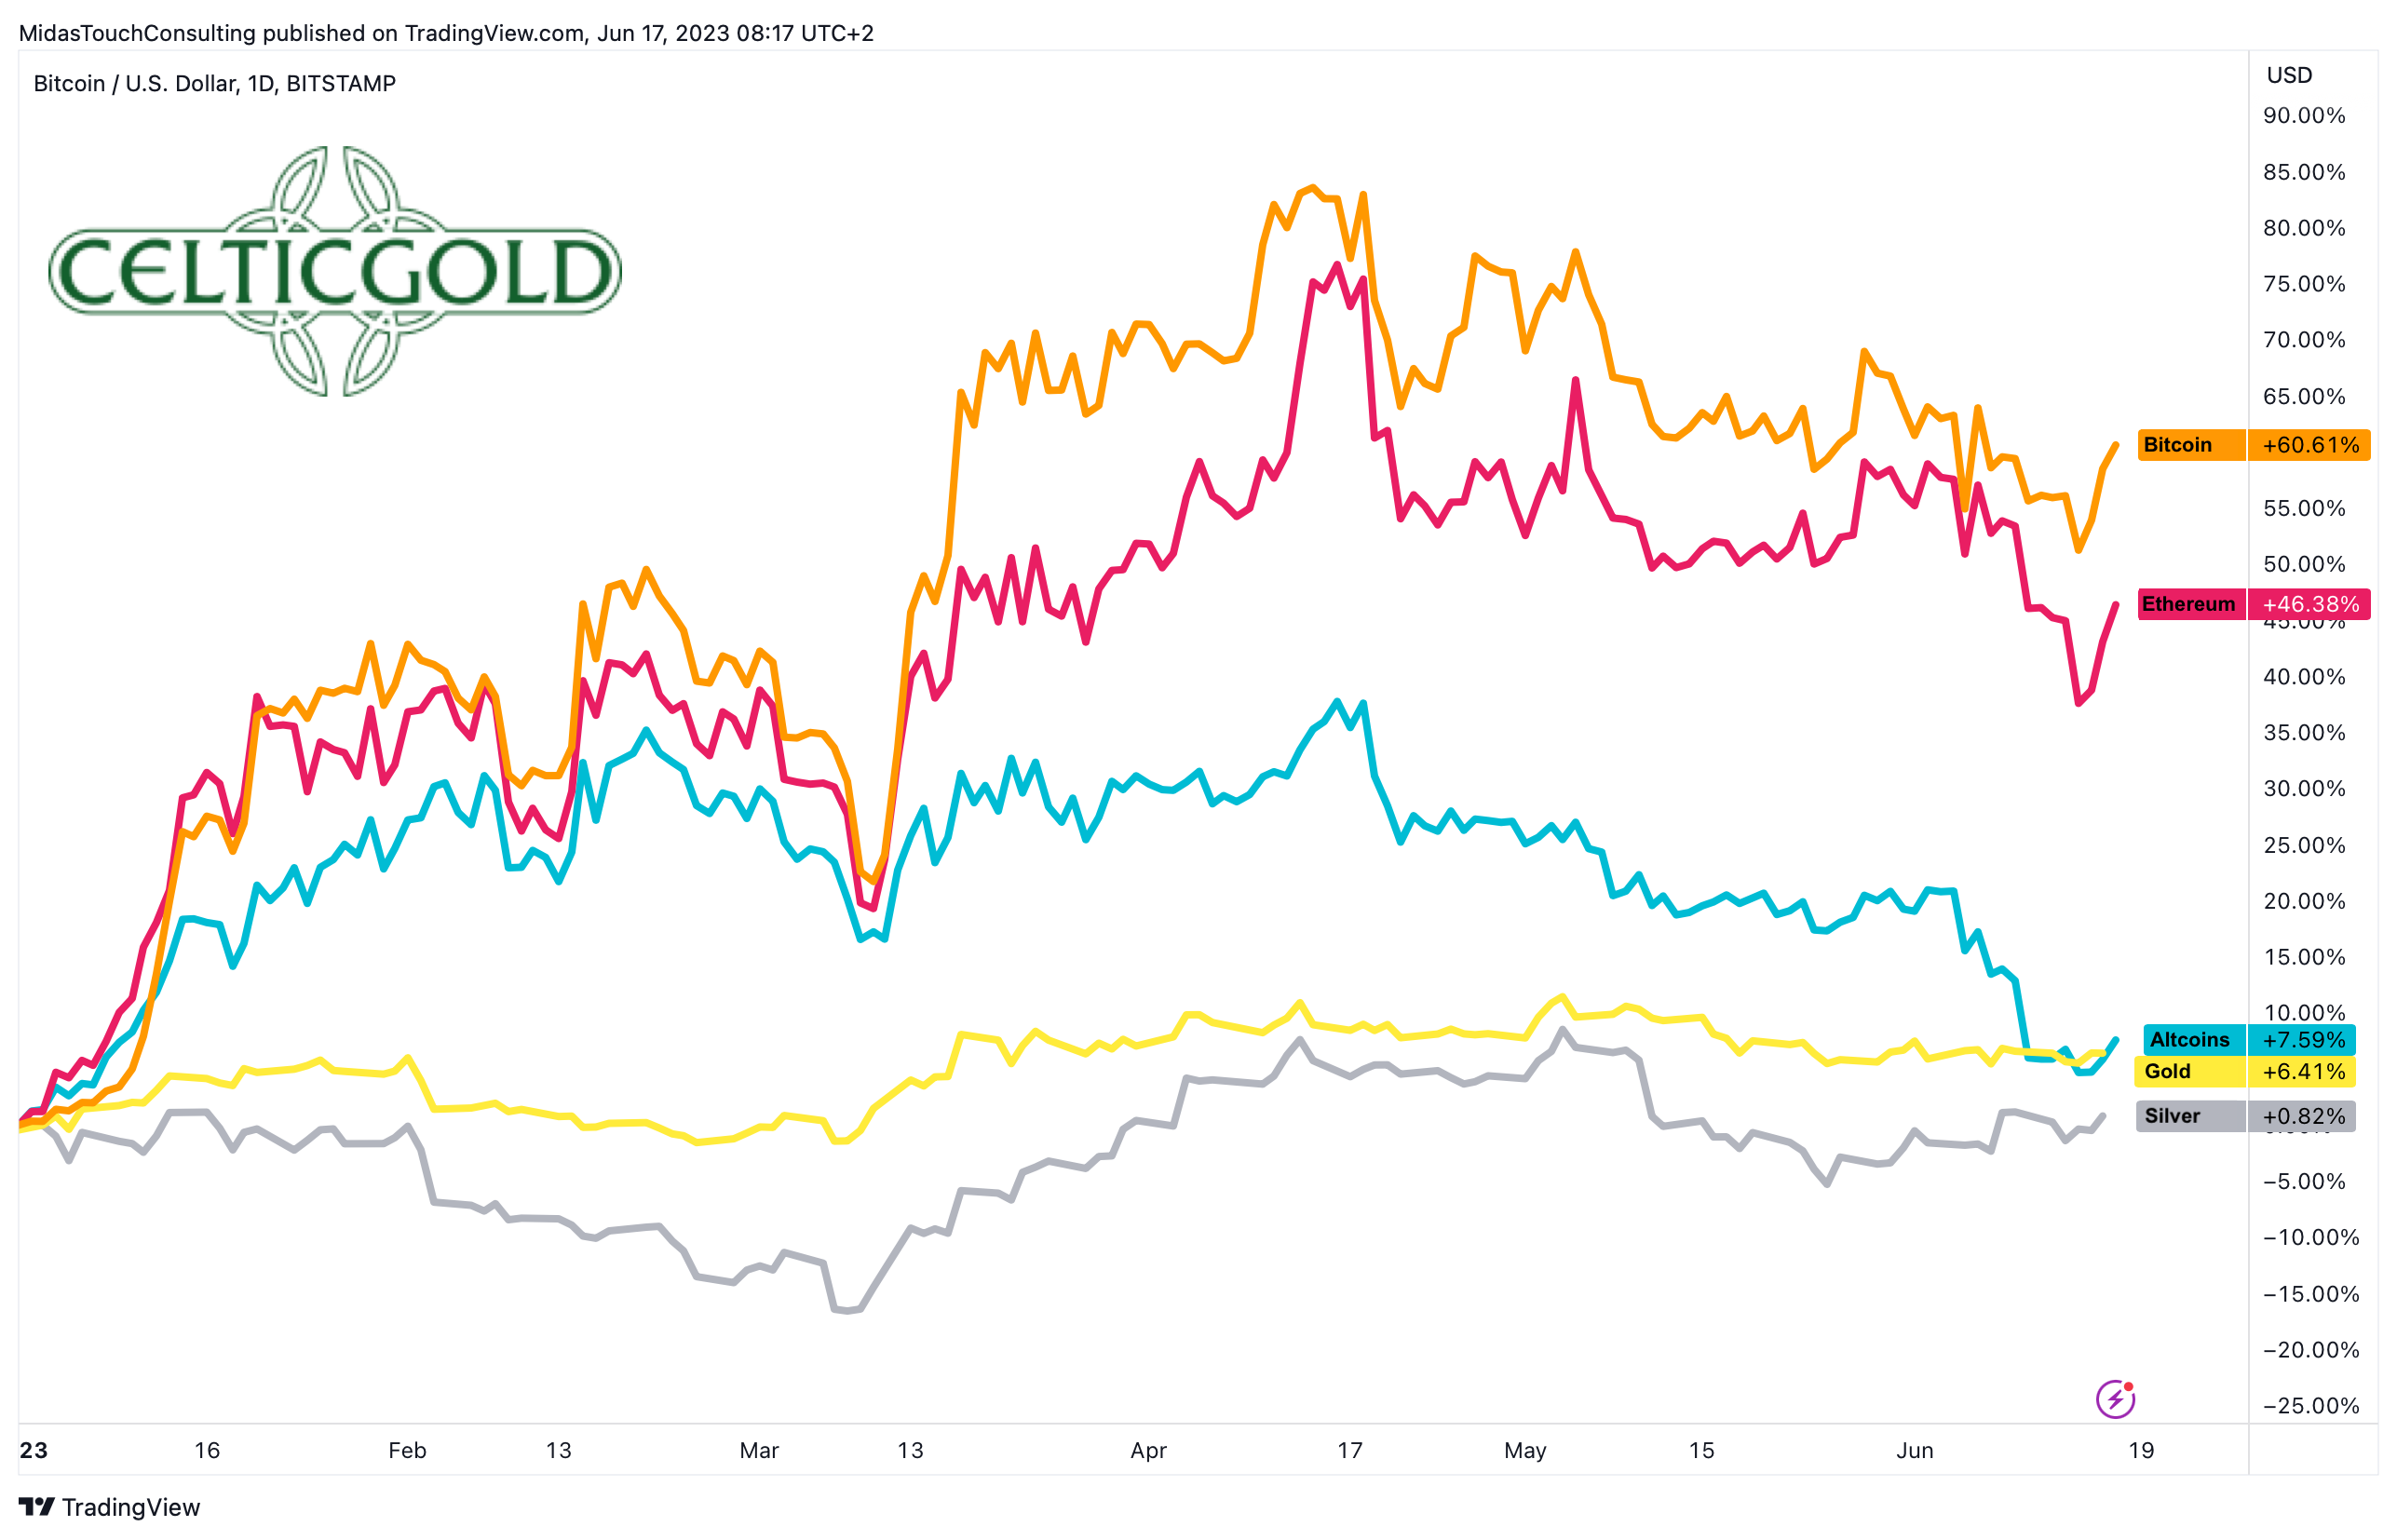 *Bitcoin vs. Ethereum vs. altcoins vs. Gold vs. Silver in USD year-to-date, as of June 17th, 2023. Source: Tradingview* Overall, the price development since the beginning of the year has been clearly positive for both Bitcoin (+60%) and Ethereum (+46%). However, altcoins have given back almost all of their gains (+7.59%) due to the upcoming delisting on the Robin Hood trading platform. Gold has gained 6.4%, while silver has made little progress so far this year, with a gain of only 0.82%. While the SEC, under the leadership of Garry Gensler, has been intensifying its scrutiny of major crypto exchanges such as Coinbase and Binance in recent weeks, the sector has lacked momentum and positive catalysts. Even before the traditional summer lull, the sector was severely impacted by high uncertainty. However, with the Blackrock application for a Bitcoin ETF, the sector could regain momentum, as a Bitcoin spot ETF is expected to bring significant new inflows of capital and purchasing demand. ### Technical Analysis for Bitcoin in US-Dollar #### Bitcoin Weekly Chart – Tenacious and healthy correction so far 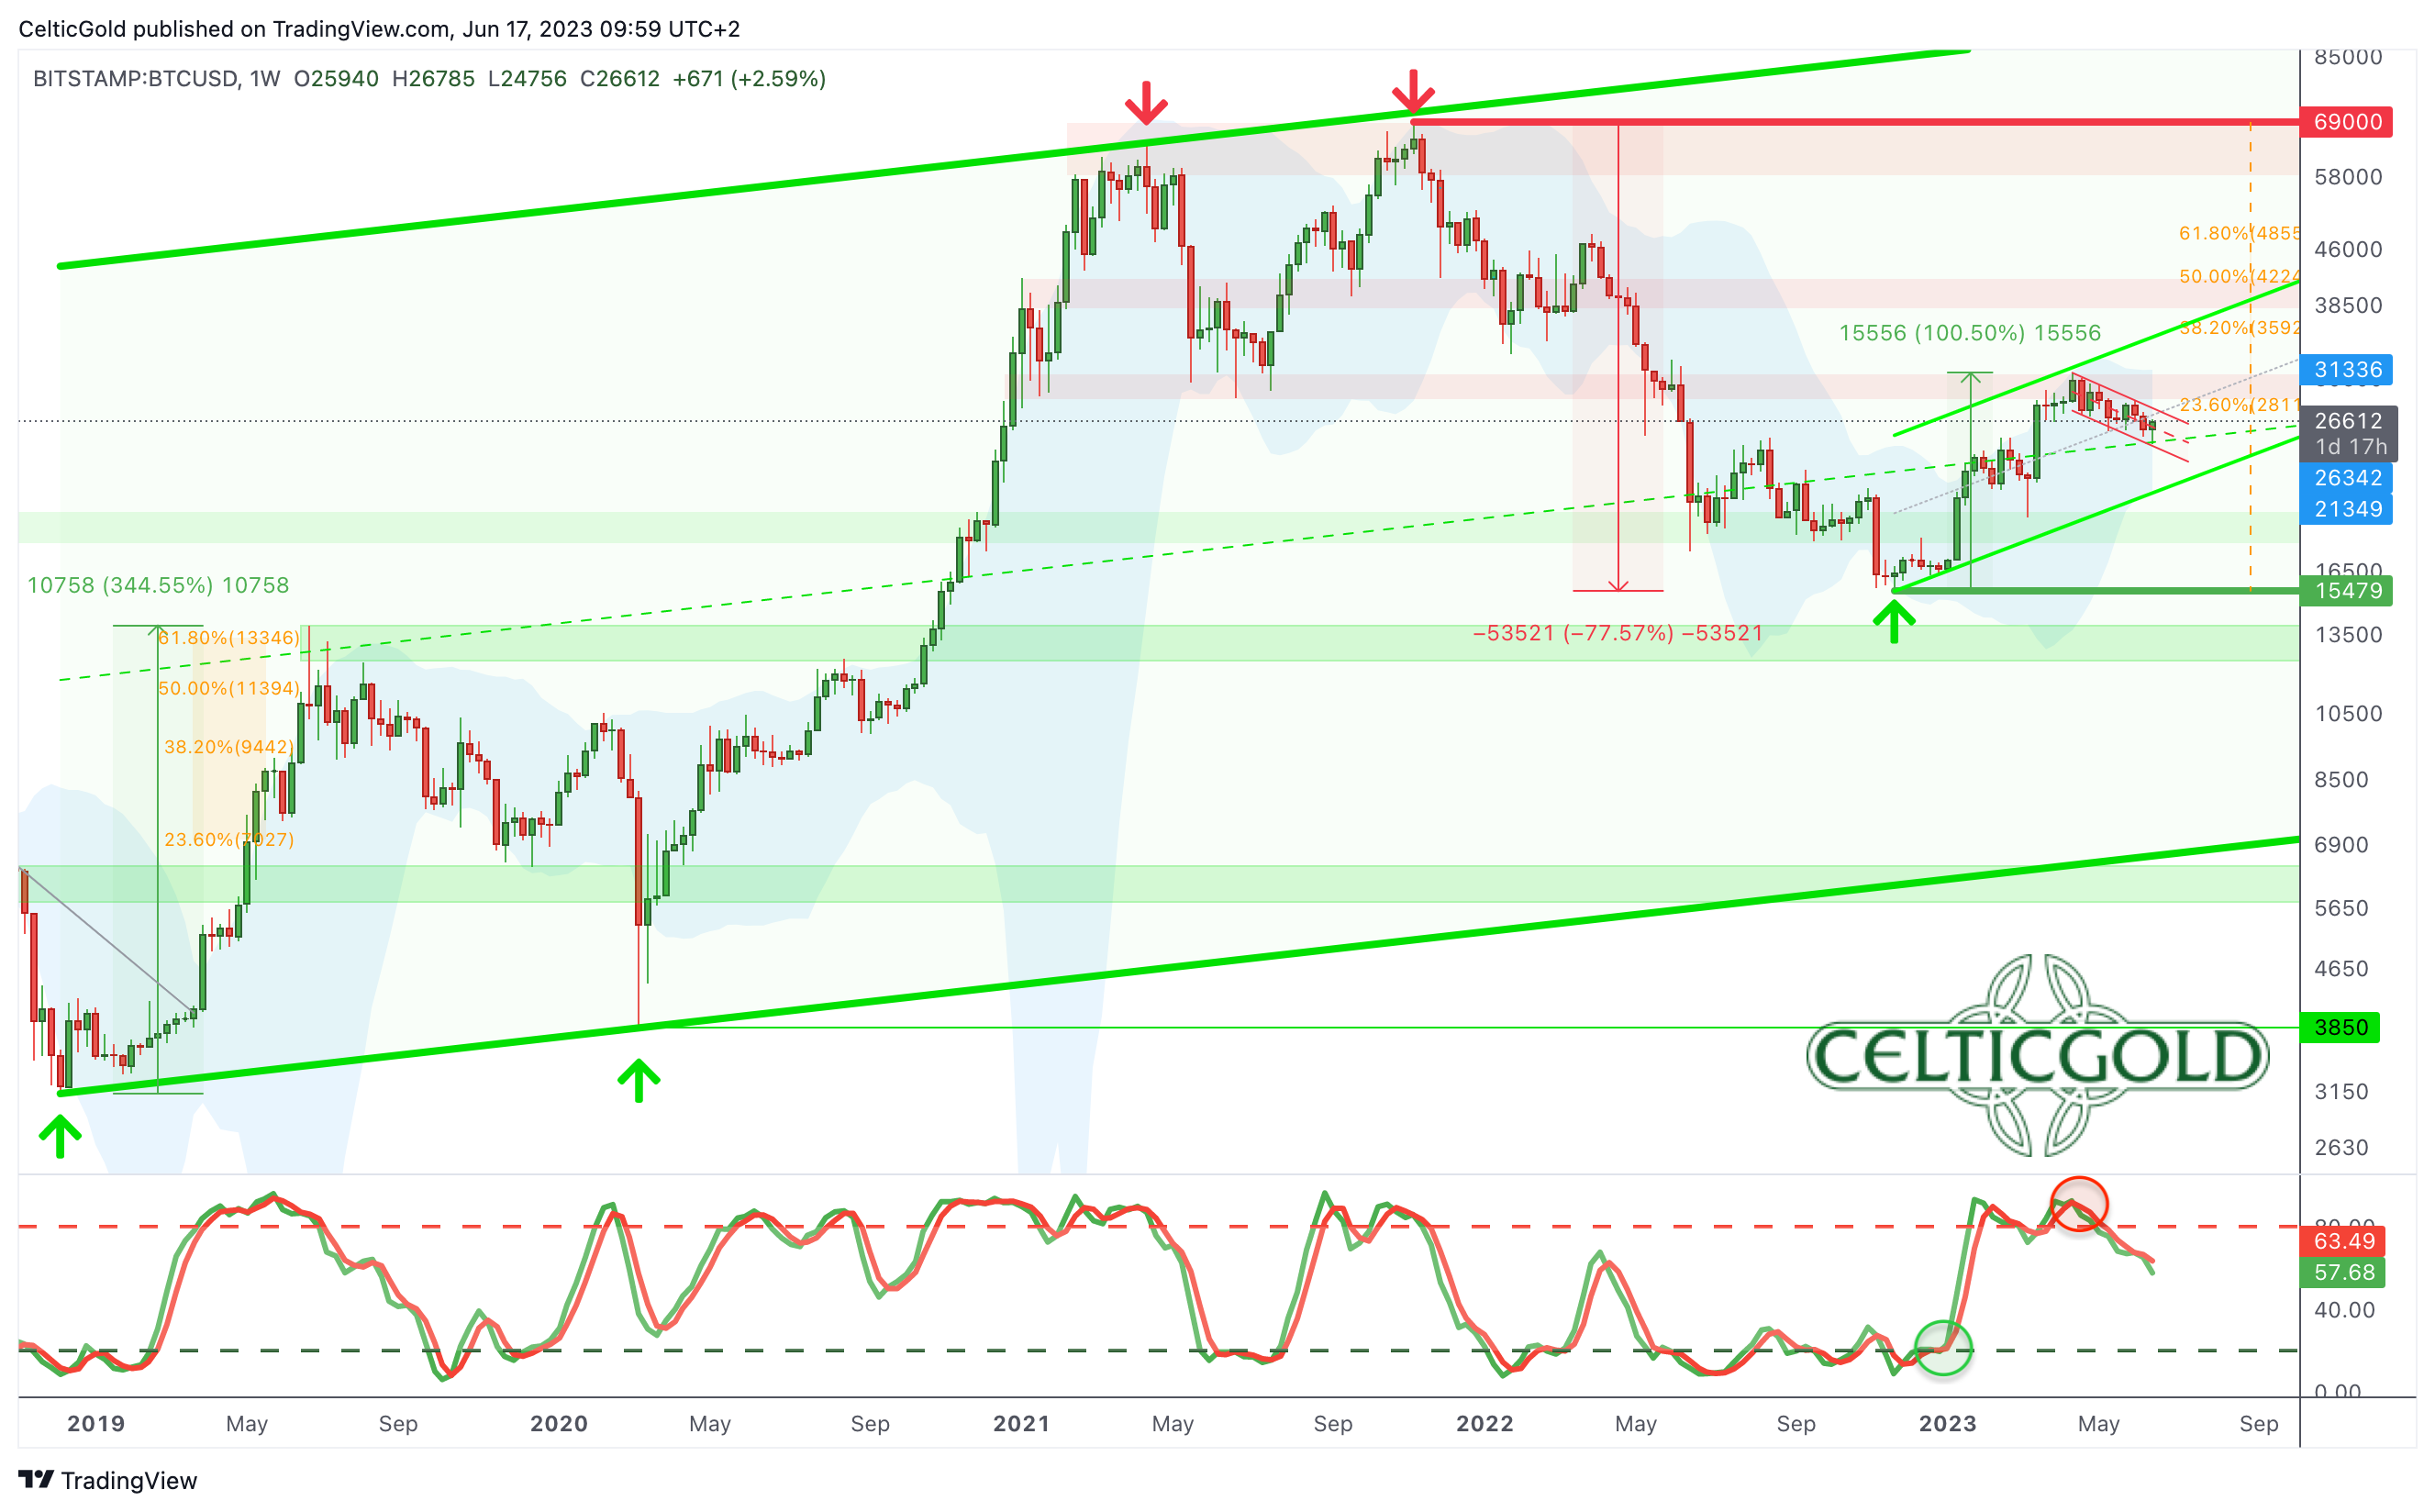 *Bitcoin in USD, weekly chart as of June 17th, 2023. Source: Tradingview.* Starting from its low point on November 21st at USD 15,479, Bitcoin was able to recover quite vigorously until April 14th. However, the bulls ran out of steam at USD 31,000, while crypto speculators indulged unabashedly in the meme coin hysteria surrounding Pepe and others. In hindsight, this was an unmistakable sign of the approaching end of the first wave of recovery and a short-term peak. Although Bitcoin has retraced by 20.2% to USD 24,750 in the meantime, there was a clear lack of panic or a sharp wave. Instead, prices slid slowly and rather leisurely south for the last two months. However, the downtrend remains intact. Yet, the psychological level of USD 25,000, along with the mid-term trendline of the larger overarching uptrend channel, at least temporarily halted the bears’ progress. However, a look at the weekly stochastic indicator still shows an established sell signal, and the oscillator still has plenty of room to move further down towards its oversold zone. Thus, the next strong support on the weekly chart is likely to be found only at the lower Bollinger Band (USD 21,352) and the lower edge of the uptrend channel (currently around USD 21,460 USD) of the past eight months. In summary, the weekly chart is bearish, and a medium-term decline towards approximately USD 21,750 and USD 22,250 still needs to be anticipated. #### Bitcoin Daily Chart – Reversal above the rising 200-day moving average 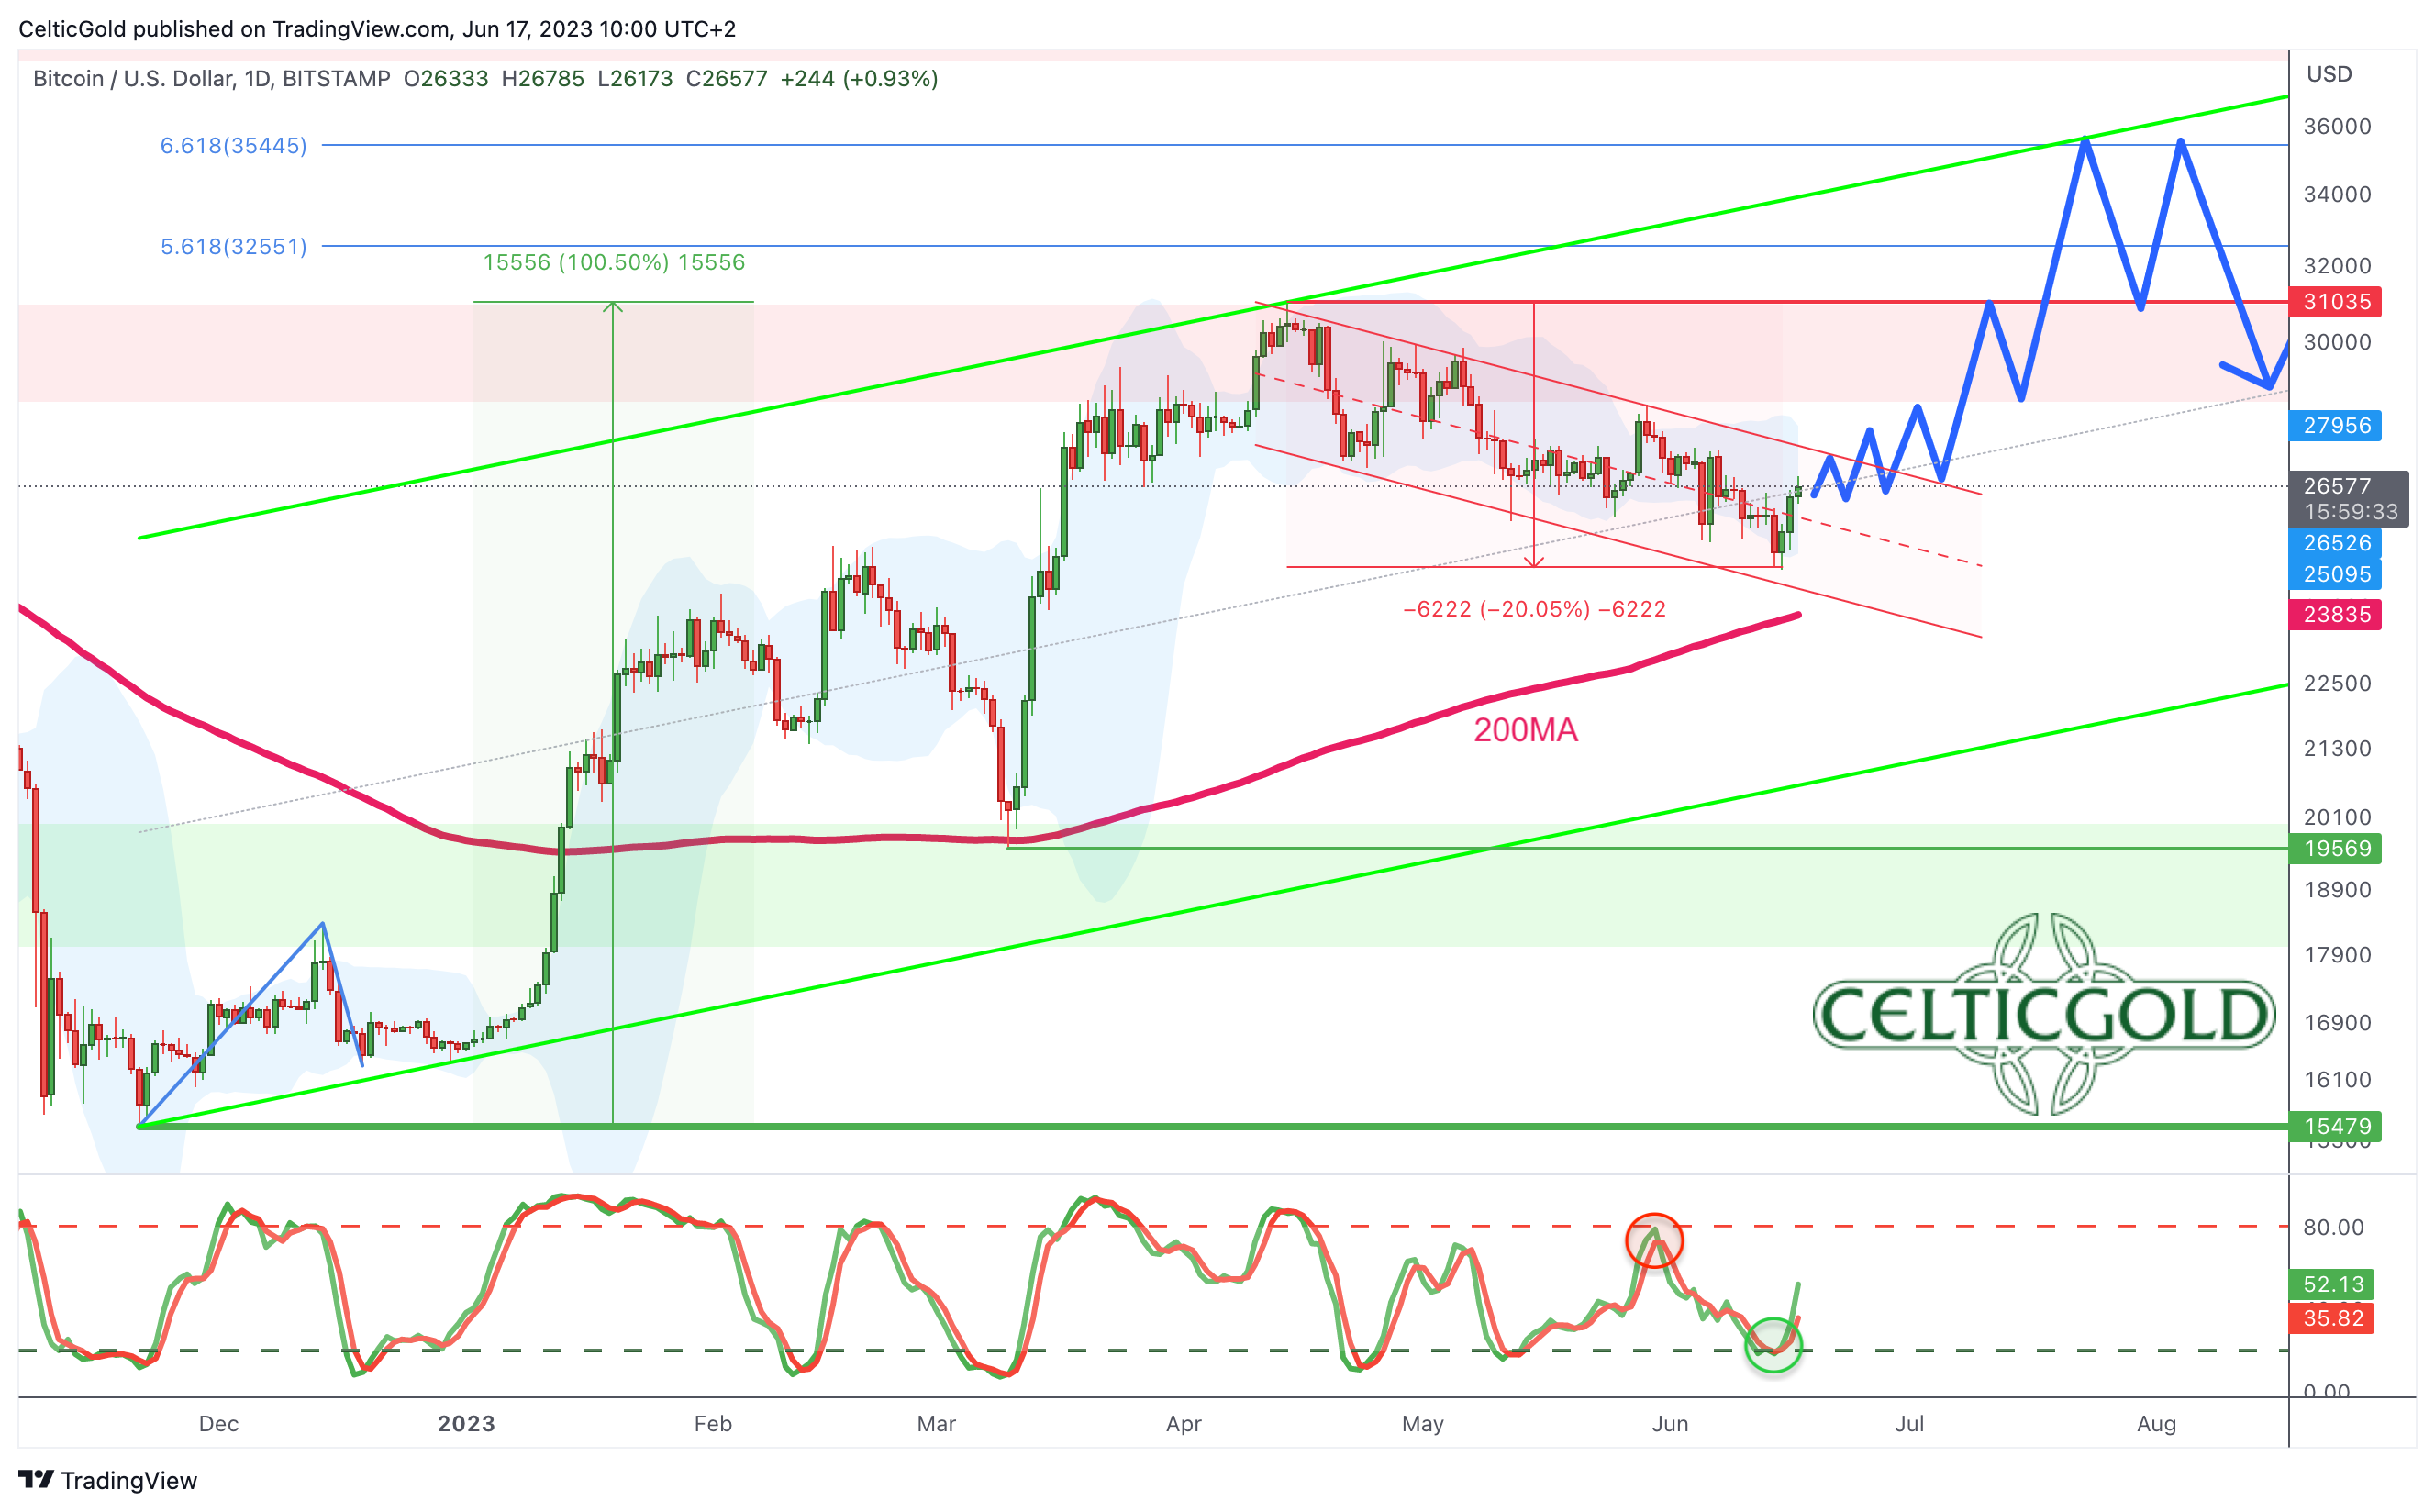 *Bitcoin in USD, daily chart as of June 17th, 2023. Source: Tradingview* On the daily chart, a downtrend channel has formed over the last two months, which would currently allow the bears some room on the downside until approximately USD 24,200. At the same time, the 200-day moving average (USD 23,835) swiftly caught up with the current price action from below. A reunion with this widely watched moving average seemed highly likely. However, Bitcoin has already turned up before reaching it, and the daily stochastic indicator is showing a new buy signal. Immediate and significant price declines are therefore not likely in the near term, and the encounter with the 200-day moving average may have been postponed indefinitely. Overall, the daily chart has switched to a bullish stance. The down-wave appears to have found its low point at USD 24,750. The ongoing recovery should provide us with more insight into the state of Bitcoin shortly. If a clear trend reversal and a breakout from the downtrend channel will occur with prices above USD 27,500, the path to the upside would be clear. Another attempt to break through the resistance zone between USD 29,000 and USD 31,000 could be possible in mid-summer already. However, if the ongoing bounce remains weak, the arguments for a continuation of the correction towards USD 22,500 and lower would strengthen. ### Sentiment Bitcoin – New fantasy despite summer lull and uncertainties 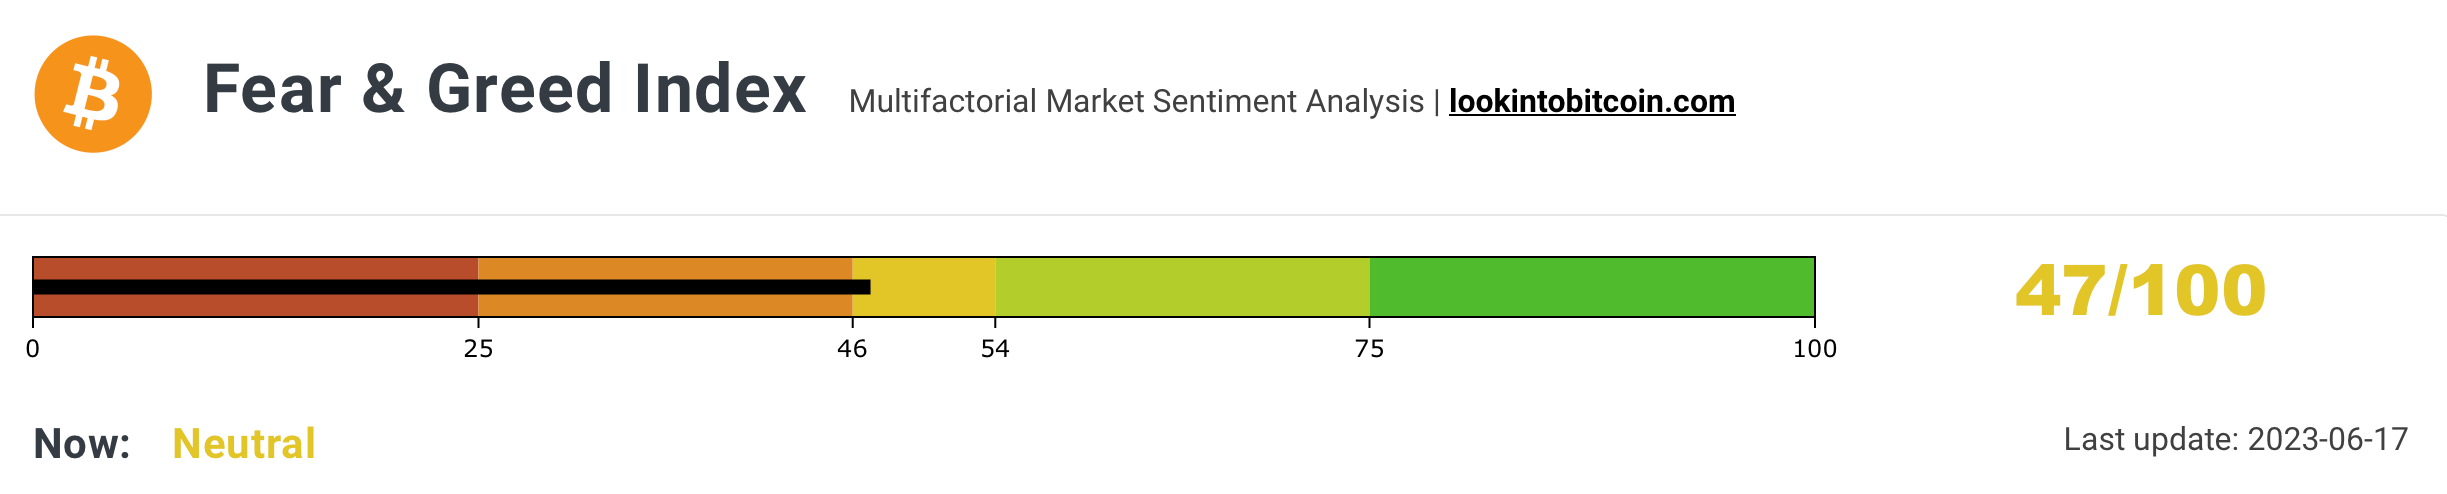 *Crypto Fear & Greed Index, as of June 17th, 2023. Source: Lookintobitcoin* Sentiment in the crypto sector has cooled down in line with the declining prices in recent weeks. According to the “Crypto Fear & Greed Index,” the sentiment is neutral with a value of 47. 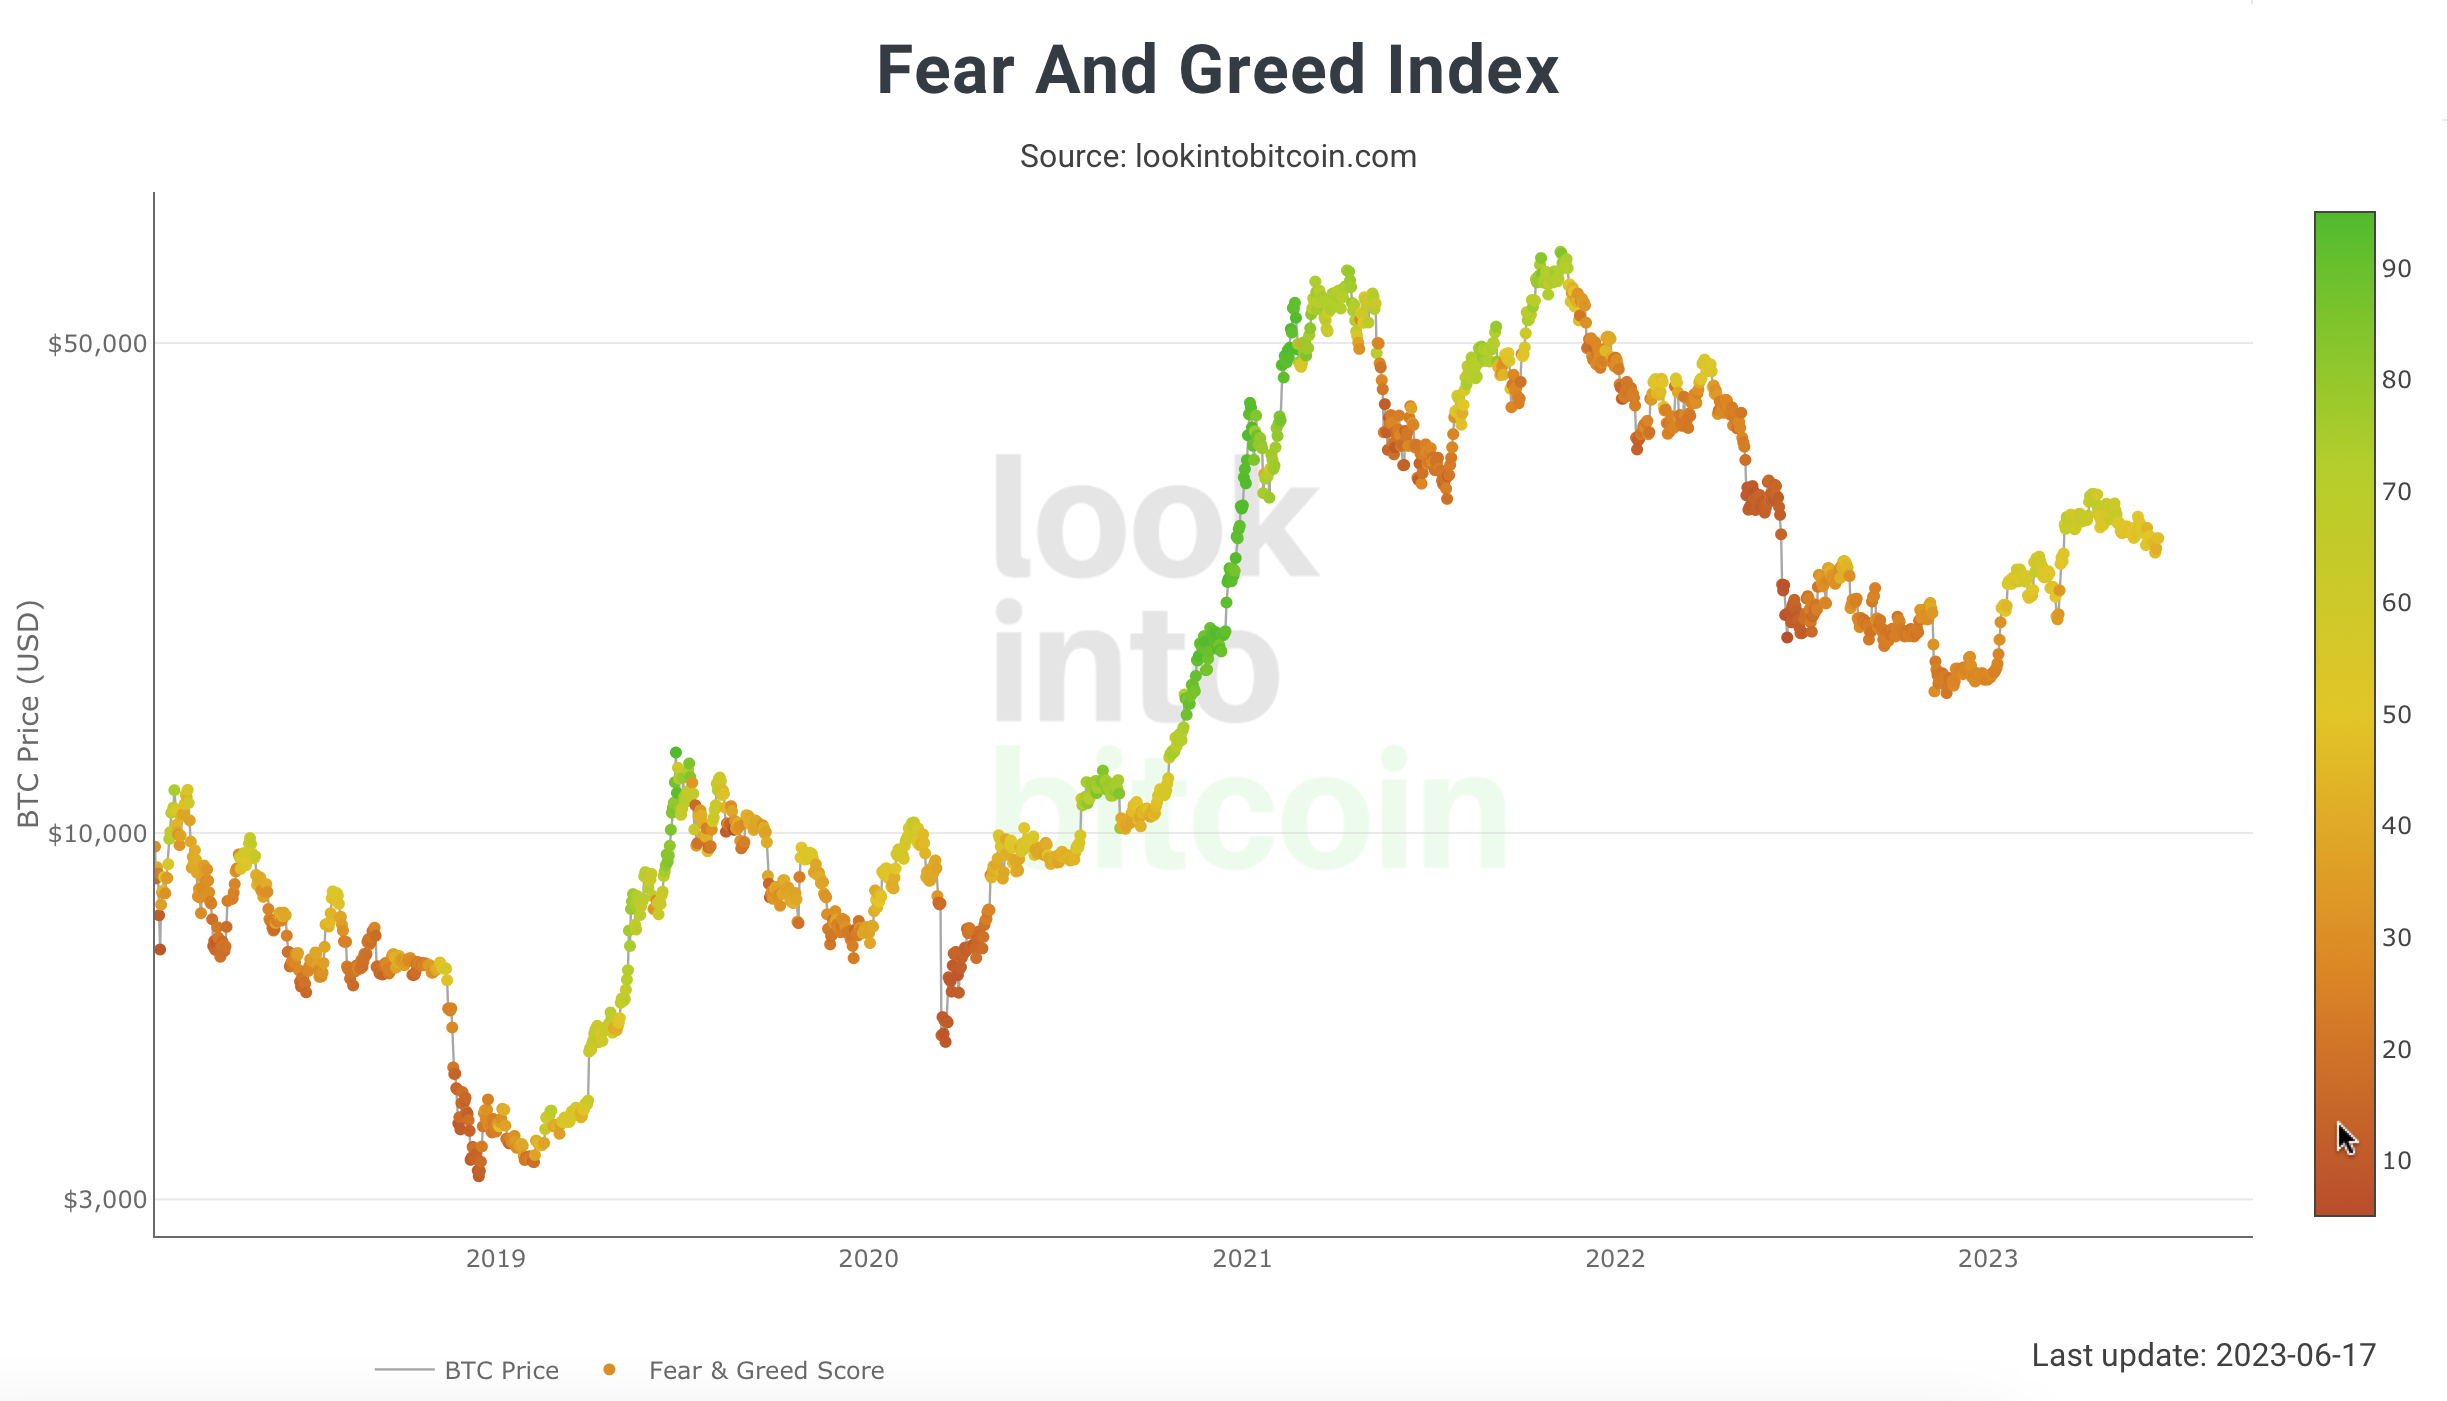 *Crypto Fear & Greed Index long term, as of June 17th, 2023. Source: Lookintobitcoin* In the larger picture, the recovery wave in April already failed to reach extreme sentiment levels. Therefore, sentiment-wise, Bitcoin remains in a state of uncertainty. From this perspective, the end of the bear market cannot be declared yet, as the recovery movement between January and April was still relatively weak. At the same time, the current sentiment does not impede a continuation of the recovery. Overall, Bitcoin is far from euphoria and excessive optimism. However, there is no contrarian buying opportunity due to high levels of fear and panic either. ### Seasonality Bitcoin – Is the early summer rally starting now? 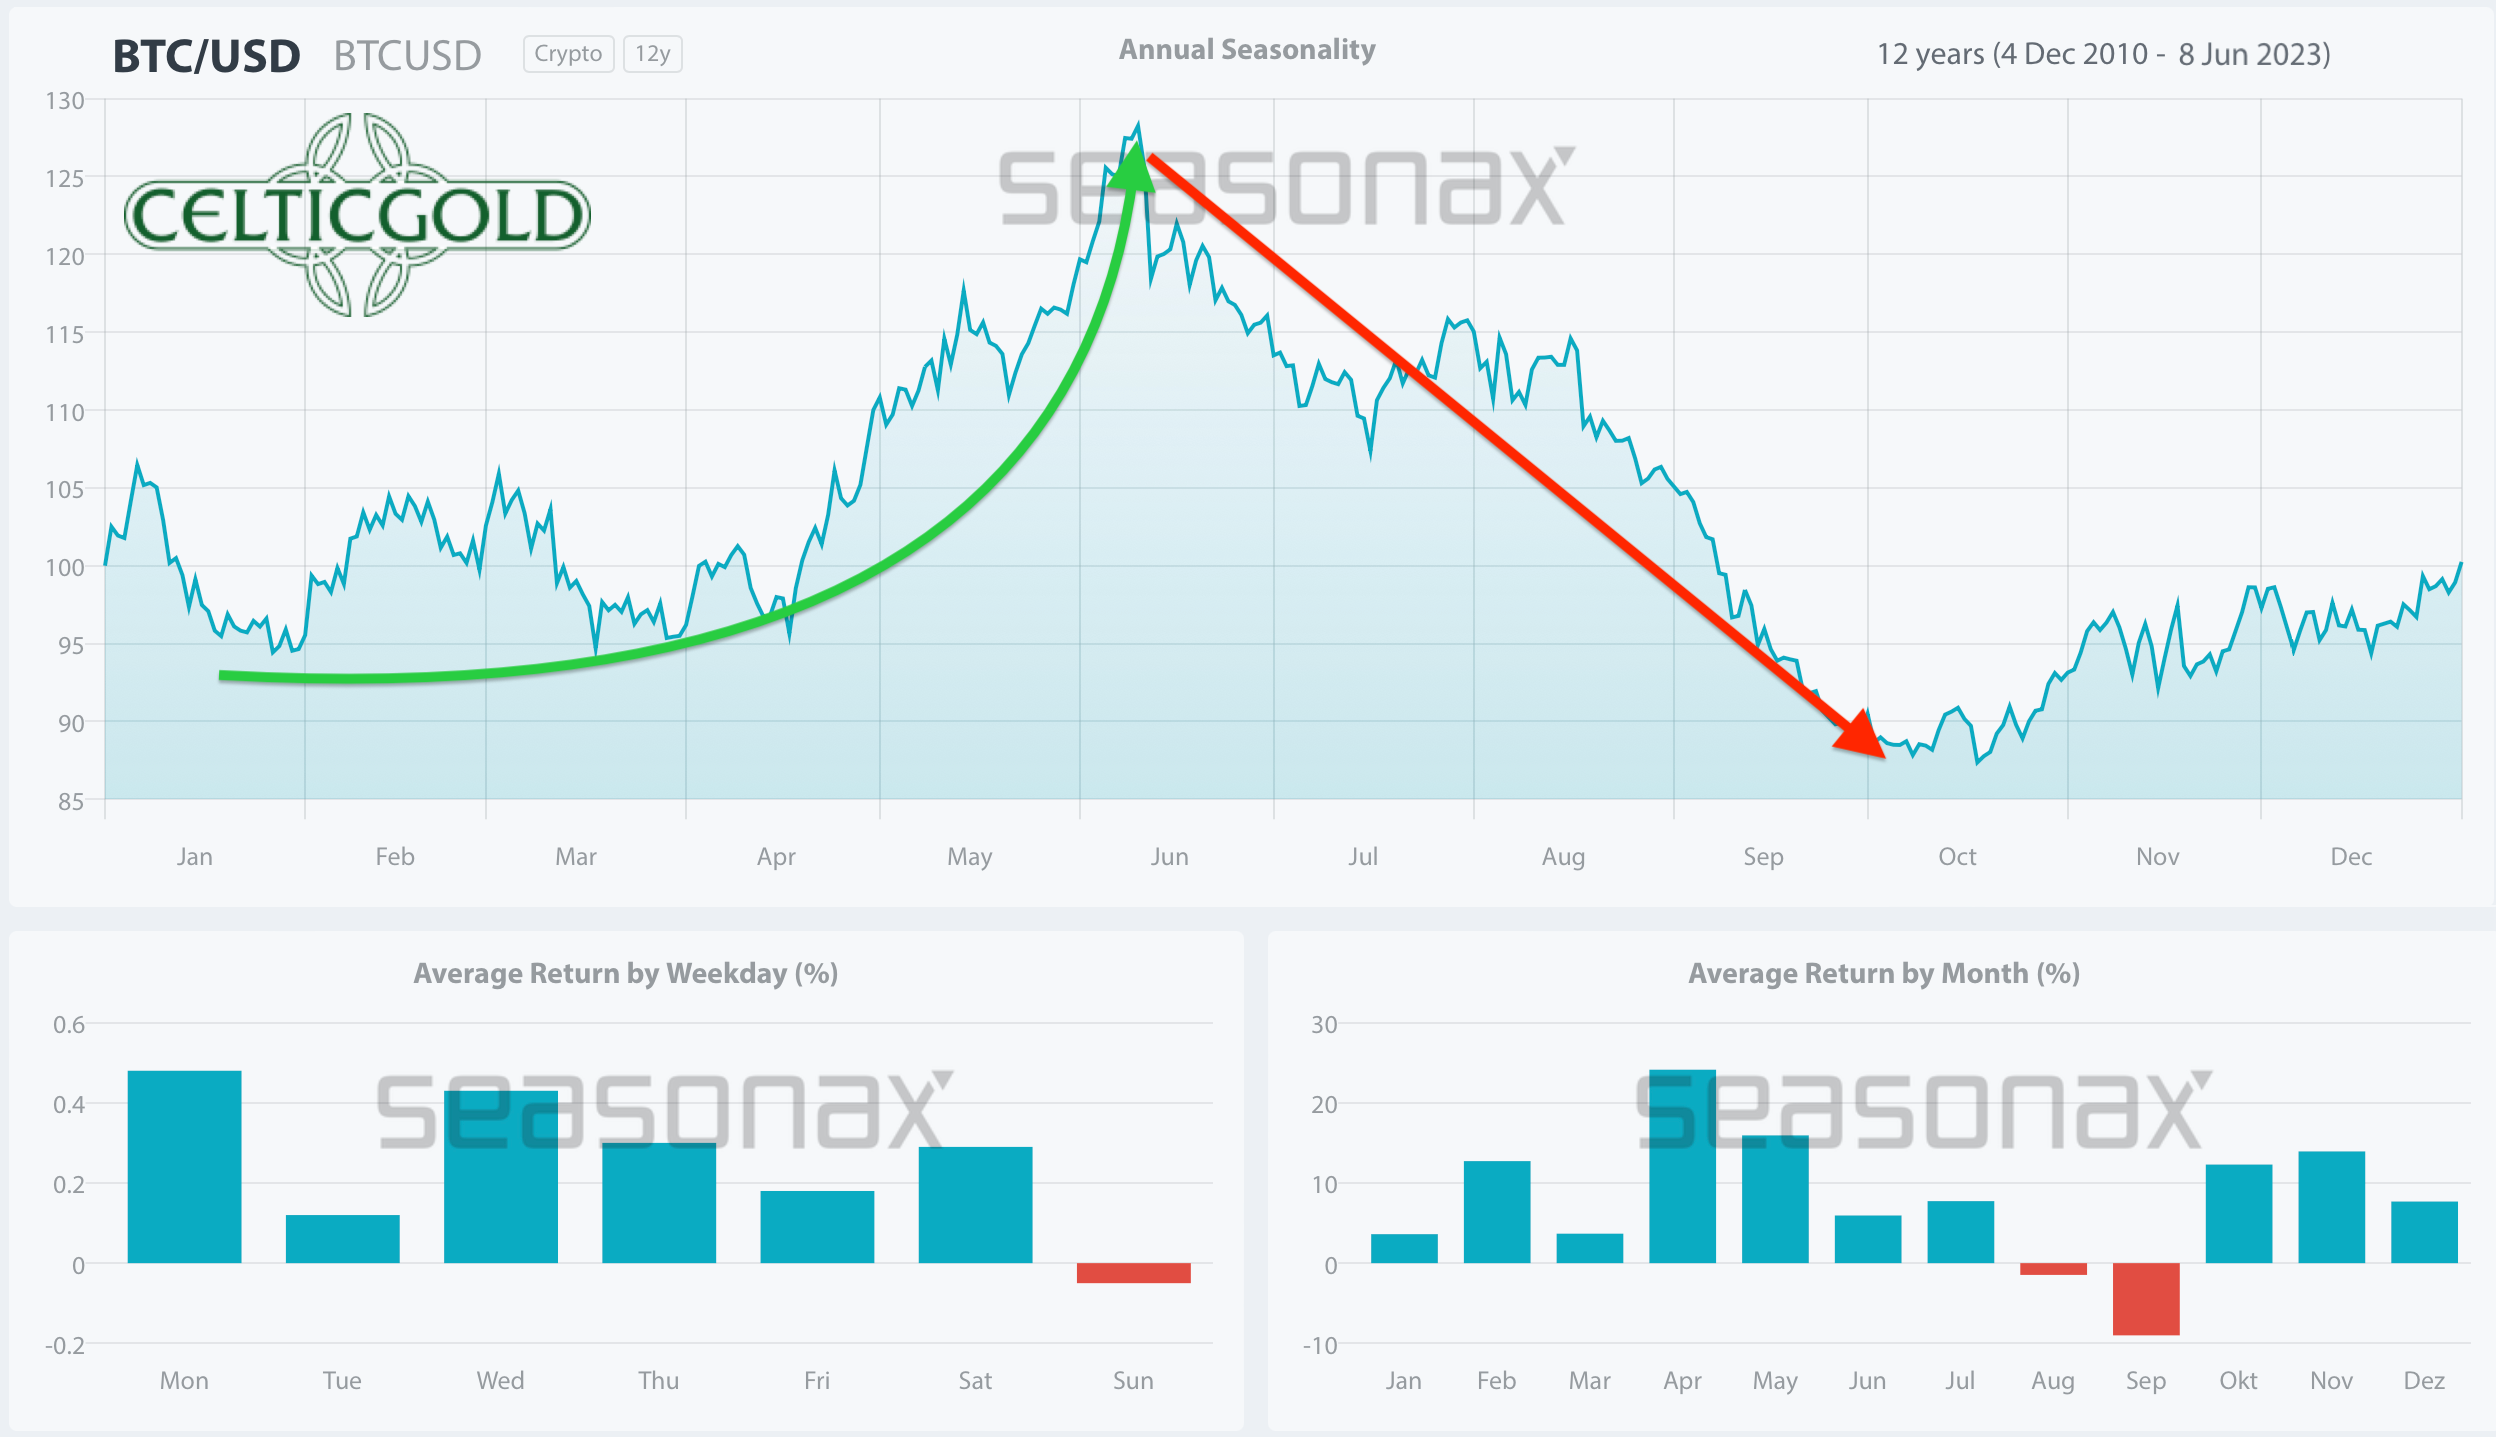 *Seasonality for Bitcoin, as of June 8th, 2023. Source: Seasonax* The seasonal pattern has only partially played out this year, as Bitcoin reached its high point in April already and has been falling since then. Perhaps Mr. Gensler disrupted the typical rally in May and June. However, the recovery of the past two days may have now provided the delayed start signal for the strength phase in early summer. In that case, the next two months should deliver a strong rally in the sector. Alternatively, if we stick to the early peak in April, according to the seasonal statistics, an average correction of approximately four months should follow. In this scenario, Bitcoin may potentially reach an important low point not before early August. Overall, the current situation actually contradicts the seasonal pattern, which would be unfavorable from now until autumn. However, it’s possible that this year, the typical rally between mid-April and mid-June simply occurs two months later. ### Sound Money: Bitcoin vs. Gold 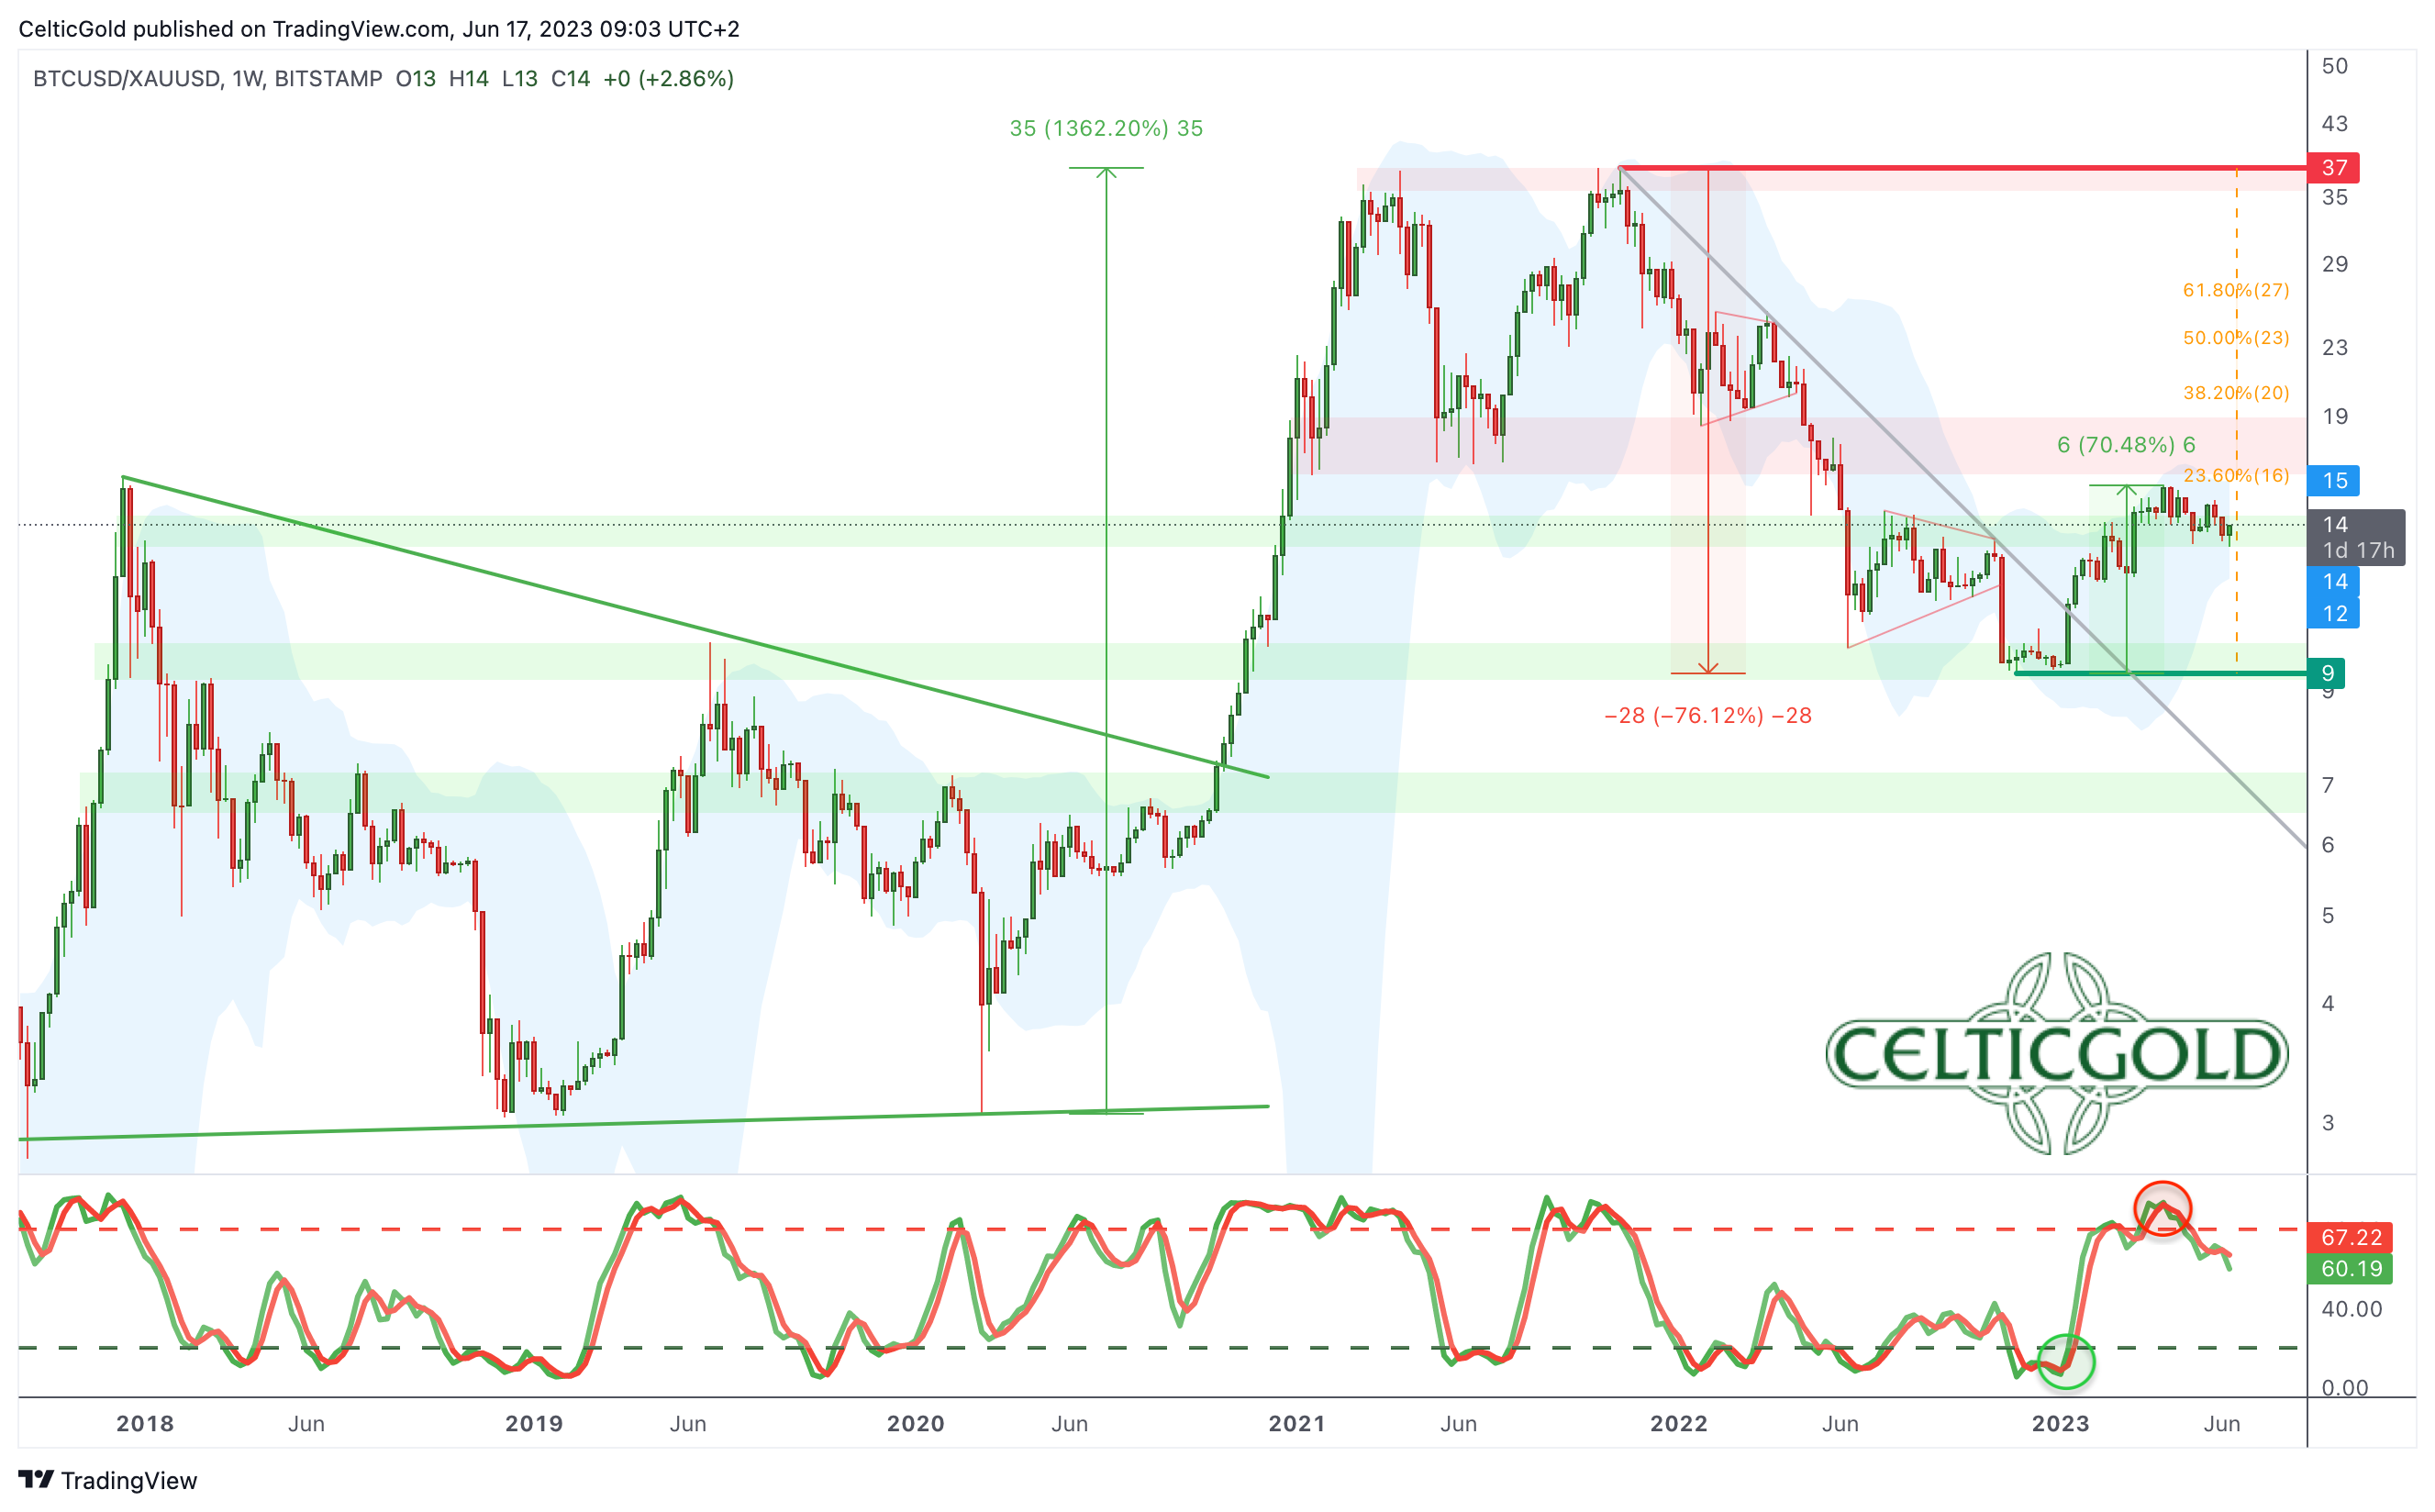 *Bitcoin/Gold-Ratio, weekly chart as of June 17th, 2023. Source: Tradingview* In spring, Bitcoin reached its peak more than three weeks before gold. During the recovery, the Bitcoin/Gold-ratio initially climbed to 15.25. With Bitcoin trading at around USD 26,650 and gold at USD 1,957, currently, one Bitcoin costs approximately 13.62 ounces of gold. Vice versa, one ounce of gold currently costs about 0.073 Bitcoin. Overall, since the beginning of the year, Bitcoin has clearly been the faster horse, outperforming gold by a factor of 10! During the correction, the ratio recently dropped back to 12.8. However, since Thursday, Bitcoin has been turning upwards again, and the recovery since the beginning of the year may continue. Additionally, the lower Bollinger Band on the weekly chart opposes significantly lower ratio values (below 12). Therefore, for those who wish to adjust their “safe haven” allocation in favor of Bitcoin, now, or at ratio values around 12, would likely be a suitable time to do so. In summary, the Bitcoin/Gold ratio has corrected as expected. Although the weekly stochastic indicator is far from being oversold, we anticipate a recovery over the next two months, with ratio values around 15. ### Macro Update – Deceptive calmness After numerous bank collapses in March, which even led to a bank run in the U.S., the situation has significantly calmed down in recent weeks. 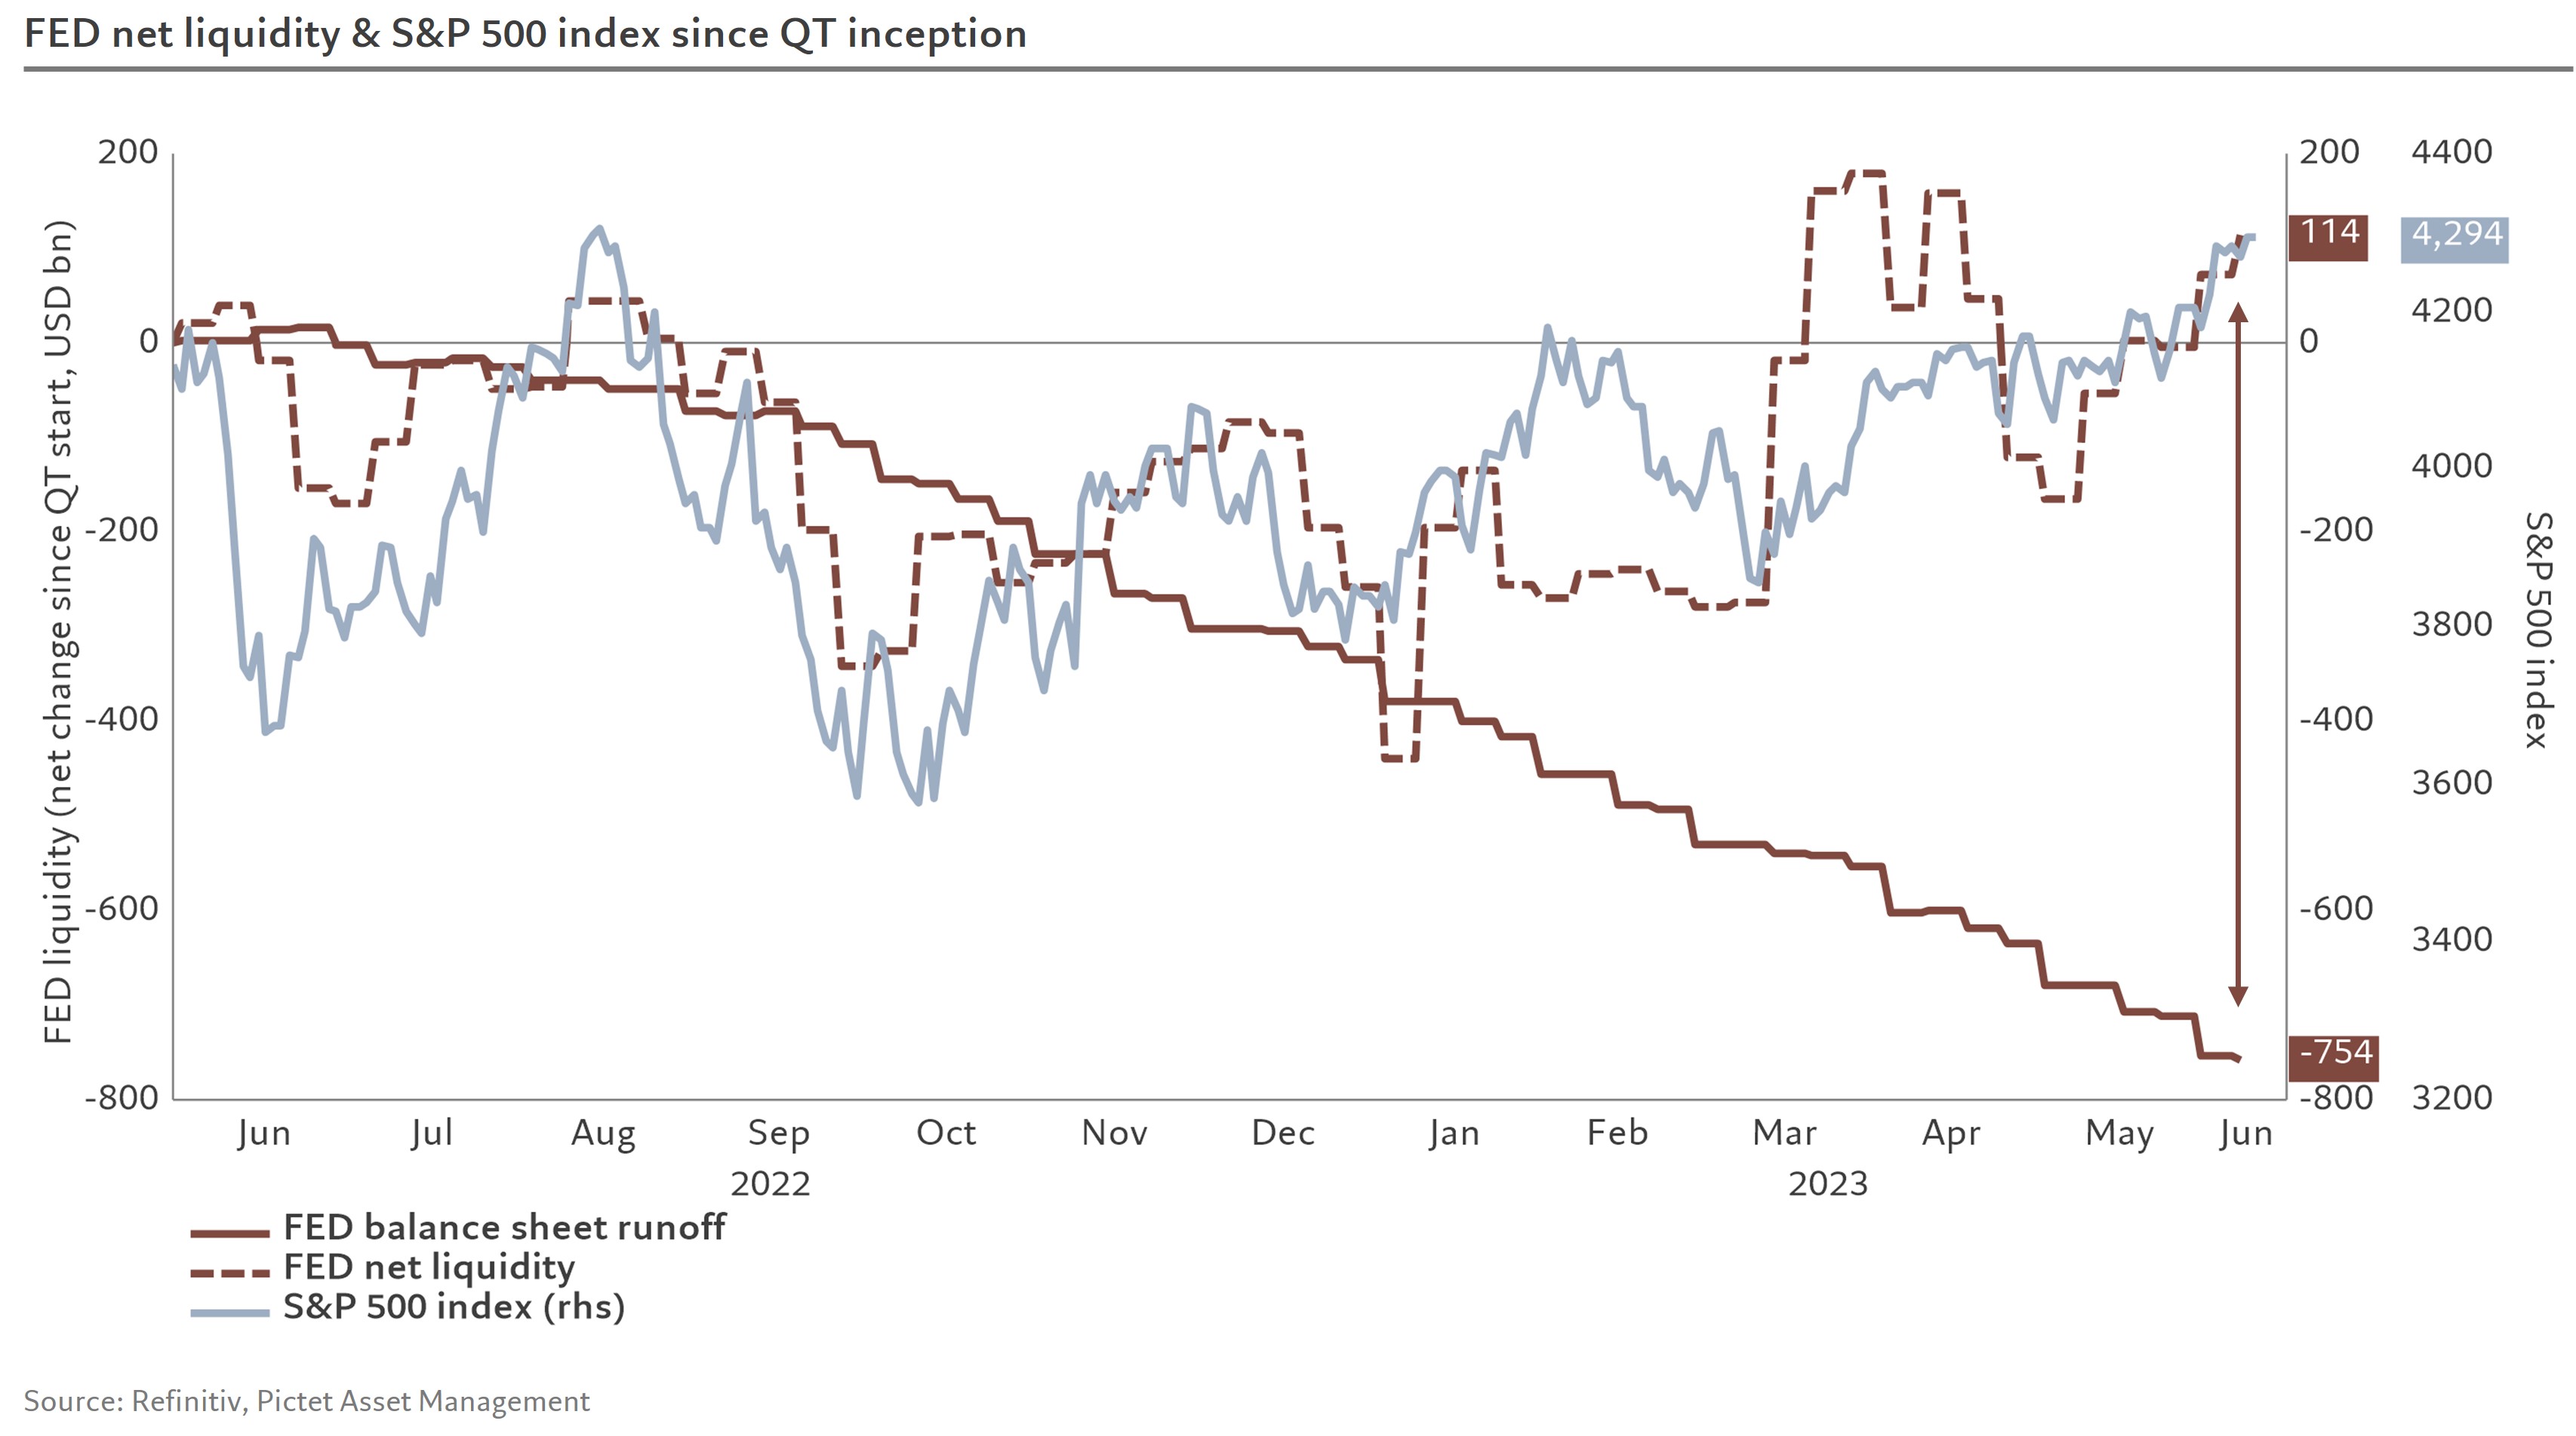 *FED balance sheet vs. net liquidity vs. S&P 500, as of June 9th, 2023. Source: Pictet Asset Management* The reason for this deceptive calmness can be attributed to massive liquidity injections (Bank Term Funding Program) by the American central bank. Instead of implementing the planned “Quantitative Tightening” of USD 750 billion, there is now, in essence, a form of “Quantitative Easing Light” of approximately USD 100 billion! The increase in net liquidity is a result of US banks being able to borrow from the Federal Reserve (FED) at a credit cost of 5% interest per year to cover their significantly decreased bonds at USD 1.00 instead of their real value of USD 0.50. While this credit incurs interest, it has temporarily pushed the problem into the future and avoided a liquidity crisis. This is why the stock markets are rising, as the S&P500 is up more than 27.5% since last November. No doubt, the crack-up boom is underway! 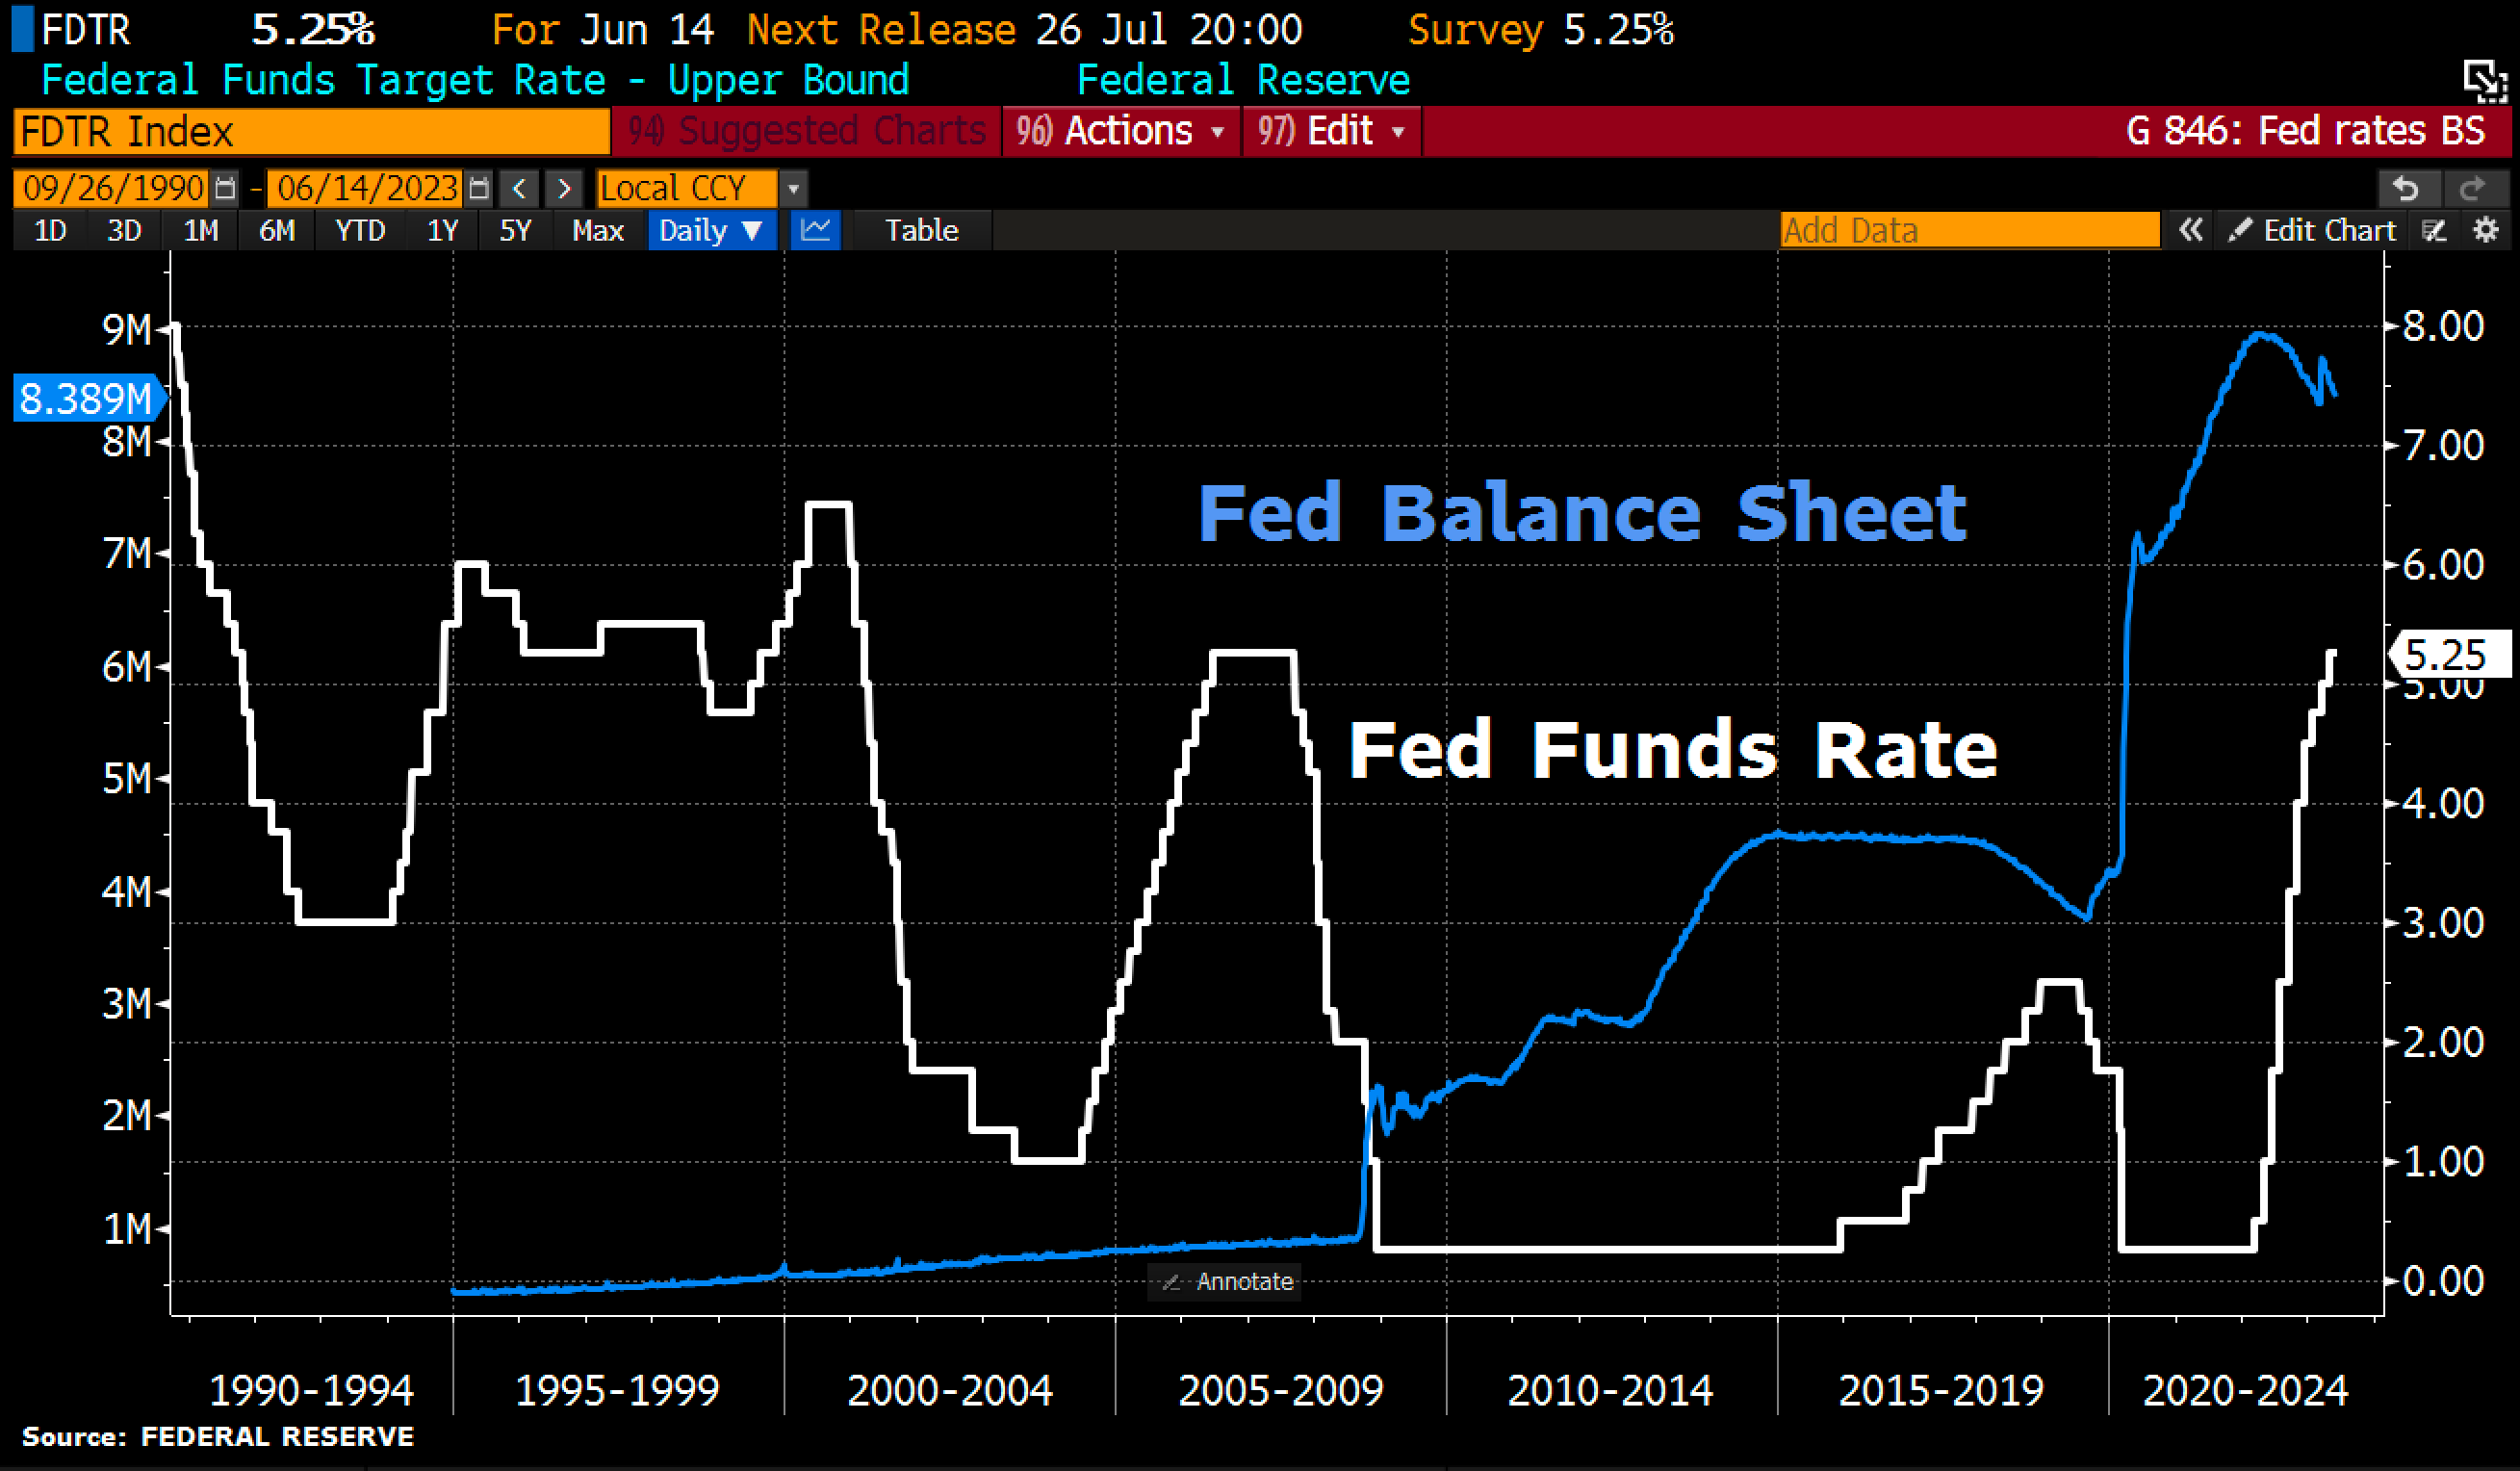 *US FED balance sheet vs. FED funds rate, as of June 14th, 2023. Source: Holger Zschaepitz* Last Wednesday evening, the FED decided not to further increase interest rates after more than a year of aggressive hikes. However, Federal Reserve Chairman Powell indicated that the pause may only be temporary, as the Fed implies two more 25 basis points rate hikes later this year. With its rigorous tightening cycle, the FED has already shattered the porcelain. The hastily concocted rescue programs since March have only masked the problems, while a massive smoldering fire continues to burn behind the scenes of the financial system. #### Hiking cycle brought the end of easy money 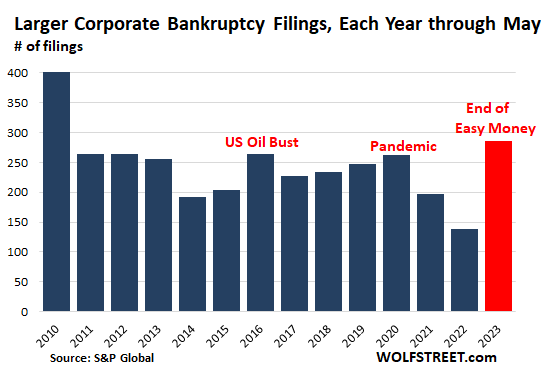 *Bankruptcy filings in the US, as of June 7, 2023. Source: S&P Global* For those who make the effort to seek facts beyond the mainstream, they will discover, for example, that the number of bankruptcy filings in the US this year has reached the highest level since 2010. The underlying reason is that the increased interest rates have made debt much more expensive. Additionally, the investors who are supposed to buy these debts have become more cautious because the easy money, once abundant due to the low interest rates, is no longer readily available. However, once companies become reliant on easy money to sustain themselves due to high debt levels, it becomes challenging to break free from this dependency. In a way, the economy is normalizing with interest rates typical of the pre-QE era. But companies that could survive only because of easy money are now feeling the pressure. #### Commercial real estate is the next shoe to drop Furthermore, the next storm is brewing, particularly in the US commercial real estate sector. Currently, numerous US banks are hurrying to reduce their exposure to this sector due to an imminent wave of payment defaults. PacWest recently sold a construction loan portfolio worth USD 2.6 billion at a significant loss, while HSBC is seeking to sell hundreds of millions of dollars in commercial real estate loans as quickly as possible. Many regional lenders, in particular, may have to consider selling commercial real estate loans at a substantial discount. As the sales gain momentum, the downward spiral accelerates, further depressing property prices. It is likely that nearly half of the 4,800 American banks have already depleted their capital buffers and are potentially insolvent. Meanwhile, vacancy rates in offices and retail stores in San Francisco for example continue to soar, while safety concerns and drug abuse deter tourists and visitors. The city could become one of the epicenters of the next apocalypse. Recently, Unibail-Rodamco-Westfield and Brookfield Corp. had to transfer ownership of the city’s largest shopping center to the lender after they were no longer able to make payments on the USD 558 million loan. Park Hotels & Resorts Inc. has also halted loan payments for two downtown hotels with outstanding debts totaling USD 725 million. #### A wave of payment defaults and bankruptcies is looming The boom-and-bust cycle will continue, as the tightest policies from the FED and the European Central Bank (ECB) in 15 years collide with high levels of debt and adventurous derivative structures. The foreseeable wave of payment defaults in the US and Europe will also hit the real economy hard, with default rates possibly not peaking before the fourth quarter of 2024 or even later. In the past, the FED halted its aggressive interest rate hike cycle back in June 2006. However, the major financial crisis only began a year and a half later! Therefore, the financial markets are facing challenging times ahead. While the buzzword “AI” is currently celebrated in the stock markets, the low volatility is likely just the calm before the next storm. While precious metals may provide protection right at the beginning of the crisis this time, Bitcoin will face difficulties during stock market turbulence and may only experience sustained growth during subsequent rescue programs. ### Conclusion: Bitcoin – New fantasy despite summer lull and uncertainties After sliding south for two months, Bitcoin has started a recovery in the past two days. Soon, it should become evident from a technical analysis perspective whether the “Bitcoin ETF fantasy” is enough to push the prices back above USD 27,500. If successful, a rise to around USD 30,000 and even USD 35,000 USD could be possible by mid-summer. Alternatively, due to the lingering regulatory uncertainties, the sector may fall back into its recent premature summer lethargy. _Analysis sponsored and initially published on June 17th, 2023, by [www.celticgold.eu](https://celticgold.de/blog/gold-und-bitcoin-analysen-von-florian-grummes-32/bitcoin-neue-fantasie-trotz-sommerflaute-und-unsicherheiten-216). Translated into English and partially updated on June 17th, 2023._ _Feel free to join us in our free [Telegram channel](https://t.me/MidasTouchConsulting) for daily real time data and a great community._ _If you like to get regular updates on our gold model, precious metals, commodities, and cryptocurrencies you can subscribe to our [free newsletter](http://bit.ly/1EUdt2K)._ _Disclosure: This article and the content are for informational purposes only and do not contain investment advice or recommendations. Every investment and trading move involves risk, and readers should conduct their own research when making a decision. The views, thoughts and opinions expressed here are the author’s alone. They do not necessarily reflect or represent the views and opinions of Midas Touch Consulting._ |
| json metadata | {"tags":["bitcoin","leofinance","steemitcryptoacademy","ethereum","cryptocurrency","investing","trading","gold"],"image":["https://cdn.steemitimages.com/DQmZntXw1JT1zkWmSUstf8z15qQYD5hKc2QQdHHSsHXB1QX/celtic-gold-midas-touch-bitcoin-update-header.jpg","https://cdn.steemitimages.com/DQmYVoDVXybjHmFqUBzPAnxsd2RwfLCSH3ARotQGw3r9eNp/Chart%2001%20Bitcoin%20vs.%20Ethereum%20vs.%20Alt%20coins%20vs.%20Gold%20vs.%20Silver%20YTD%20170623.png","https://cdn.steemitimages.com/DQmRtjt2HC5mSVMnmKhB5xBdb6gqkKE5FAZLjrpA2uKzzSL/Chart%2002%20Bitcoin%20weekly%20chart%20170623.png","https://cdn.steemitimages.com/DQme3ALTrG7ZopEk4VR1qKsxnszKwSaAyuMxd3GewkB9Ax3/Chart%2003%20Bitcoin%20daily%20chart%20170623.png","https://cdn.steemitimages.com/DQmRn6BcjfKPhFa4dhkhfgY6EVTjucuod4CHCjuMc46Fib1/Chart%2004%20Crypto%20Fear%20&%20Greed%20Index%20170623.png","https://cdn.steemitimages.com/DQmU4rdFd4sr4dZ4J8GqoyLtCMtbWPY2gkEYVMT2jP19kVN/Chart%2005%20Crypto%20Fear%20&%20Greed%20Index%20longterm%20170623.png","https://cdn.steemitimages.com/DQmbWd9vxzqZDLZ8ne5yV1YXTsQz548JKtQyBqiTYnC63uY/Chart%2006%20Bitcoin%20seasonality%20090623.png","https://cdn.steemitimages.com/DQmWo3bSg48Lknid5CqhSisGkP2iCCrMMiF9mvwyjcsUEAZ/Chart%2007%20Bitcoin:Gold-Ratio%20170623.png","https://cdn.steemitimages.com/DQmaizwawyQ9XwfhS2xdELxJ5G5Ge4tXvjFZEFLhht9EhHd/Chart%2008%20FED%20net%20liquidity%20vs.%20S&P%20500%20090623.jpeg","https://cdn.steemitimages.com/DQmYeK71Y9hQydT3hwahxb5k1vKBuWmSoUs7zNwdydp3Z8C/Chart%2009%20FED%20balance%20sheet%20vs.%20FED%20funds%20rate%20140623.png","https://cdn.steemitimages.com/DQmYMnwXWJkr4wh4AjUStqDw9hToaYYi4jPFgiZf3XTwDCV/Chart%2010%20US-bankruptcies%20070623.png"],"links":["https://www.midastouch-consulting.com/17062023-bitcoin-new-fantasy-despite-summer-lull-and-uncertainties","https://celticgold.de/blog/gold-und-bitcoin-analysen-von-florian-grummes-32/bitcoin-neue-fantasie-trotz-sommerflaute-und-unsicherheiten-216","https://t.me/MidasTouchConsulting","http://bit.ly/1EUdt2K"],"app":"steemit/0.2","format":"markdown"} |
| parent author | |
| parent permlink | bitcoin |
| permlink | june-17th-2023-bitcoin-new-fantasy-despite-summer-lull-and-uncertainties |
| title | June 17th, 2023, Bitcoin – New fantasy despite summer lull and uncertainties |
| Transaction Info | Block #75678723/Trx c14cdf2d44e4c2e8115159e8daa5de818d023a0c |
View Raw JSON Data
{
"block": 75678723,
"op": [
"comment",
{
"author": "midastouch",
"body": " \n\n# [June 17th, 2023, Bitcoin – New fantasy despite summer lull and uncertainties](https://www.midastouch-consulting.com/17062023-bitcoin-new-fantasy-despite-summer-lull-and-uncertainties)\n\nWith prices reaching nearly USD 31,000, Bitcoin’s recovery rally hit its peak on April 14th. This resulted in a doubling of prices within a span of five months. Our initial two price targets of USD 25,000 and USD 30,000 were achieved. Bitcoin – New fantasy despite summer lull and uncertainties.\n\n### Review\n\nHowever, since mid-April, Bitcoin has been drifting into a sluggish consolidation, reaching lows of around USD 24,750 last Thursday, which represents a decline of over 20%. As a result of this correction, the overall market capitalization of the entire crypto sector decreased from USD 1.26 trillion down to USD 1.02 trillion, a decline of approximately 19%. Due to the significant downward pressure on most altcoins in recent weeks, the Bitcoin dominance has risen to 48%.\n\n#### Strong bounce in the last two days\n\nNevertheless, in the past two days, Bitcoin bulls have made a comeback. With a sharp recovery, prices have already rebounded by around 8.2% to approximately USD 26,850. While it is not yet a sustainable trend reversal, it is at least a clear sign of life!\n\nThe reason behind this increase is likely the announcement that Blackrock, the world’s largest asset manager, has filed an application with the US Securities and Exchange Commission (SEC) for a Bitcoin exchange-traded fund (ETF) based on spot prices. The approval of such an ETF by the SEC is highly uncertain, as previous Bitcoin ETF applications have faced significant resistance and concerns from regulatory authorities. If the SEC does approve Blackrock’s application, a flood of new Bitcoin ETF products could enter the market.\n\n\n*Bitcoin vs. Ethereum vs. altcoins vs. Gold vs. Silver in USD year-to-date, as of June 17th, 2023. Source: Tradingview*\n\nOverall, the price development since the beginning of the year has been clearly positive for both Bitcoin (+60%) and Ethereum (+46%). However, altcoins have given back almost all of their gains (+7.59%) due to the upcoming delisting on the Robin Hood trading platform. Gold has gained 6.4%, while silver has made little progress so far this year, with a gain of only 0.82%.\n\nWhile the SEC, under the leadership of Garry Gensler, has been intensifying its scrutiny of major crypto exchanges such as Coinbase and Binance in recent weeks, the sector has lacked momentum and positive catalysts. Even before the traditional summer lull, the sector was severely impacted by high uncertainty. However, with the Blackrock application for a Bitcoin ETF, the sector could regain momentum, as a Bitcoin spot ETF is expected to bring significant new inflows of capital and purchasing demand.\n\n### Technical Analysis for Bitcoin in US-Dollar\n\n#### Bitcoin Weekly Chart – Tenacious and healthy correction so far\n\n*Bitcoin in USD, weekly chart as of June 17th, 2023. Source: Tradingview.*\n\nStarting from its low point on November 21st at USD 15,479, Bitcoin was able to recover quite vigorously until April 14th. However, the bulls ran out of steam at USD 31,000, while crypto speculators indulged unabashedly in the meme coin hysteria surrounding Pepe and others. In hindsight, this was an unmistakable sign of the approaching end of the first wave of recovery and a short-term peak.\n\nAlthough Bitcoin has retraced by 20.2% to USD 24,750 in the meantime, there was a clear lack of panic or a sharp wave. Instead, prices slid slowly and rather leisurely south for the last two months. However, the downtrend remains intact. Yet, the psychological level of USD 25,000, along with the mid-term trendline of the larger overarching uptrend channel, at least temporarily halted the bears’ progress.\n\nHowever, a look at the weekly stochastic indicator still shows an established sell signal, and the oscillator still has plenty of room to move further down towards its oversold zone. Thus, the next strong support on the weekly chart is likely to be found only at the lower Bollinger Band (USD 21,352) and the lower edge of the uptrend channel (currently around USD 21,460 USD) of the past eight months.\n\nIn summary, the weekly chart is bearish, and a medium-term decline towards approximately USD 21,750 and USD 22,250 still needs to be anticipated.\n\n#### Bitcoin Daily Chart – Reversal above the rising 200-day moving average\n\n*Bitcoin in USD, daily chart as of June 17th, 2023. Source: Tradingview*\n\nOn the daily chart, a downtrend channel has formed over the last two months, which would currently allow the bears some room on the downside until approximately USD 24,200. At the same time, the 200-day moving average (USD 23,835) swiftly caught up with the current price action from below. A reunion with this widely watched moving average seemed highly likely. However, Bitcoin has already turned up before reaching it, and the daily stochastic indicator is showing a new buy signal. Immediate and significant price declines are therefore not likely in the near term, and the encounter with the 200-day moving average may have been postponed indefinitely.\n\nOverall, the daily chart has switched to a bullish stance. The down-wave appears to have found its low point at USD 24,750. The ongoing recovery should provide us with more insight into the state of Bitcoin shortly. If a clear trend reversal and a breakout from the downtrend channel will occur with prices above USD 27,500, the path to the upside would be clear. Another attempt to break through the resistance zone between USD 29,000 and USD 31,000 could be possible in mid-summer already. However, if the ongoing bounce remains weak, the arguments for a continuation of the correction towards USD 22,500 and lower would strengthen.\n\n### Sentiment Bitcoin – New fantasy despite summer lull and uncertainties\n\n\n*Crypto Fear & Greed Index, as of June 17th, 2023. Source: Lookintobitcoin*\n\nSentiment in the crypto sector has cooled down in line with the declining prices in recent weeks. According to the “Crypto Fear & Greed Index,” the sentiment is neutral with a value of 47.\n\n\n*Crypto Fear & Greed Index long term, as of June 17th, 2023. Source: Lookintobitcoin*\n\nIn the larger picture, the recovery wave in April already failed to reach extreme sentiment levels. Therefore, sentiment-wise, Bitcoin remains in a state of uncertainty. From this perspective, the end of the bear market cannot be declared yet, as the recovery movement between January and April was still relatively weak. At the same time, the current sentiment does not impede a continuation of the recovery.\n\nOverall, Bitcoin is far from euphoria and excessive optimism. However, there is no contrarian buying opportunity due to high levels of fear and panic either.\n\n### Seasonality Bitcoin – Is the early summer rally starting now?\n\n*Seasonality for Bitcoin, as of June 8th, 2023. Source: Seasonax*\n\nThe seasonal pattern has only partially played out this year, as Bitcoin reached its high point in April already and has been falling since then. Perhaps Mr. Gensler disrupted the typical rally in May and June. However, the recovery of the past two days may have now provided the delayed start signal for the strength phase in early summer. In that case, the next two months should deliver a strong rally in the sector.\n\nAlternatively, if we stick to the early peak in April, according to the seasonal statistics, an average correction of approximately four months should follow. In this scenario, Bitcoin may potentially reach an important low point not before early August.\n\nOverall, the current situation actually contradicts the seasonal pattern, which would be unfavorable from now until autumn. However, it’s possible that this year, the typical rally between mid-April and mid-June simply occurs two months later.\n\n### Sound Money: Bitcoin vs. Gold\n\n*Bitcoin/Gold-Ratio, weekly chart as of June 17th, 2023. Source: Tradingview*\n\nIn spring, Bitcoin reached its peak more than three weeks before gold. During the recovery, the Bitcoin/Gold-ratio initially climbed to 15.25. With Bitcoin trading at around USD 26,650 and gold at USD 1,957, currently, one Bitcoin costs approximately 13.62 ounces of gold. Vice versa, one ounce of gold currently costs about 0.073 Bitcoin. Overall, since the beginning of the year, Bitcoin has clearly been the faster horse, outperforming gold by a factor of 10!\n\nDuring the correction, the ratio recently dropped back to 12.8. However, since Thursday, Bitcoin has been turning upwards again, and the recovery since the beginning of the year may continue. Additionally, the lower Bollinger Band on the weekly chart opposes significantly lower ratio values (below 12). Therefore, for those who wish to adjust their “safe haven” allocation in favor of Bitcoin, now, or at ratio values around 12, would likely be a suitable time to do so.\n\nIn summary, the Bitcoin/Gold ratio has corrected as expected. Although the weekly stochastic indicator is far from being oversold, we anticipate a recovery over the next two months, with ratio values around 15.\n\n### Macro Update – Deceptive calmness\n\nAfter numerous bank collapses in March, which even led to a bank run in the U.S., the situation has significantly calmed down in recent weeks.\n\n*FED balance sheet vs. net liquidity vs. S&P 500, as of June 9th, 2023. Source: Pictet Asset Management*\n\nThe reason for this deceptive calmness can be attributed to massive liquidity injections (Bank Term Funding Program) by the American central bank. Instead of implementing the planned “Quantitative Tightening” of USD 750 billion, there is now, in essence, a form of “Quantitative Easing Light” of approximately USD 100 billion! The increase in net liquidity is a result of US banks being able to borrow from the Federal Reserve (FED) at a credit cost of 5% interest per year to cover their significantly decreased bonds at USD 1.00 instead of their real value of USD 0.50. While this credit incurs interest, it has temporarily pushed the problem into the future and avoided a liquidity crisis. This is why the stock markets are rising, as the S&P500 is up more than 27.5% since last November. No doubt, the crack-up boom is underway!\n\n\n*US FED balance sheet vs. FED funds rate, as of June 14th, 2023. Source: Holger Zschaepitz*\n\nLast Wednesday evening, the FED decided not to further increase interest rates after more than a year of aggressive hikes. However, Federal Reserve Chairman Powell indicated that the pause may only be temporary, as the Fed implies two more 25 basis points rate hikes later this year.\n\nWith its rigorous tightening cycle, the FED has already shattered the porcelain. The hastily concocted rescue programs since March have only masked the problems, while a massive smoldering fire continues to burn behind the scenes of the financial system.\n\n#### Hiking cycle brought the end of easy money\n\n*Bankruptcy filings in the US, as of June 7, 2023. Source: S&P Global*\n\nFor those who make the effort to seek facts beyond the mainstream, they will discover, for example, that the number of bankruptcy filings in the US this year has reached the highest level since 2010.\n\nThe underlying reason is that the increased interest rates have made debt much more expensive. Additionally, the investors who are supposed to buy these debts have become more cautious because the easy money, once abundant due to the low interest rates, is no longer readily available. However, once companies become reliant on easy money to sustain themselves due to high debt levels, it becomes challenging to break free from this dependency. In a way, the economy is normalizing with interest rates typical of the pre-QE era. But companies that could survive only because of easy money are now feeling the pressure.\n\n#### Commercial real estate is the next shoe to drop\n\nFurthermore, the next storm is brewing, particularly in the US commercial real estate sector. Currently, numerous US banks are hurrying to reduce their exposure to this sector due to an imminent wave of payment defaults. PacWest recently sold a construction loan portfolio worth USD 2.6 billion at a significant loss, while HSBC is seeking to sell hundreds of millions of dollars in commercial real estate loans as quickly as possible. Many regional lenders, in particular, may have to consider selling commercial real estate loans at a substantial discount. As the sales gain momentum, the downward spiral accelerates, further depressing property prices. It is likely that nearly half of the 4,800 American banks have already depleted their capital buffers and are potentially insolvent.\n\nMeanwhile, vacancy rates in offices and retail stores in San Francisco for example continue to soar, while safety concerns and drug abuse deter tourists and visitors. The city could become one of the epicenters of the next apocalypse. Recently, Unibail-Rodamco-Westfield and Brookfield Corp. had to transfer ownership of the city’s largest shopping center to the lender after they were no longer able to make payments on the USD 558 million loan. Park Hotels & Resorts Inc. has also halted loan payments for two downtown hotels with outstanding debts totaling USD 725 million.\n\n#### A wave of payment defaults and bankruptcies is looming\n\nThe boom-and-bust cycle will continue, as the tightest policies from the FED and the European Central Bank (ECB) in 15 years collide with high levels of debt and adventurous derivative structures. The foreseeable wave of payment defaults in the US and Europe will also hit the real economy hard, with default rates possibly not peaking before the fourth quarter of 2024 or even later.\n\nIn the past, the FED halted its aggressive interest rate hike cycle back in June 2006. However, the major financial crisis only began a year and a half later! Therefore, the financial markets are facing challenging times ahead. While the buzzword “AI” is currently celebrated in the stock markets, the low volatility is likely just the calm before the next storm. While precious metals may provide protection right at the beginning of the crisis this time, Bitcoin will face difficulties during stock market turbulence and may only experience sustained growth during subsequent rescue programs.\n\n### Conclusion: Bitcoin – New fantasy despite summer lull and uncertainties\n\nAfter sliding south for two months, Bitcoin has started a recovery in the past two days. Soon, it should become evident from a technical analysis perspective whether the “Bitcoin ETF fantasy” is enough to push the prices back above USD 27,500. If successful, a rise to around USD 30,000 and even USD 35,000 USD could be possible by mid-summer. Alternatively, due to the lingering regulatory uncertainties, the sector may fall back into its recent premature summer lethargy.\n\n_Analysis sponsored and initially published on June 17th, 2023, by [www.celticgold.eu](https://celticgold.de/blog/gold-und-bitcoin-analysen-von-florian-grummes-32/bitcoin-neue-fantasie-trotz-sommerflaute-und-unsicherheiten-216). Translated into English and partially updated on June 17th, 2023._ \n\n_Feel free to join us in our free [Telegram channel](https://t.me/MidasTouchConsulting) for daily real time data and a great community._ \n\n_If you like to get regular updates on our gold model, precious metals, commodities, and cryptocurrencies you can subscribe to our [free newsletter](http://bit.ly/1EUdt2K)._ \n\n_Disclosure: This article and the content are for informational purposes only and do not contain investment advice or recommendations. Every investment and trading move involves risk, and readers should conduct their own research when making a decision. The views, thoughts and opinions expressed here are the author’s alone. They do not necessarily reflect or represent the views and opinions of Midas Touch Consulting._",
"json_metadata": "{\"tags\":[\"bitcoin\",\"leofinance\",\"steemitcryptoacademy\",\"ethereum\",\"cryptocurrency\",\"investing\",\"trading\",\"gold\"],\"image\":[\"https://cdn.steemitimages.com/DQmZntXw1JT1zkWmSUstf8z15qQYD5hKc2QQdHHSsHXB1QX/celtic-gold-midas-touch-bitcoin-update-header.jpg\",\"https://cdn.steemitimages.com/DQmYVoDVXybjHmFqUBzPAnxsd2RwfLCSH3ARotQGw3r9eNp/Chart%2001%20Bitcoin%20vs.%20Ethereum%20vs.%20Alt%20coins%20vs.%20Gold%20vs.%20Silver%20YTD%20170623.png\",\"https://cdn.steemitimages.com/DQmRtjt2HC5mSVMnmKhB5xBdb6gqkKE5FAZLjrpA2uKzzSL/Chart%2002%20Bitcoin%20weekly%20chart%20170623.png\",\"https://cdn.steemitimages.com/DQme3ALTrG7ZopEk4VR1qKsxnszKwSaAyuMxd3GewkB9Ax3/Chart%2003%20Bitcoin%20daily%20chart%20170623.png\",\"https://cdn.steemitimages.com/DQmRn6BcjfKPhFa4dhkhfgY6EVTjucuod4CHCjuMc46Fib1/Chart%2004%20Crypto%20Fear%20&%20Greed%20Index%20170623.png\",\"https://cdn.steemitimages.com/DQmU4rdFd4sr4dZ4J8GqoyLtCMtbWPY2gkEYVMT2jP19kVN/Chart%2005%20Crypto%20Fear%20&%20Greed%20Index%20longterm%20170623.png\",\"https://cdn.steemitimages.com/DQmbWd9vxzqZDLZ8ne5yV1YXTsQz548JKtQyBqiTYnC63uY/Chart%2006%20Bitcoin%20seasonality%20090623.png\",\"https://cdn.steemitimages.com/DQmWo3bSg48Lknid5CqhSisGkP2iCCrMMiF9mvwyjcsUEAZ/Chart%2007%20Bitcoin:Gold-Ratio%20170623.png\",\"https://cdn.steemitimages.com/DQmaizwawyQ9XwfhS2xdELxJ5G5Ge4tXvjFZEFLhht9EhHd/Chart%2008%20FED%20net%20liquidity%20vs.%20S&P%20500%20090623.jpeg\",\"https://cdn.steemitimages.com/DQmYeK71Y9hQydT3hwahxb5k1vKBuWmSoUs7zNwdydp3Z8C/Chart%2009%20FED%20balance%20sheet%20vs.%20FED%20funds%20rate%20140623.png\",\"https://cdn.steemitimages.com/DQmYMnwXWJkr4wh4AjUStqDw9hToaYYi4jPFgiZf3XTwDCV/Chart%2010%20US-bankruptcies%20070623.png\"],\"links\":[\"https://www.midastouch-consulting.com/17062023-bitcoin-new-fantasy-despite-summer-lull-and-uncertainties\",\"https://celticgold.de/blog/gold-und-bitcoin-analysen-von-florian-grummes-32/bitcoin-neue-fantasie-trotz-sommerflaute-und-unsicherheiten-216\",\"https://t.me/MidasTouchConsulting\",\"http://bit.ly/1EUdt2K\"],\"app\":\"steemit/0.2\",\"format\":\"markdown\"}",
"parent_author": "",
"parent_permlink": "bitcoin",
"permlink": "june-17th-2023-bitcoin-new-fantasy-despite-summer-lull-and-uncertainties",
"title": "June 17th, 2023, Bitcoin – New fantasy despite summer lull and uncertainties"
}
],
"op_in_trx": 0,
"timestamp": "2023-06-20T17:27:21",
"trx_id": "c14cdf2d44e4c2e8115159e8daa5de818d023a0c",
"trx_in_block": 39,
"virtual_op": 0
}midastouchupvoted (100.00%) @midastouch / february-23rd-2023-bitcoin-next-target-30-000-usd2023/02/24 15:36:45
midastouchupvoted (100.00%) @midastouch / february-23rd-2023-bitcoin-next-target-30-000-usd
2023/02/24 15:36:45
| author | midastouch |
| permlink | february-23rd-2023-bitcoin-next-target-30-000-usd |
| voter | midastouch |
| weight | 10000 (100.00%) |
| Transaction Info | Block #72353976/Trx 7c377137aa2b2649770ed20cea026e6da50a1f7d |
View Raw JSON Data
{
  "block": 72353976,
  "op": [
    "vote",
    {
      "author": "midastouch",
      "permlink": "february-23rd-2023-bitcoin-next-target-30-000-usd",
      "voter": "midastouch",
      "weight": 10000
    }
  ],
  "op_in_trx": 0,
  "timestamp": "2023-02-24T15:36:45",
  "trx_id": "7c377137aa2b2649770ed20cea026e6da50a1f7d",
  "trx_in_block": 4,
  "virtual_op": 0
}midastouchpublished a new post: february-23rd-2023-bitcoin-next-target-30-000-usd2023/02/24 15:36:12
midastouchpublished a new post: february-23rd-2023-bitcoin-next-target-30-000-usd
2023/02/24 15:36:12
| author | midastouch |
| body |  # [February 23rd, 2023, Bitcoin – Next target 30,000 USD](https://www.midastouch-consulting.com/23022023-bitcoin-next-target-30000-usd) In the first few weeks of 2023, Bitcoin’s price has continued its upward trajectory, fueled by growing institutional adoption and increased investor confidence in the cryptocurrency market. Despite some short-term volatility, Bitcoin has remained above key support levels and is on track to recover further. As more traditional financial institutions enter the space and new use cases for blockchain and web3 technology emerge, the outlook for Bitcoin and the wider cryptocurrency market remains positive. Bitcoin – Next target 30,000 USD. ### Review The new trading year started on a high note for Bitcoin. Beginning from prices hovering around 16,500 USD, the market saw a nearly 53% increase in the last seven and a half weeks, catching many market participants off guard who had previously exited or were underinvested. This surge may have been further fueled by short sellers covering their short positions. In December and January, we had already identified and laid out the case for a significant recovery and foreseeable upward momentum. Our recovery scenario predicting prices of at least 35,000 USD remains unchanged, with our first price target of 25,000 USD having been reached on February 16th. 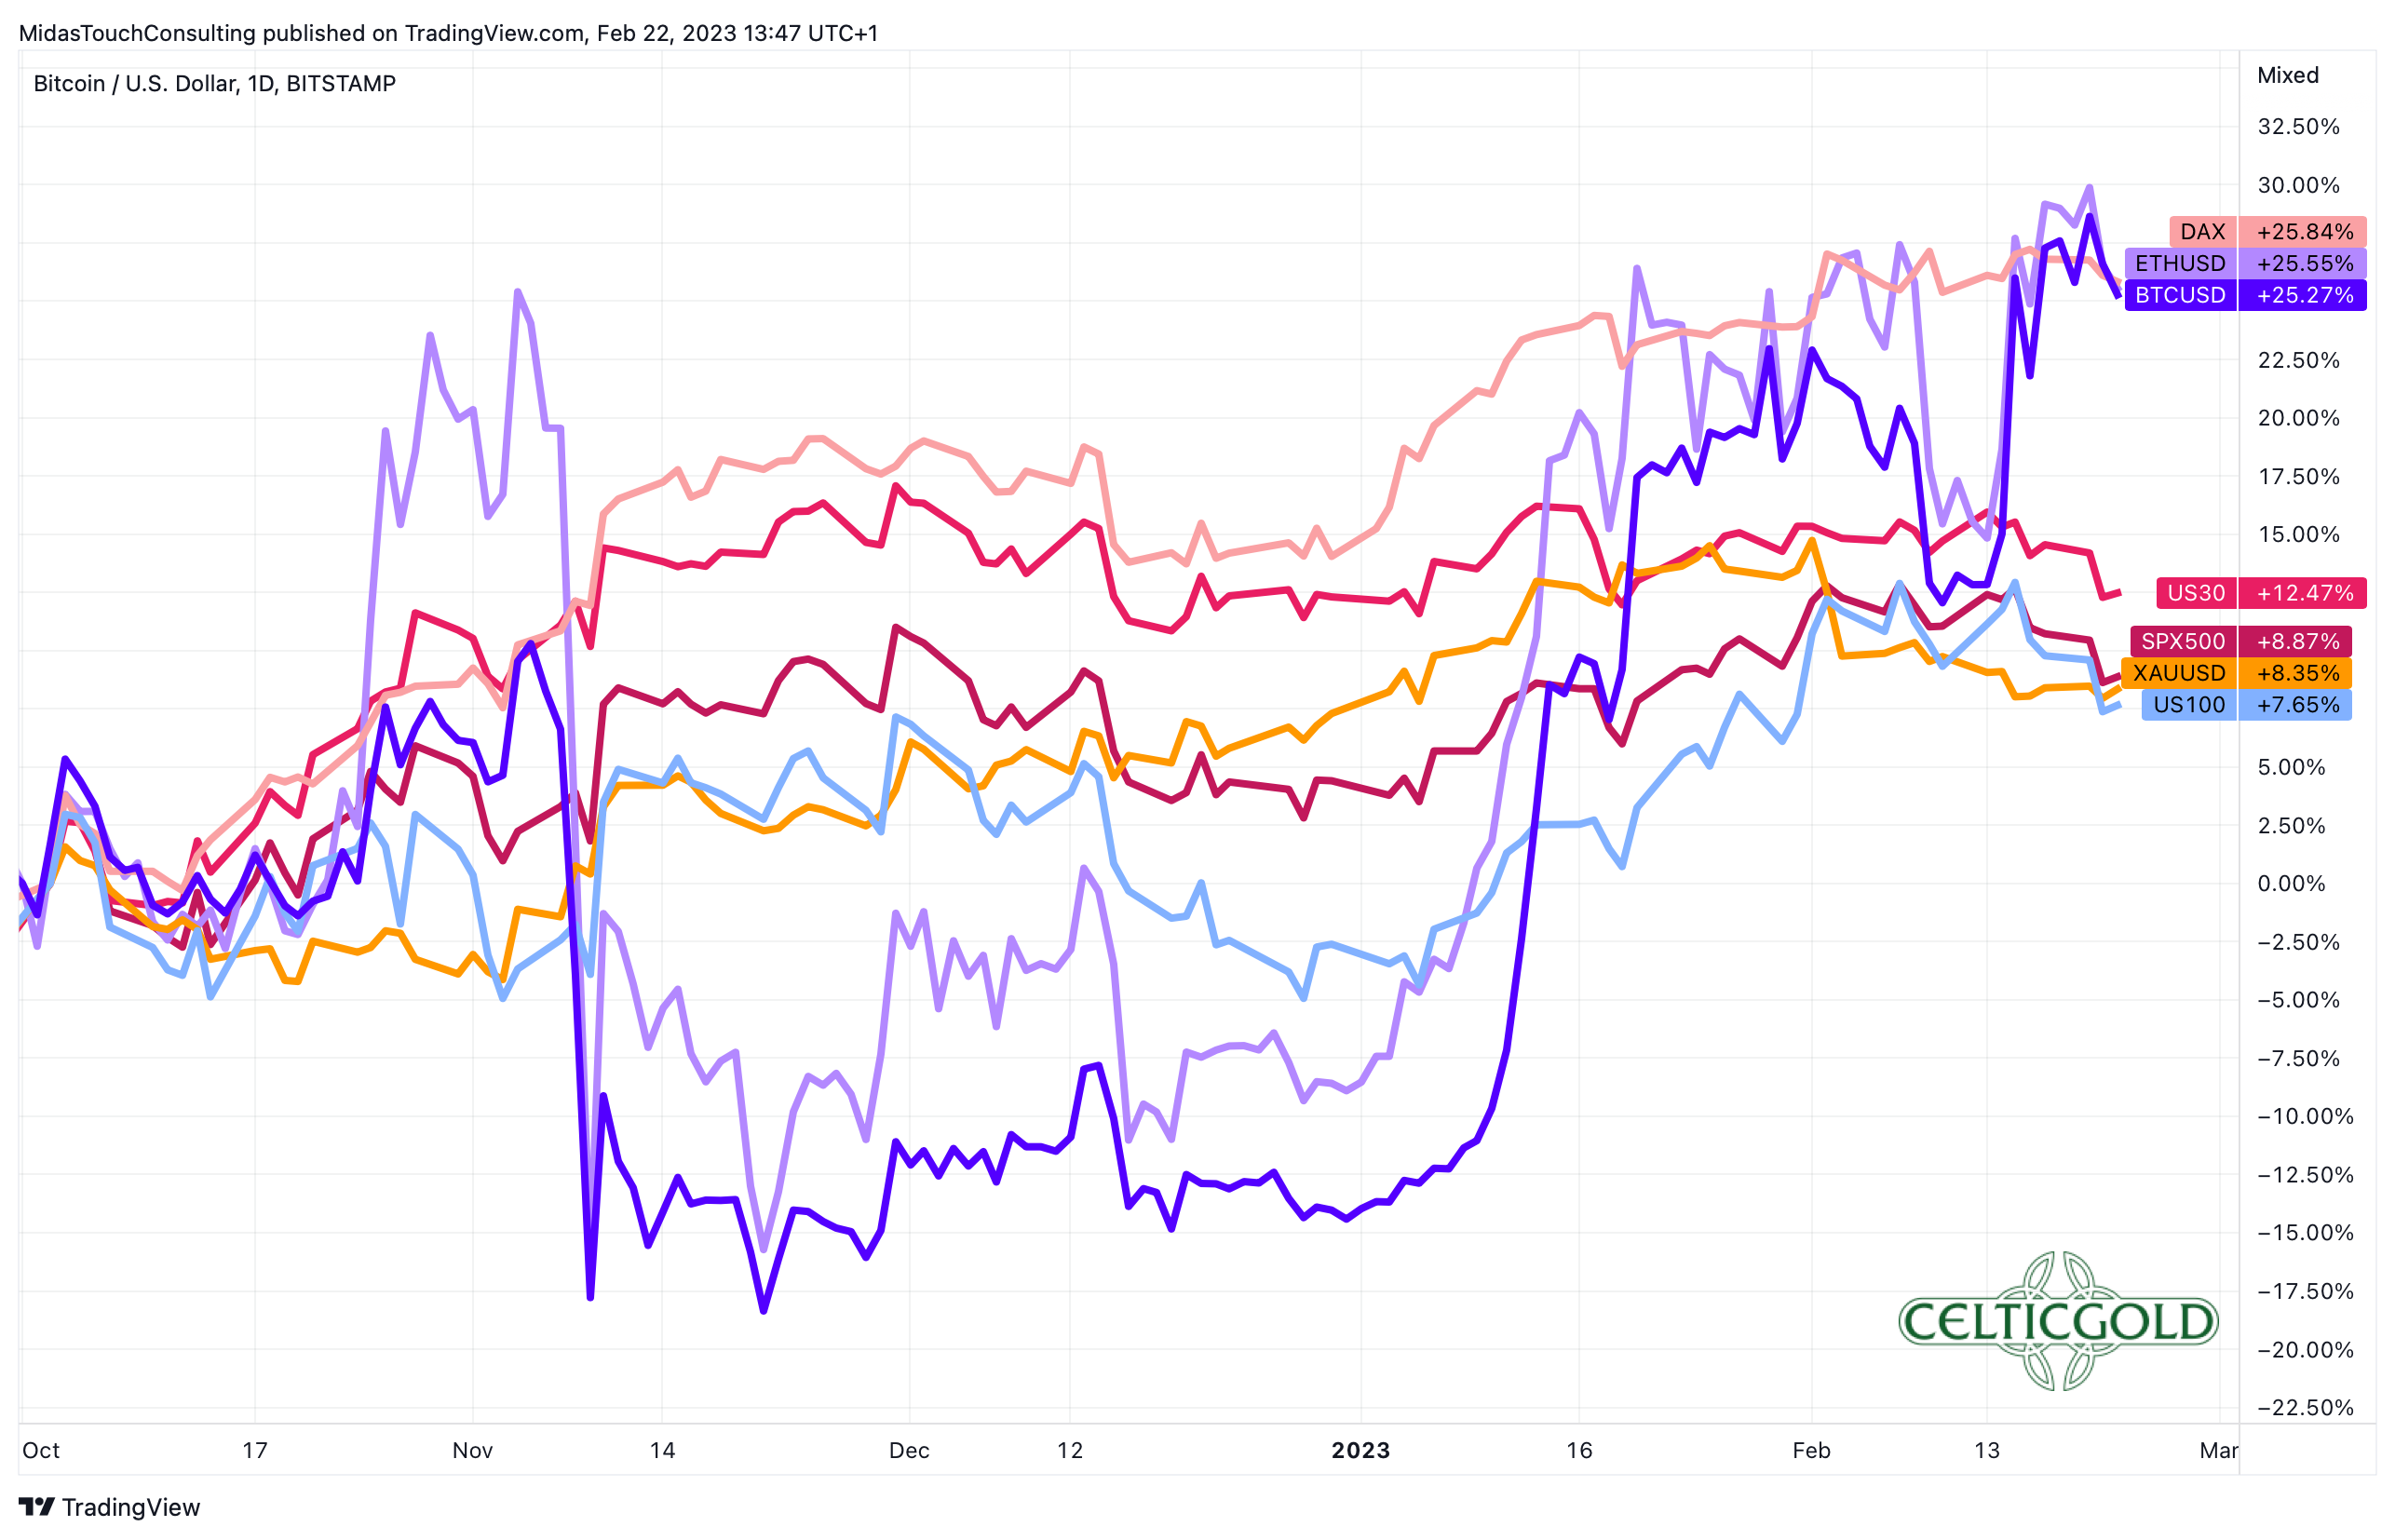 *Performance Bitcoin vs. Ethereum vs. stocks vs. gold since 1st of October 2022, as of February 23rd, 2023. Source: Tradingview.* Despite showing improvement since the start of the year, Bitcoin and the broader crypto sector still face challenges and are somewhat reliant on overall market trends. While stock markets and precious metals have experienced significant recoveries over the past four months, Bitcoin has yet to fully catch up, indicating further upside potential. #### Restrictive central bank policies remain a big burden However, the current fundamental setup for financial markets remains uncertain and complex due to the Federal Reserve and European Central Bank’s aggressive interest rate hikes and balance sheet reductions. Though equities and precious metals have shown a rally beyond what is typical of a bear market, the restrictive policies of central banks continue to pose a significant burden on the markets, with growing concerns that this issue has been increasingly ignored in recent months. Meanwhile, the recent pullback in the gold price following an impressive recovery rally over the past months and the U.S. dollar’s slight gain since February also present challenges for the market. ### Technical Analysis for Bitcoin in US-Dollar #### Bitcoin Weekly Chart – Stabilization Following the First Breakout 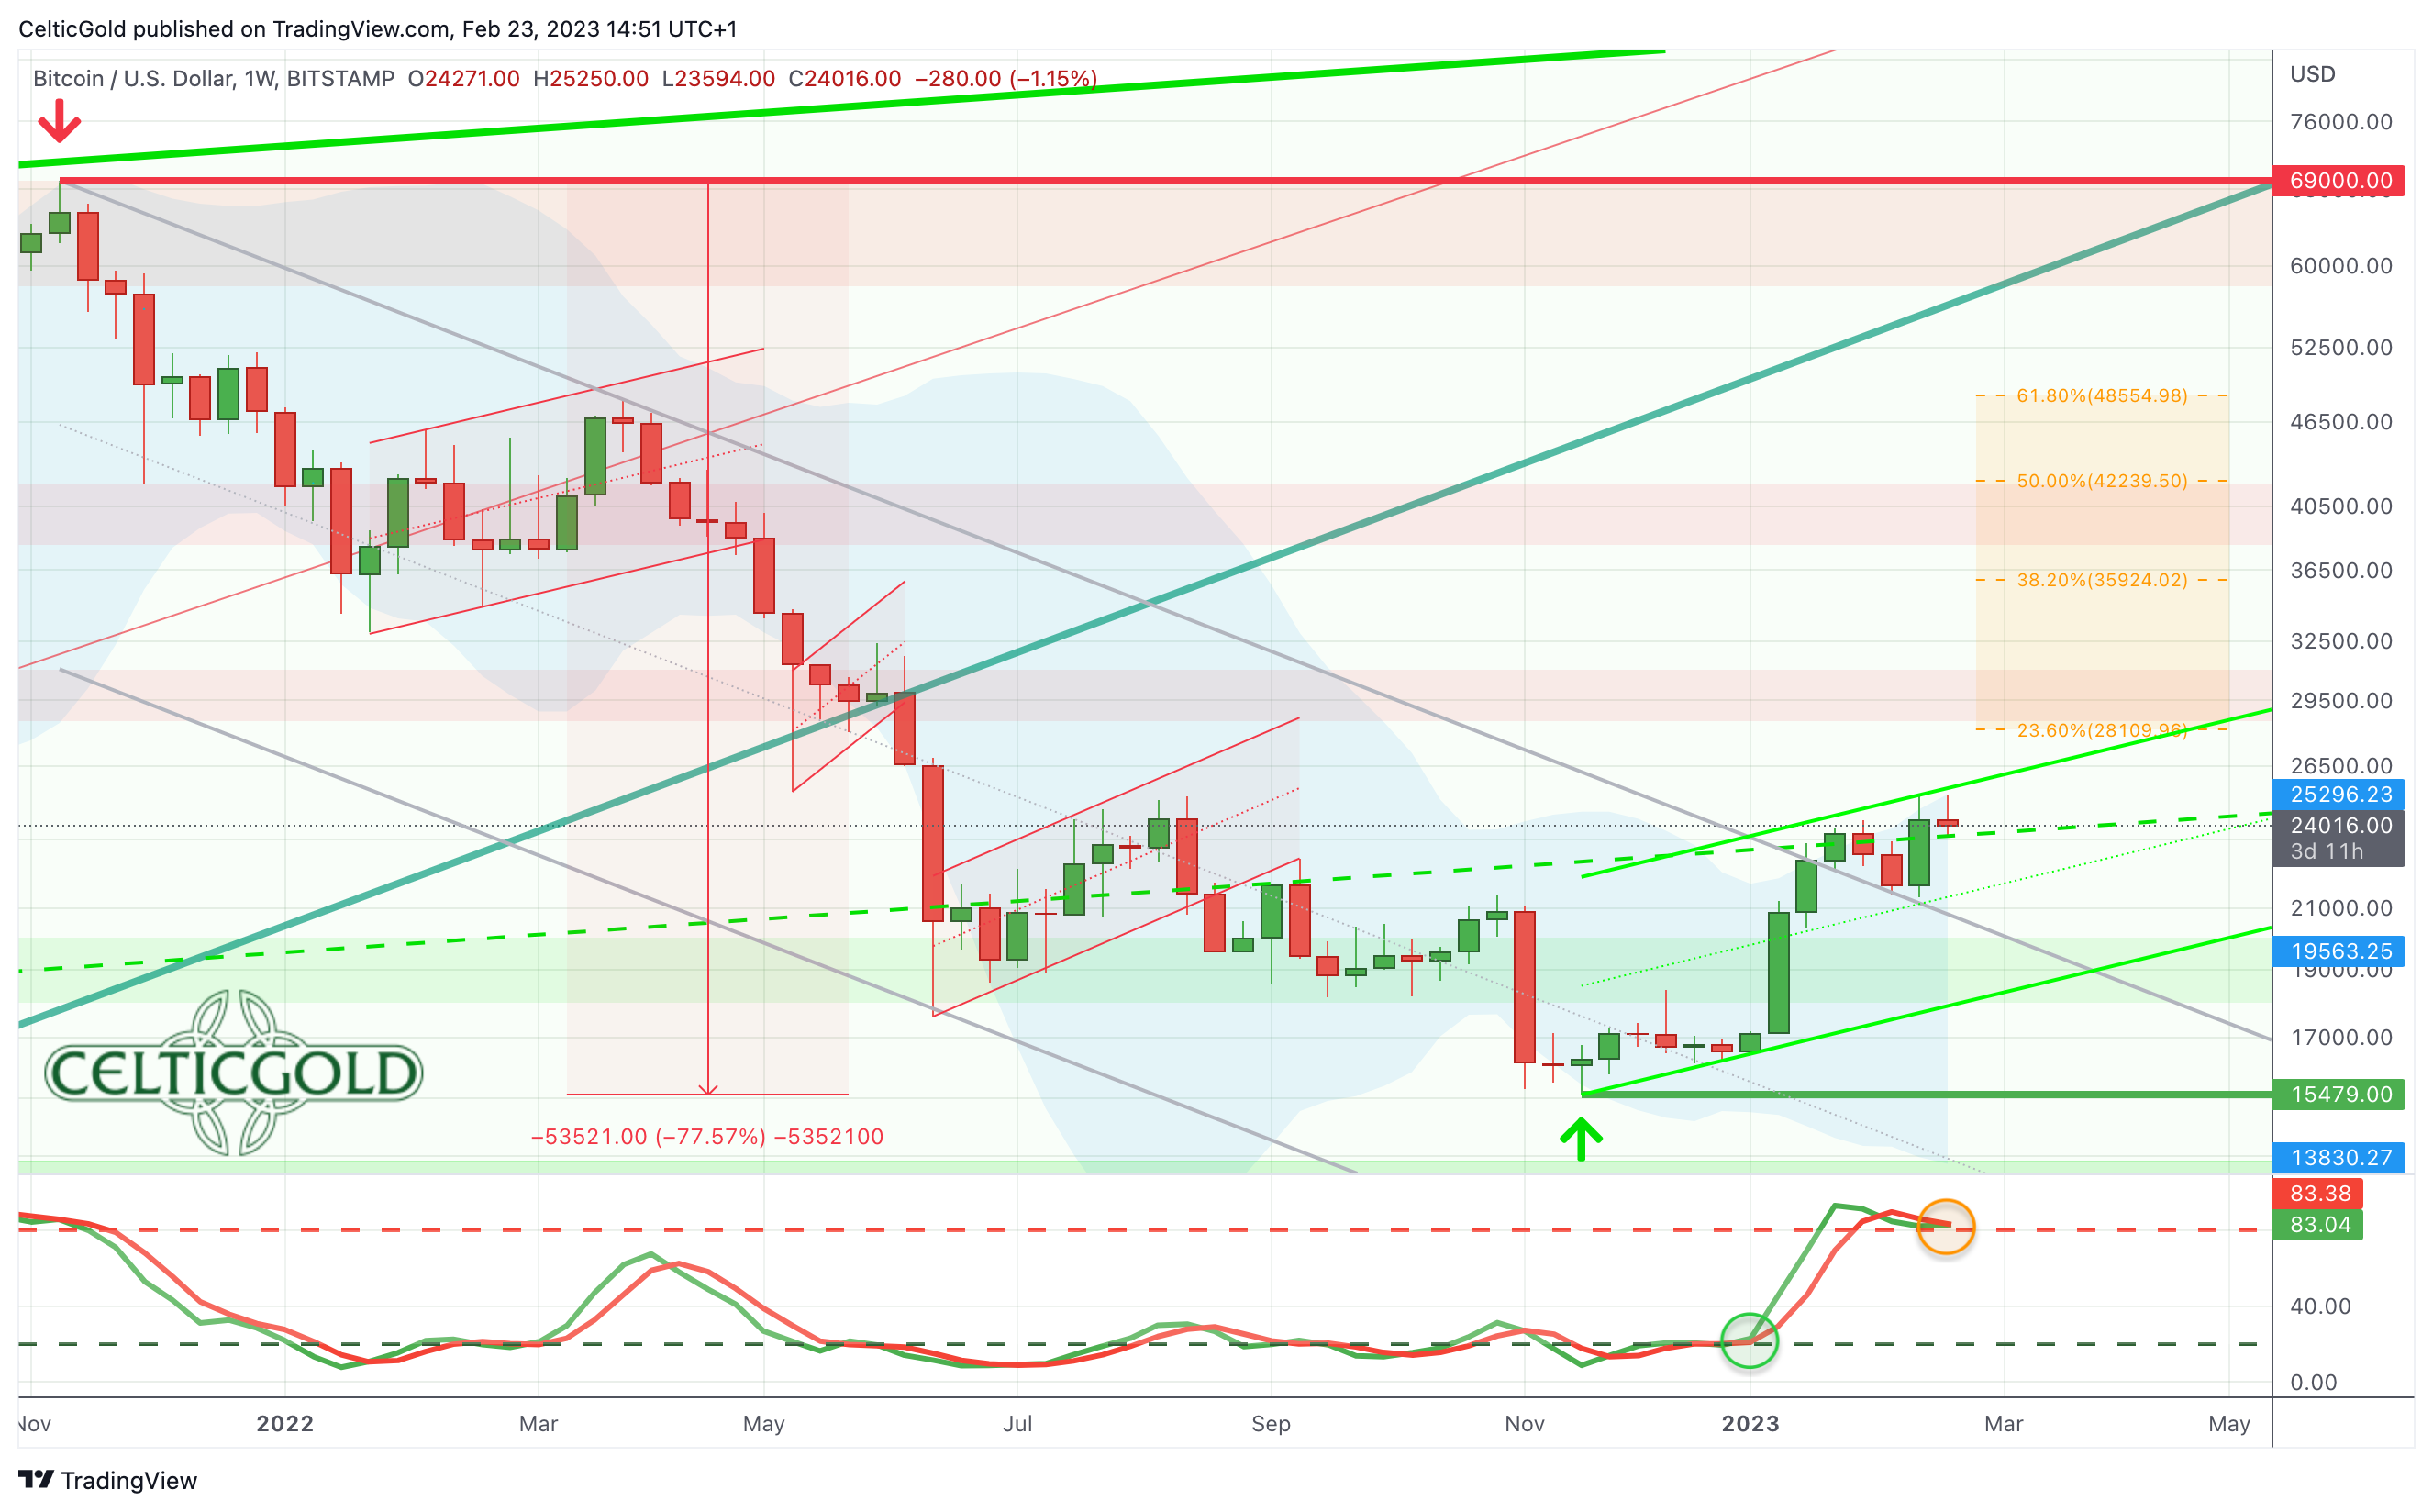 *Bitcoin in USD, weekly chart as of February 23rd, 2023. Source: Tradingview* Bitcoin’s weekly chart reveals a notable stabilization following the first breakout above 22,700 USD in mid-January. This move was Bitcoin’s first answer to the severe fourteen months long correction of -77.5%. Although gains on the upside have been moderate thus far, the overall picture has stabilized significantly. The chart also indicates that Bitcoin is likely to recover towards one of the classic retracement levels of the previous correction. Hence, the potential levels are at 28,109 USD (23.6%), 35,924 USD (38.2%), and 48,554 USD (61.8%). Even if the stochastic oscillator initially turns down from its overbought zone, the former downtrend line in the range of 20,500 USD is expected to withstand another test. Overall, the bullish weekly chart suggests a rise in the direction of approximately 28,000 USD. However, the bulls need to increase their momentum and bend up the upper Bollinger Band (25,298 USD). Only successful breach of this resistance level may result in a rapid ascent towards 30,000 USD and beyond. #### Bitcoin Daily Chart – When will Bitcoin break out above 25,250 USD? 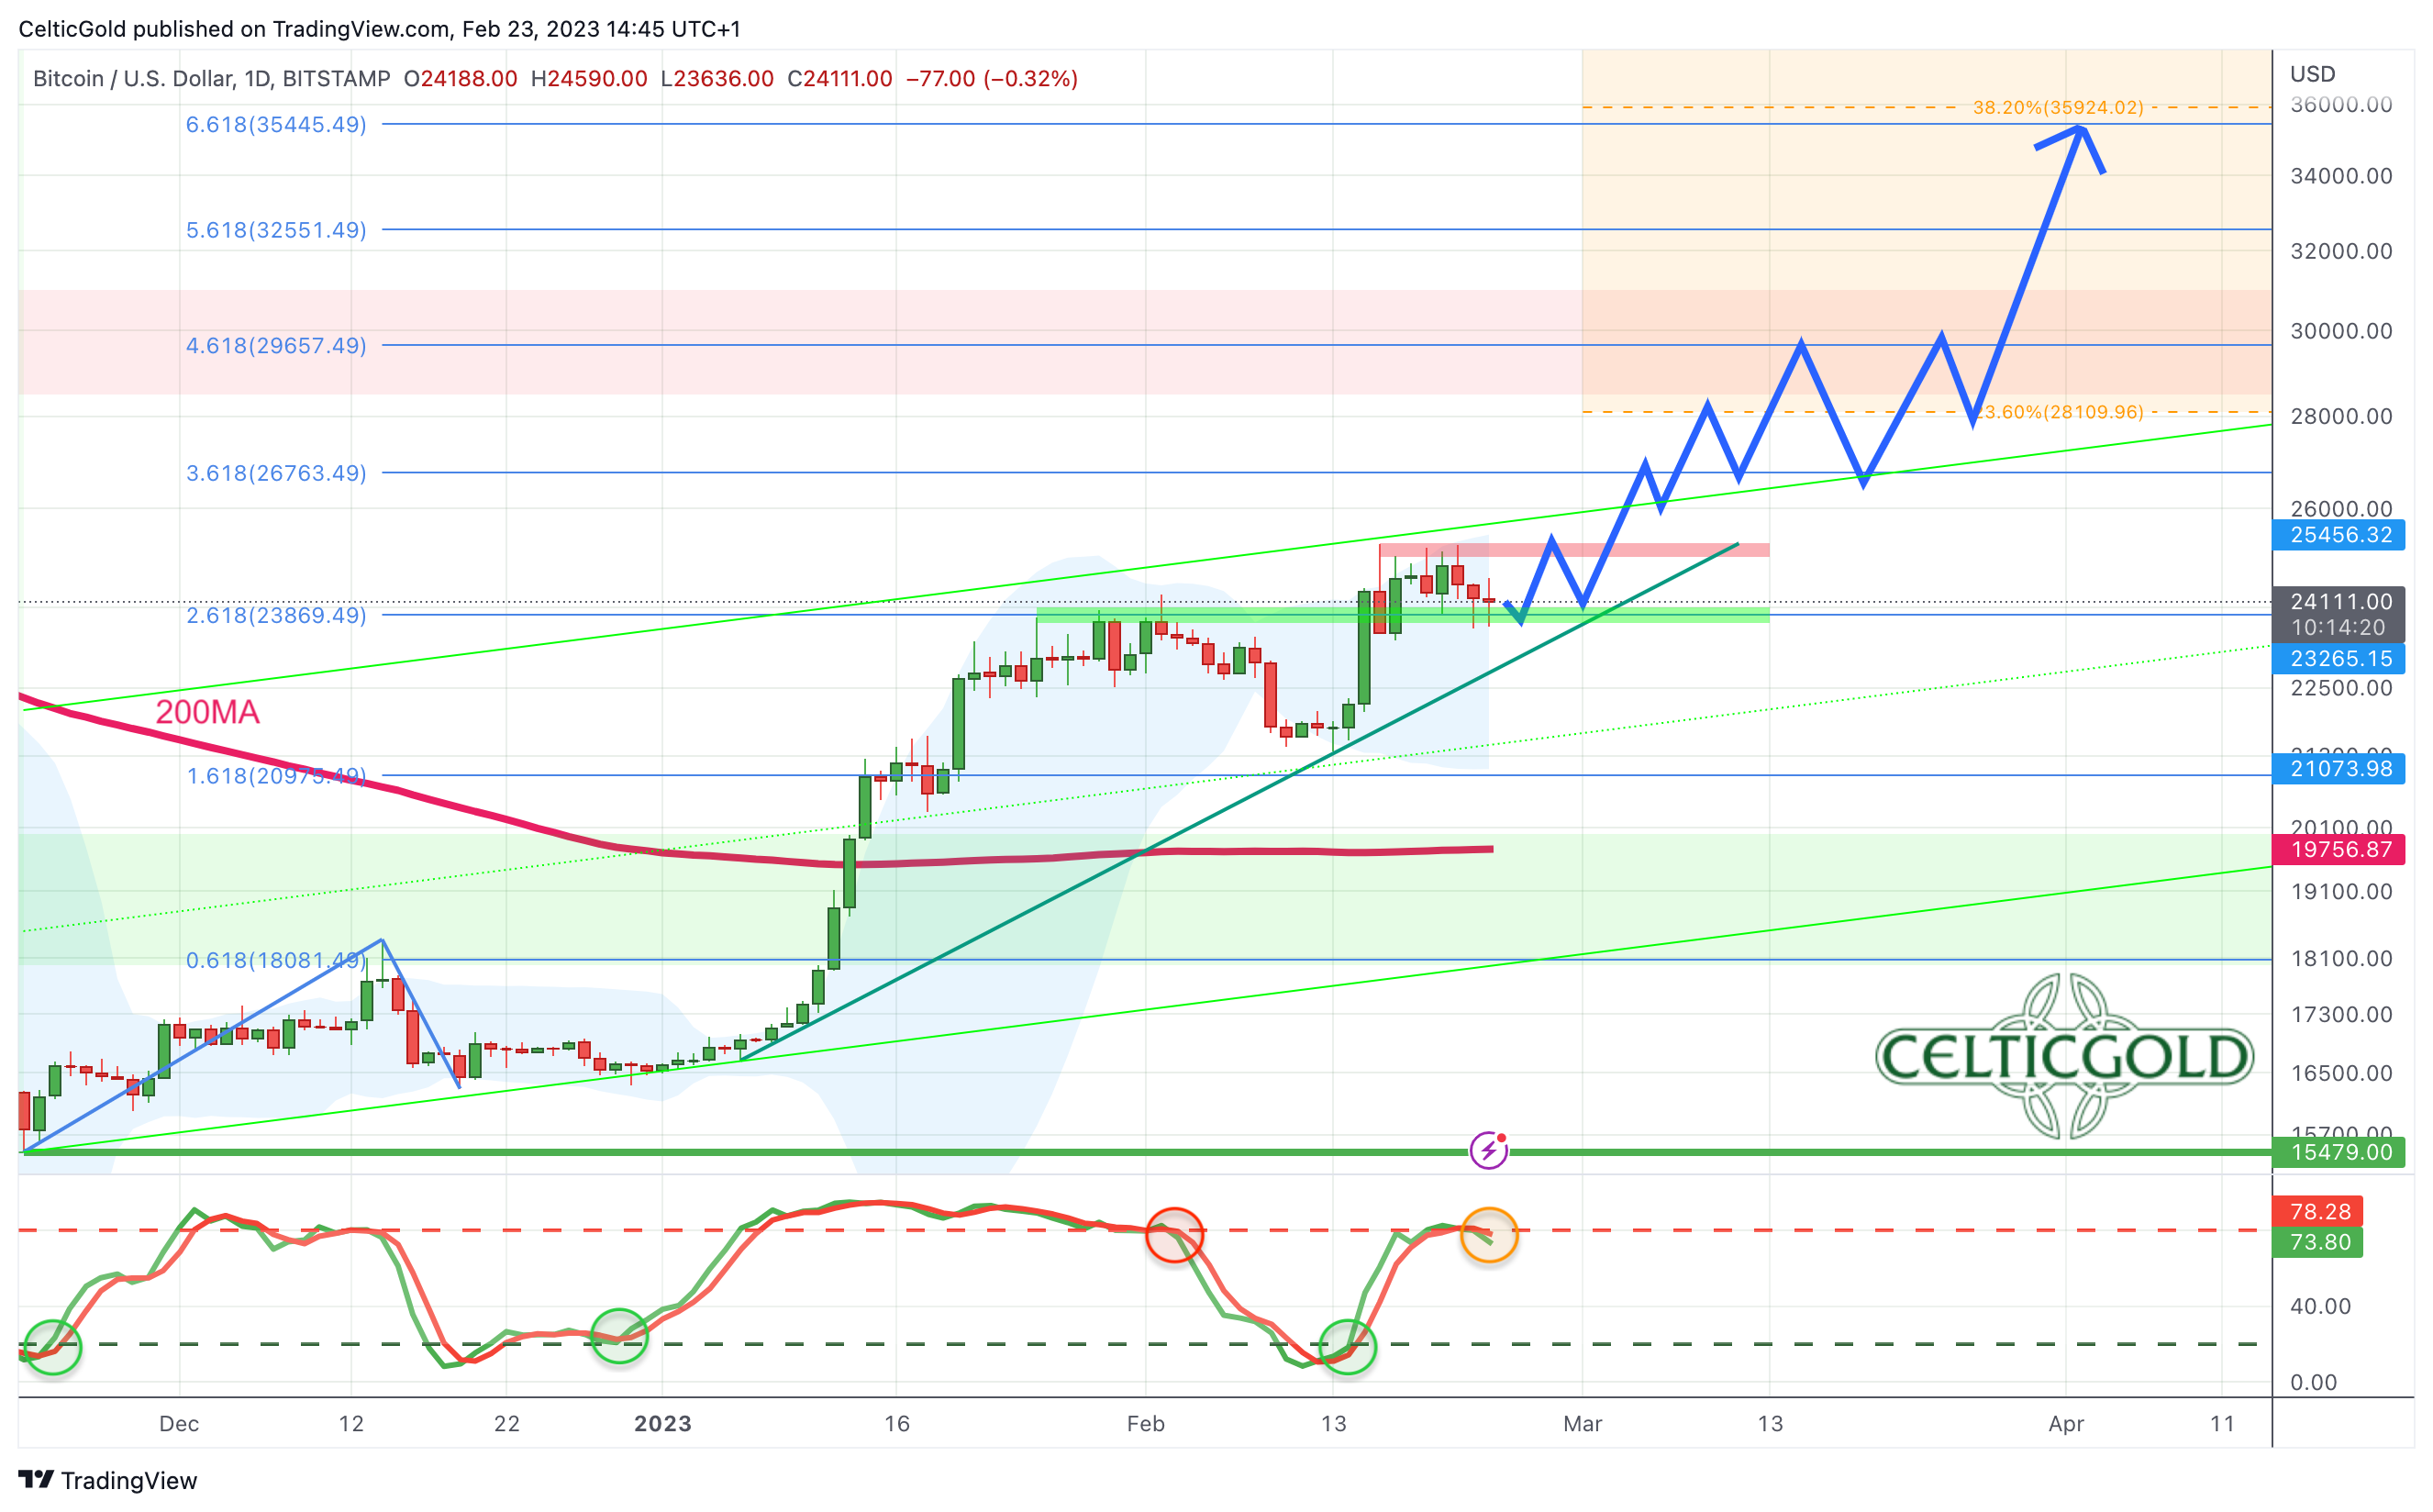 *Bitcoin in USD, daily chart as of February 23rd, 2023. Source: Tradingview* On the daily chart, Bitcoin’s first bounce from the correction low of 15,479 USD on November 21st reached 18,373 USD. Using the Fibonacci extensions on this initial wave-up, we can create a rough roadmap for the further recovery. Currently, Bitcoin has reached the 1.618% and 2.618% extensions, with the 3.618% extension at 26,750 USD being the next logical step. In the short term, Bitcoin’s prices have been running against the 25,000 USD mark for several days, with pullbacks not causing any significant downside damage thus far. Holding the support around 23,500 USD potentially creates a small ascending triangle. Since short sellers still outnumber the bulls, a sustained breakout above 25,250 USD could quickly trigger another sharp wave-up, pushing Bitcoin towards about 30,000 USD. In summary, the daily chart indicates a bullish trend, and an imminent breakout above 25,250 USD is likely. Only the slightly overbought stochastic oscillator appears unfavorable, as it has yet to transform itself into the rare and super bullish embedded state (= both signal lines sitting above 80 for at least three trading days). Generally, as long as prices remain above 23,500 USD and, more importantly, above 22,500 USD, the imminent recovery scenario remains intact. ### Sentiment Bitcoin – Next target 30,000 USD 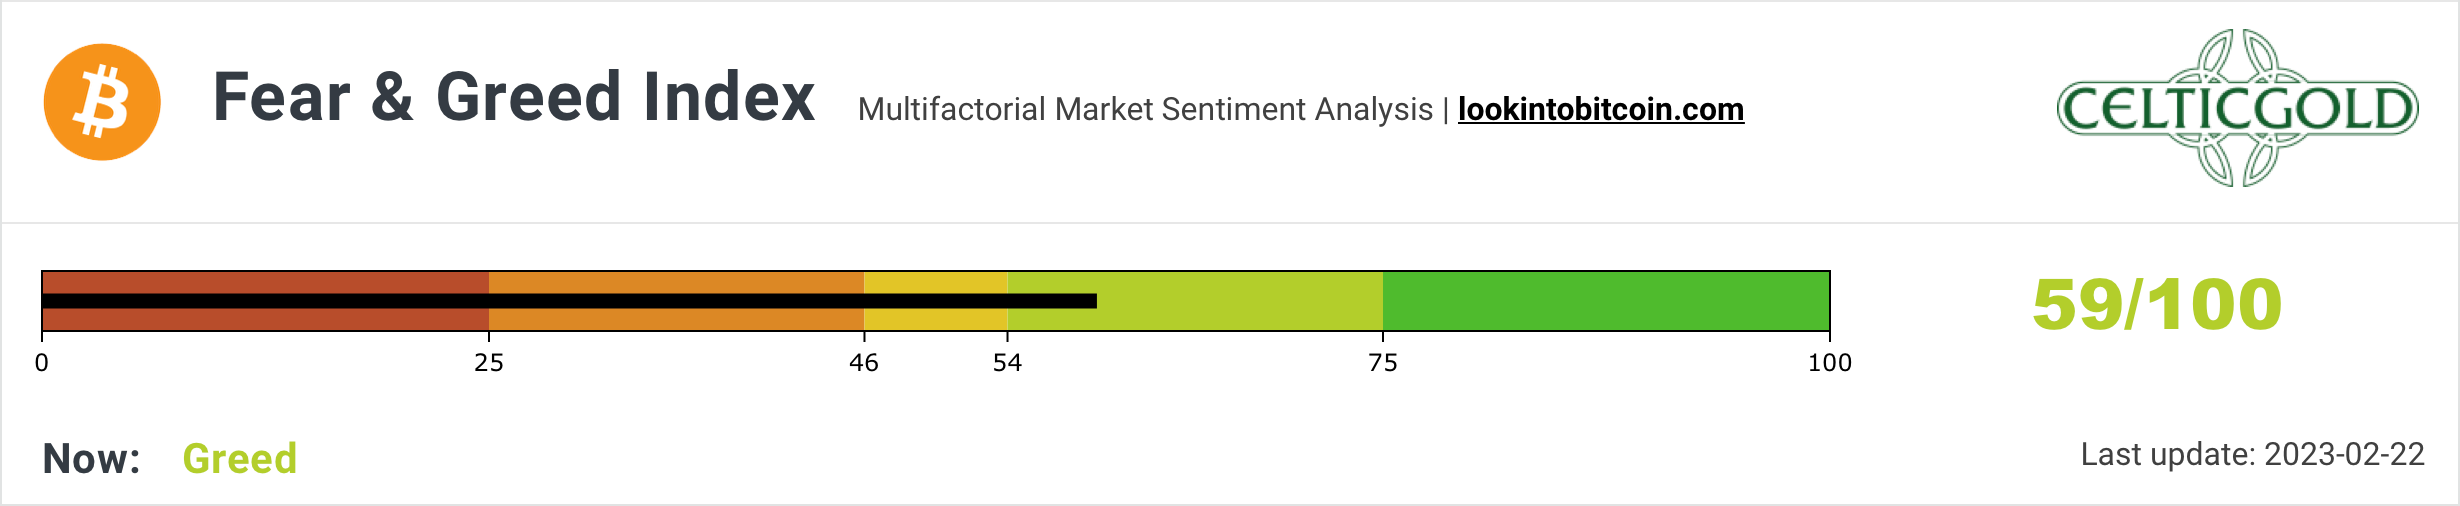 *Crypto Fear & Greed Index, as of February 22nd, 2023. Source: Lookintobitcoin* As the crypto sector continues its significant recovery, the sentiment within the market has become more confident and optimistic. The Crypto Fear & Greed Index, which measures the emotions amongst the market participants, has risen to a value of 59, indicating a slight “greed state”. 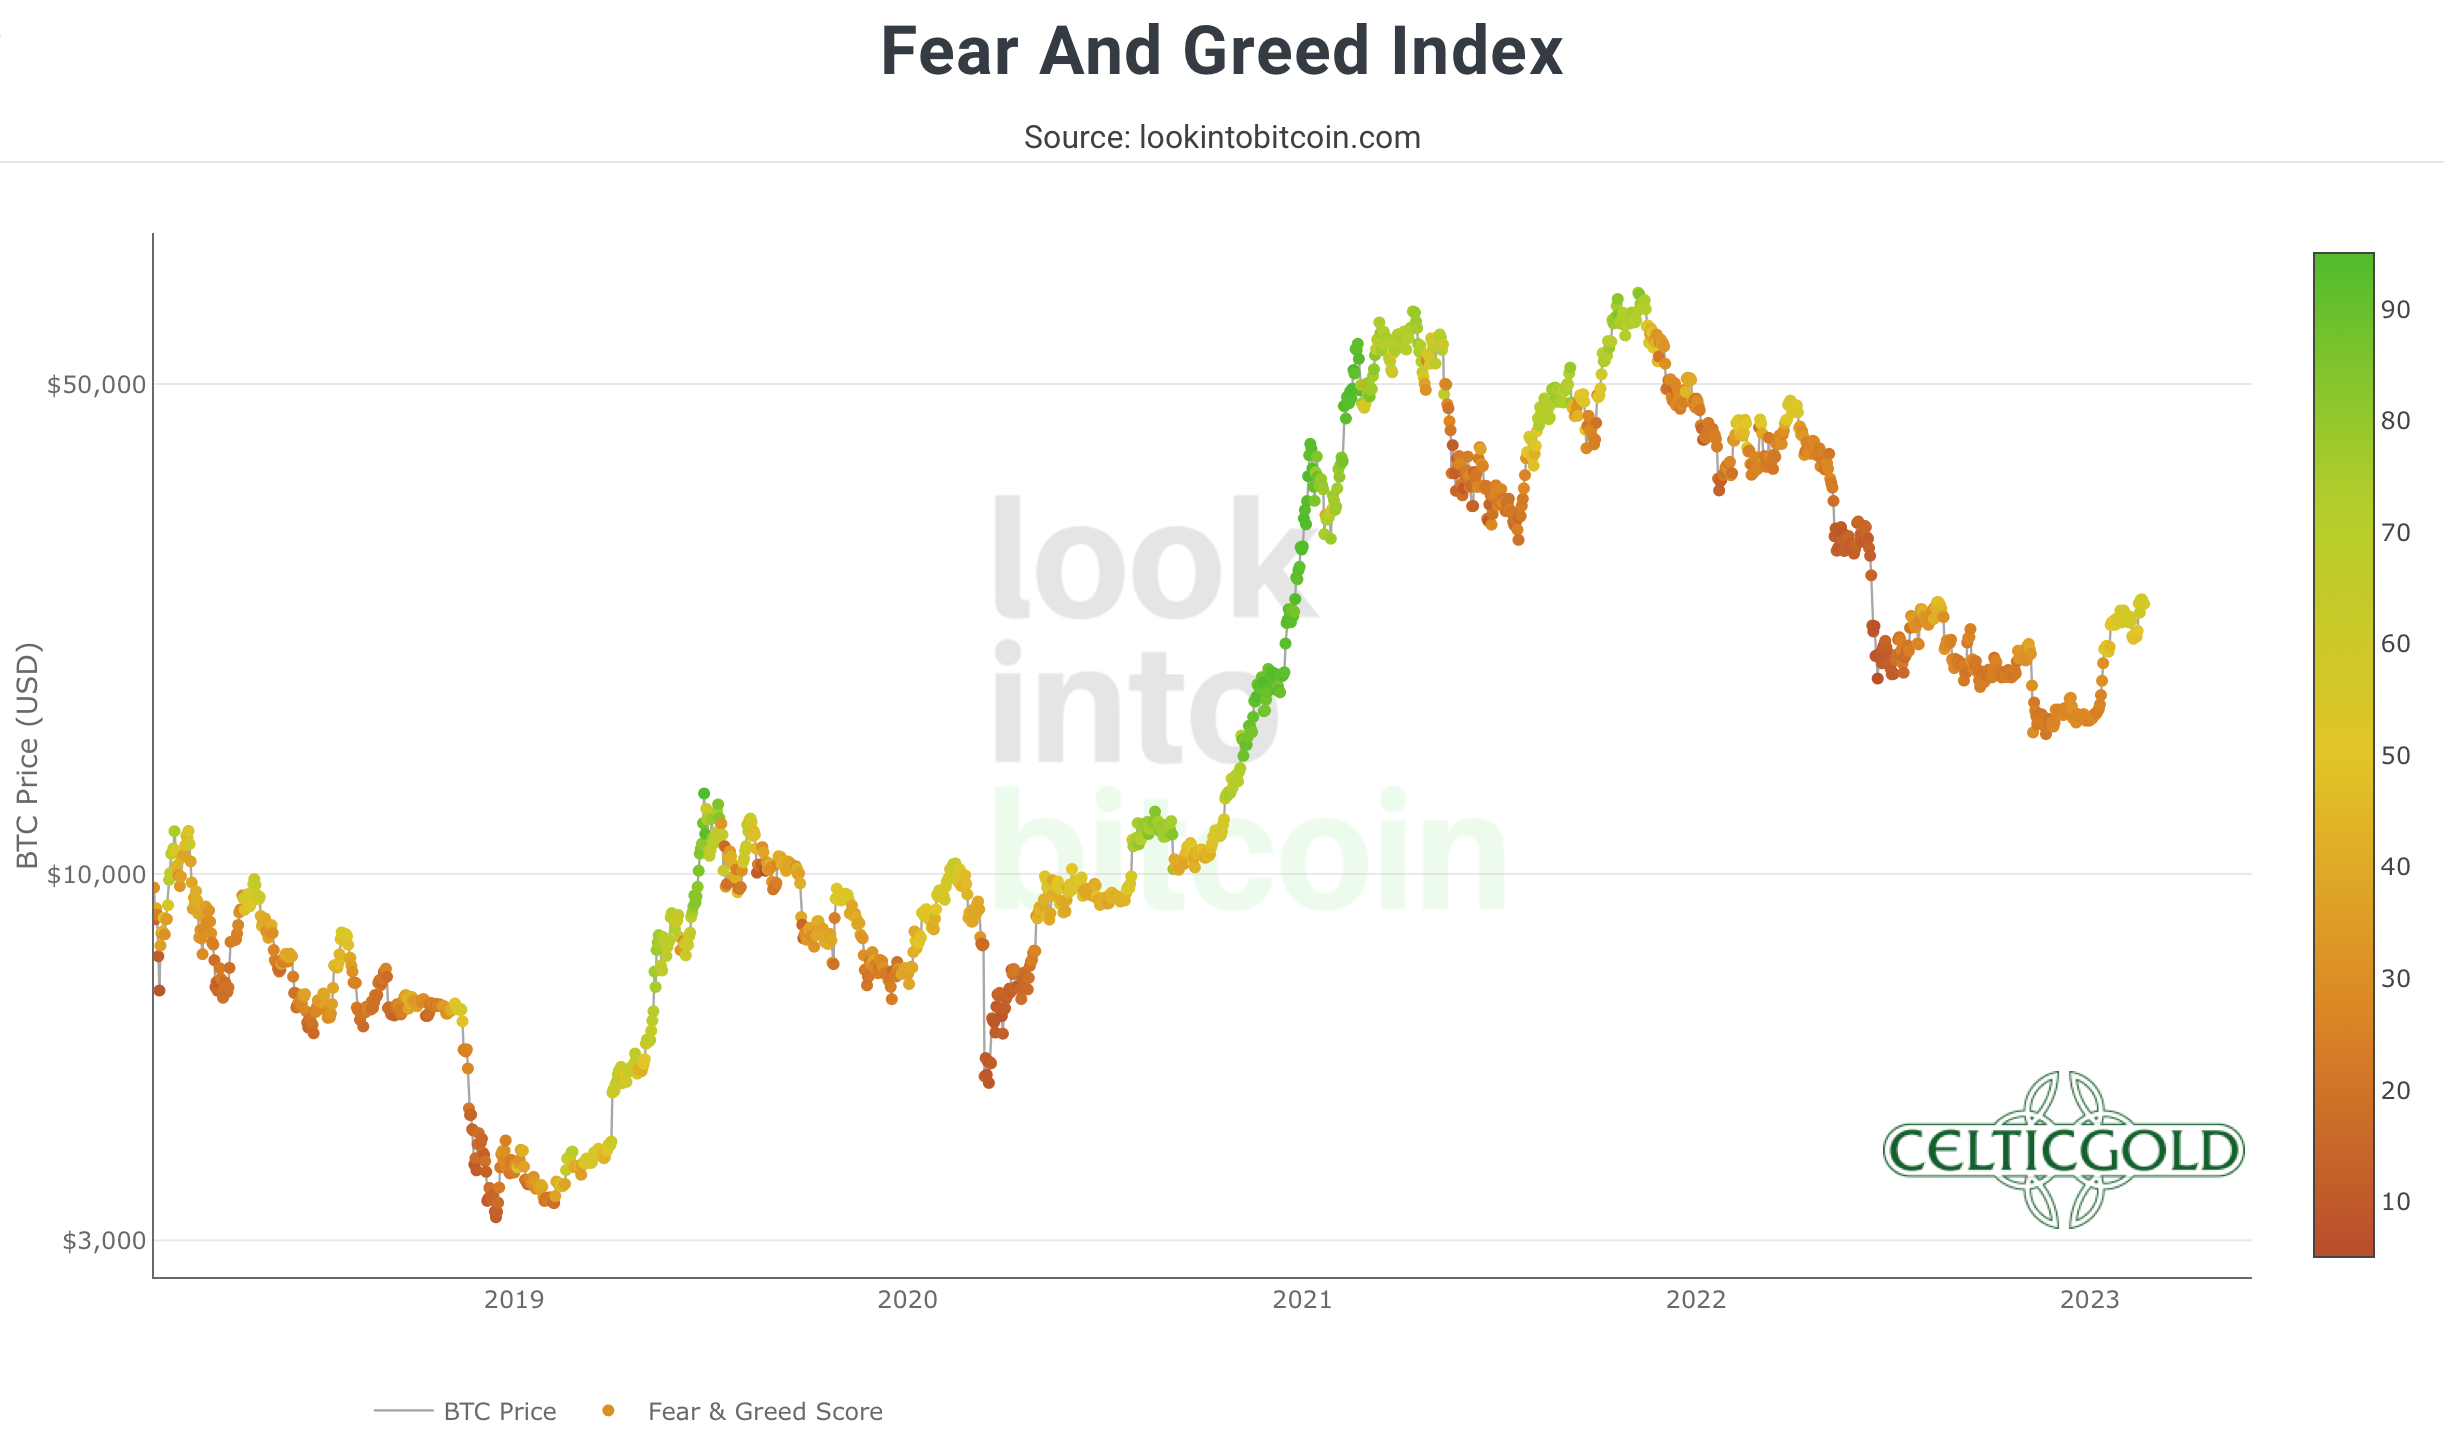 *Crypto Fear & Greed Index long term, as of February 20th, 2023. Source: Lookintobitcoin* Despite the current improvement, there is still room for more optimism and greed, as past experiences have shown that even during a recovery rally the sentiment index can reach levels in the 75 to 90 range before reversing. However, negative comments regarding Bitcoin continue to flood social media, revealing a deep-rooted hatred for the cryptocurrency that could provide unexpected upside potential in the coming weeks. Overall, there is currently no opportunity for any contrarian buying. However, the crypto sector is far from experiencing euphoria or exuberant optimism, and as a result, there is still potential for upside surprises. #### Seasonality Bitcoin – Still positive until beginning of June 2023 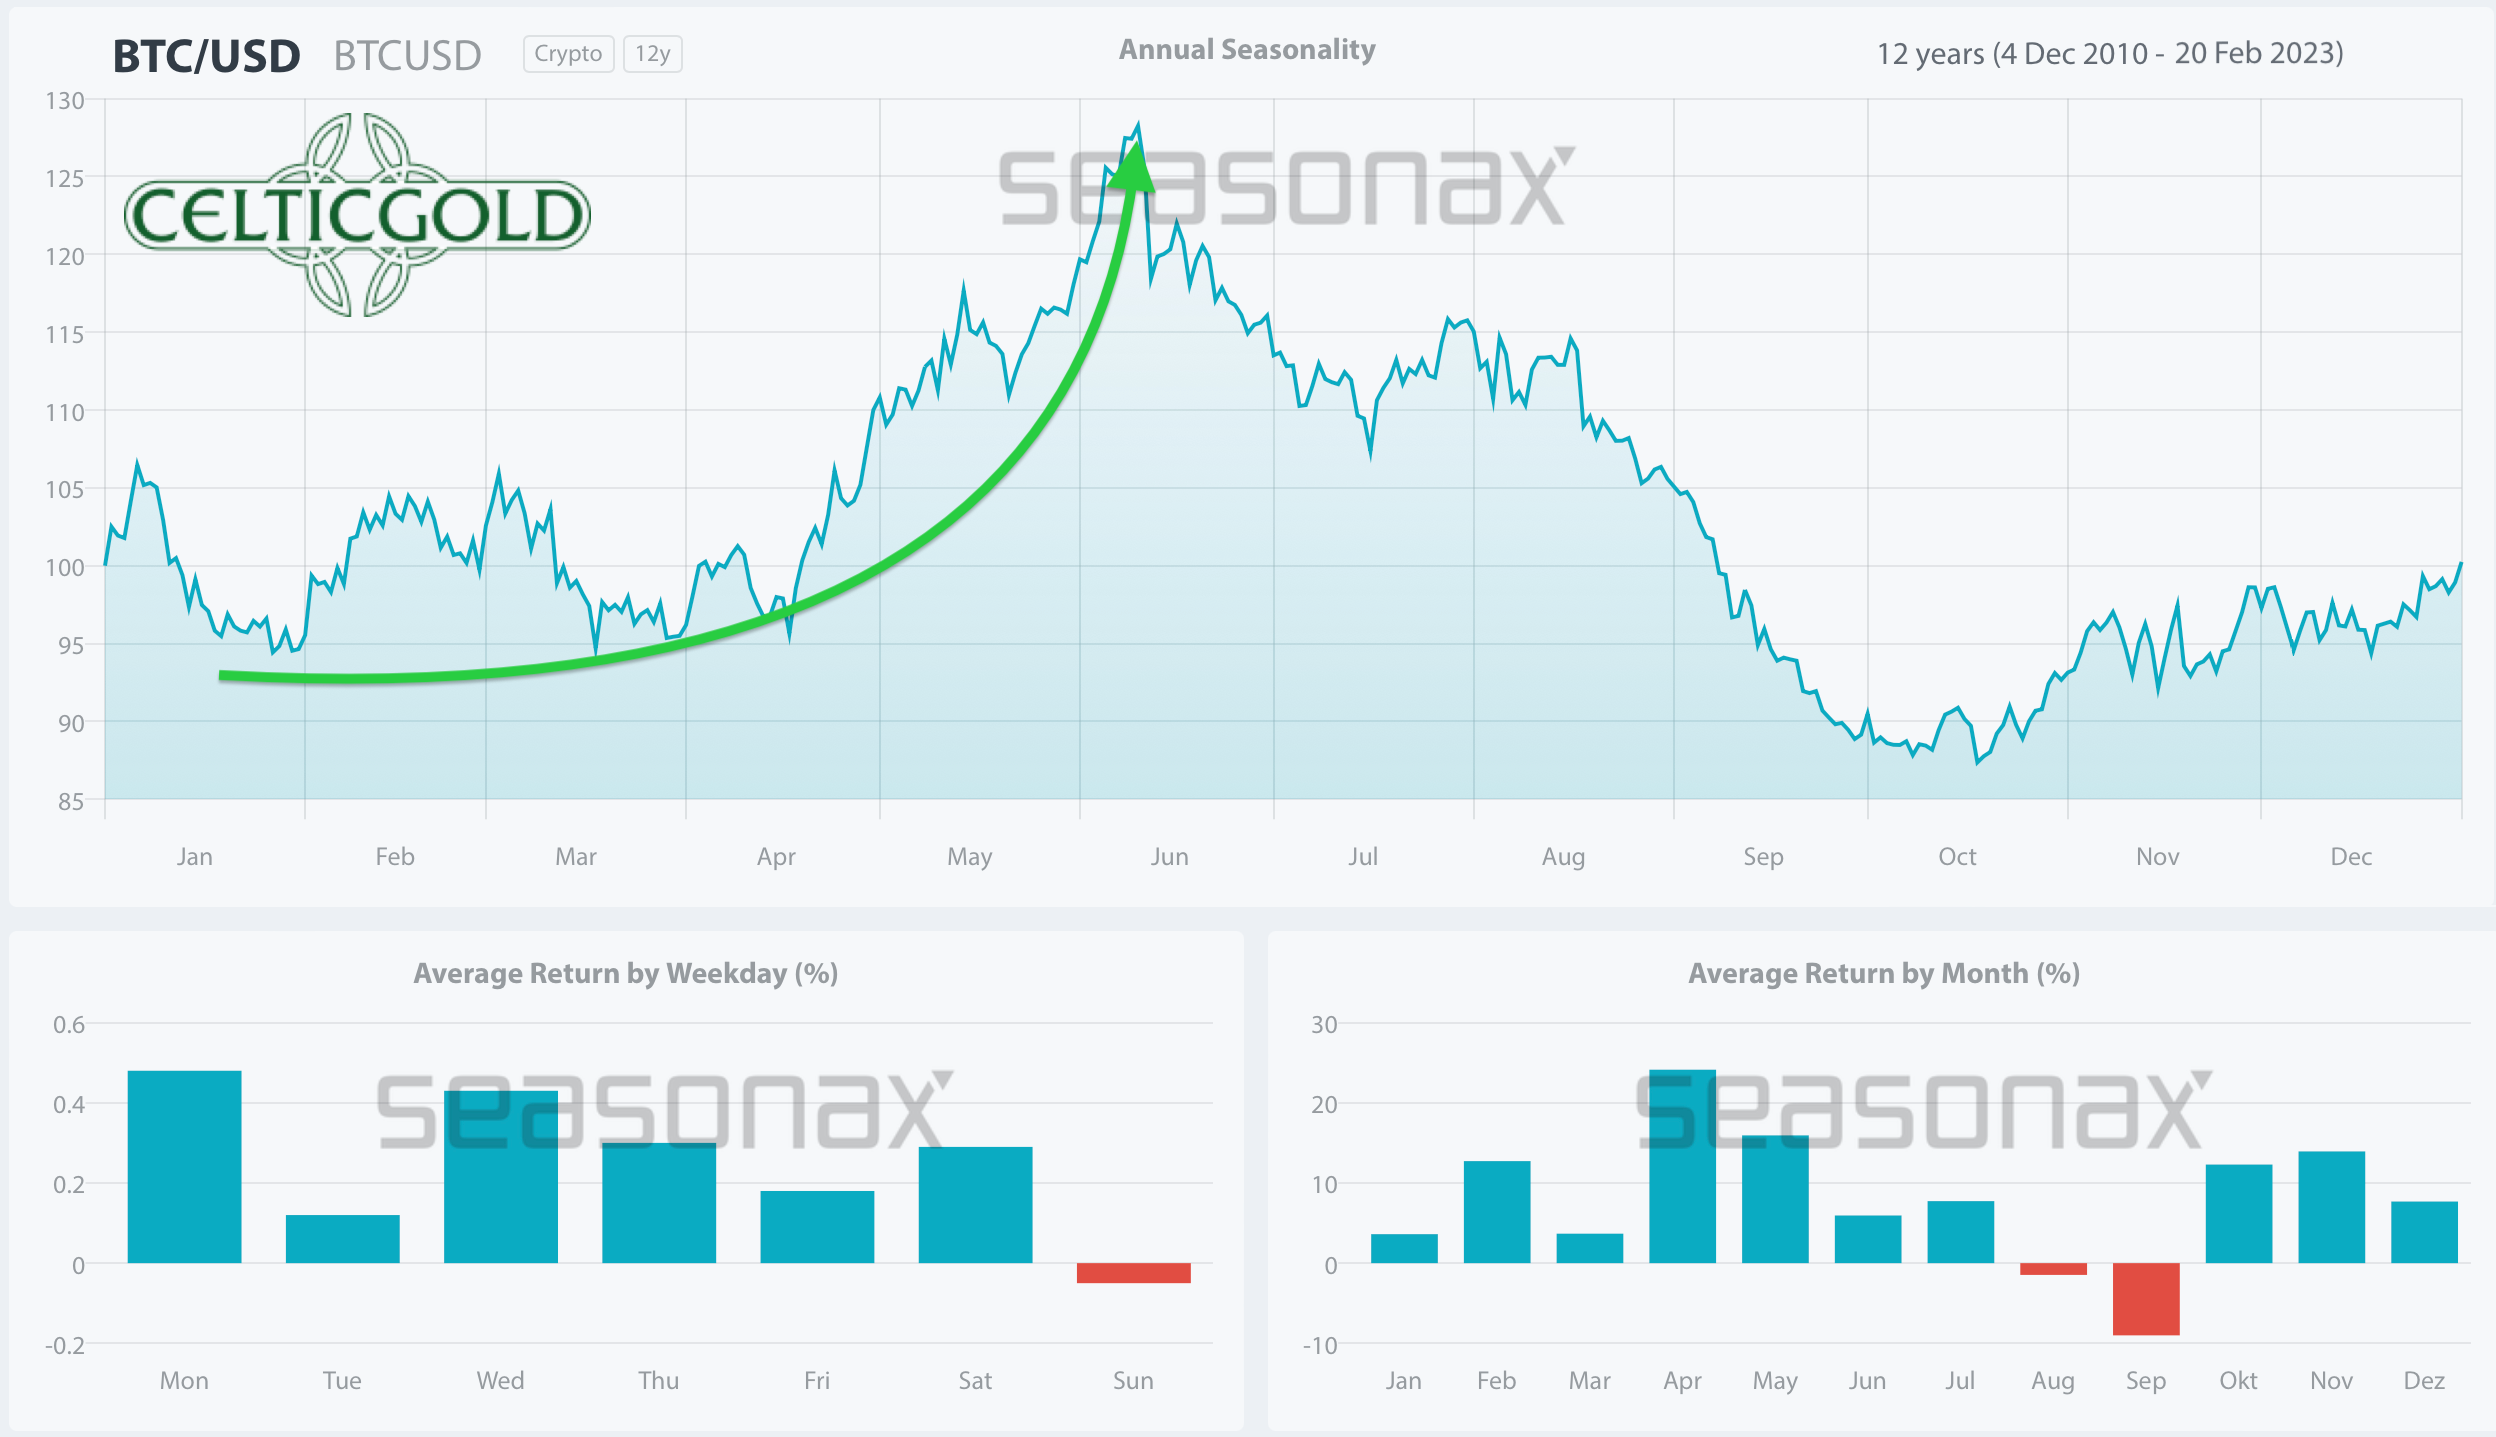 *Seasonality for Bitcoin, as of February 22nd, 2023. Source: Seasonax* Based on the seasonal pattern that developed over the last 12 years, it is likely that Bitcoin will experience two to four more favorable months ahead, indicating an uptrend until early summer at best. ### Sound Money: Bitcoin vs. Gold 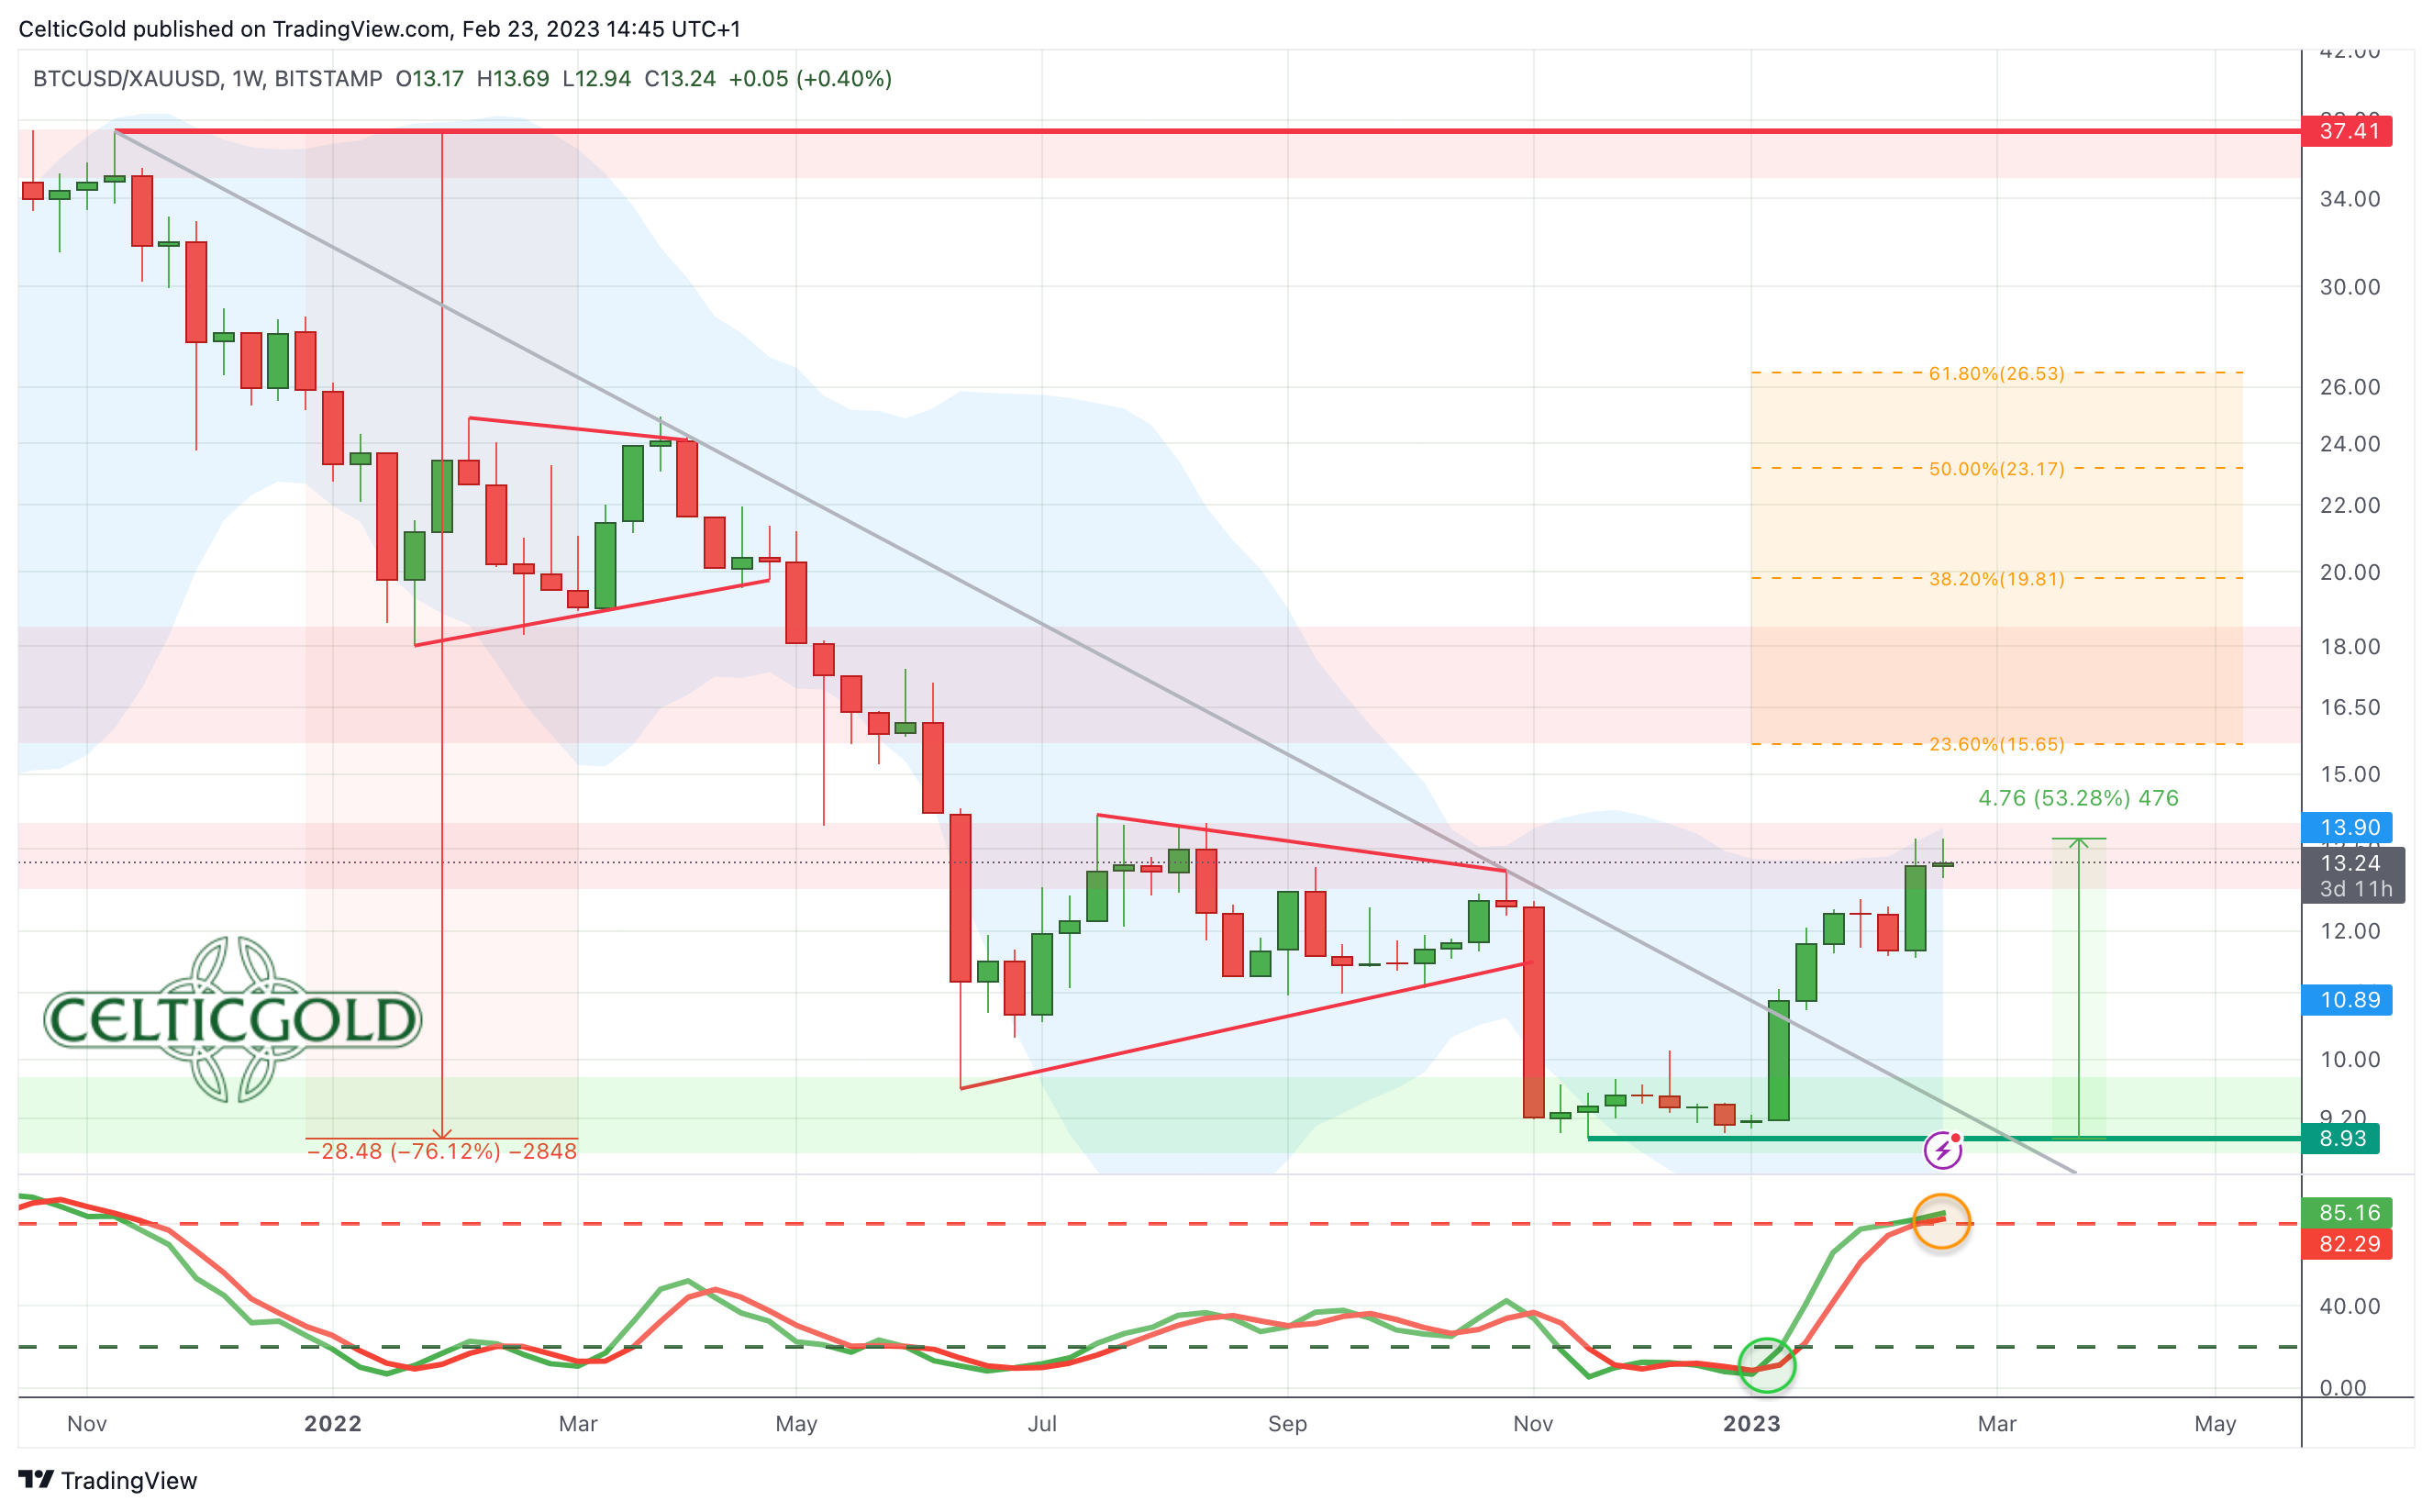 *Bitcoin/Gold-Ratio, weekly chart as of February 23rd, 2023. Source: Tradingview* At current prices of around 24,000 USD for one Bitcoin and around 1,825 USD for one troy ounce of gold, one would have to pay about 13 ounces of gold for one Bitcoin. Stated differently, one troy ounce of gold currently costs about 0.076 Bitcoin. Since its low point on November 21st, Bitcoin has now recovered by around 53% against gold. Furthermore, the Bitcoin/Gold-ratio has broken clearly above its thirteen-month downtrend line and is currently trading in the middle of the first resistance zone between 12.75 and 14. Given the significant trend reversal, the Bitcoin/Gold-ratio should aim for at least the 23.6% retracement of the correction, targeting the area around 15.65 in the coming weeks. Additionally, the normal minimum recovery target in form of the 38.2% retracement is waiting at 19.81. In both cases, the price of gold would lose significantly against Bitcoin. The only small warning signal is the slightly overbought weekly stochastic. In summary, the Bitcoin/Gold-ratio has been clearly recovering since the beginning of the year, with much room for further growth. The first minimum target between 13 and 14 has been achieved. If the ratio manages to jump above 14, further price increases in favor of Bitcoin are very likely to follow. ### Macro Update – Extremely unfavorable setup The macro situation remains highly tense and complex. While the broad recovery of the past three to four months has prevented worse outcomes, it has still been difficult to identify the right trends in a timely manner. Although volatility had decreased significantly in both, stock and bond markets, it has been rising again in recent days. 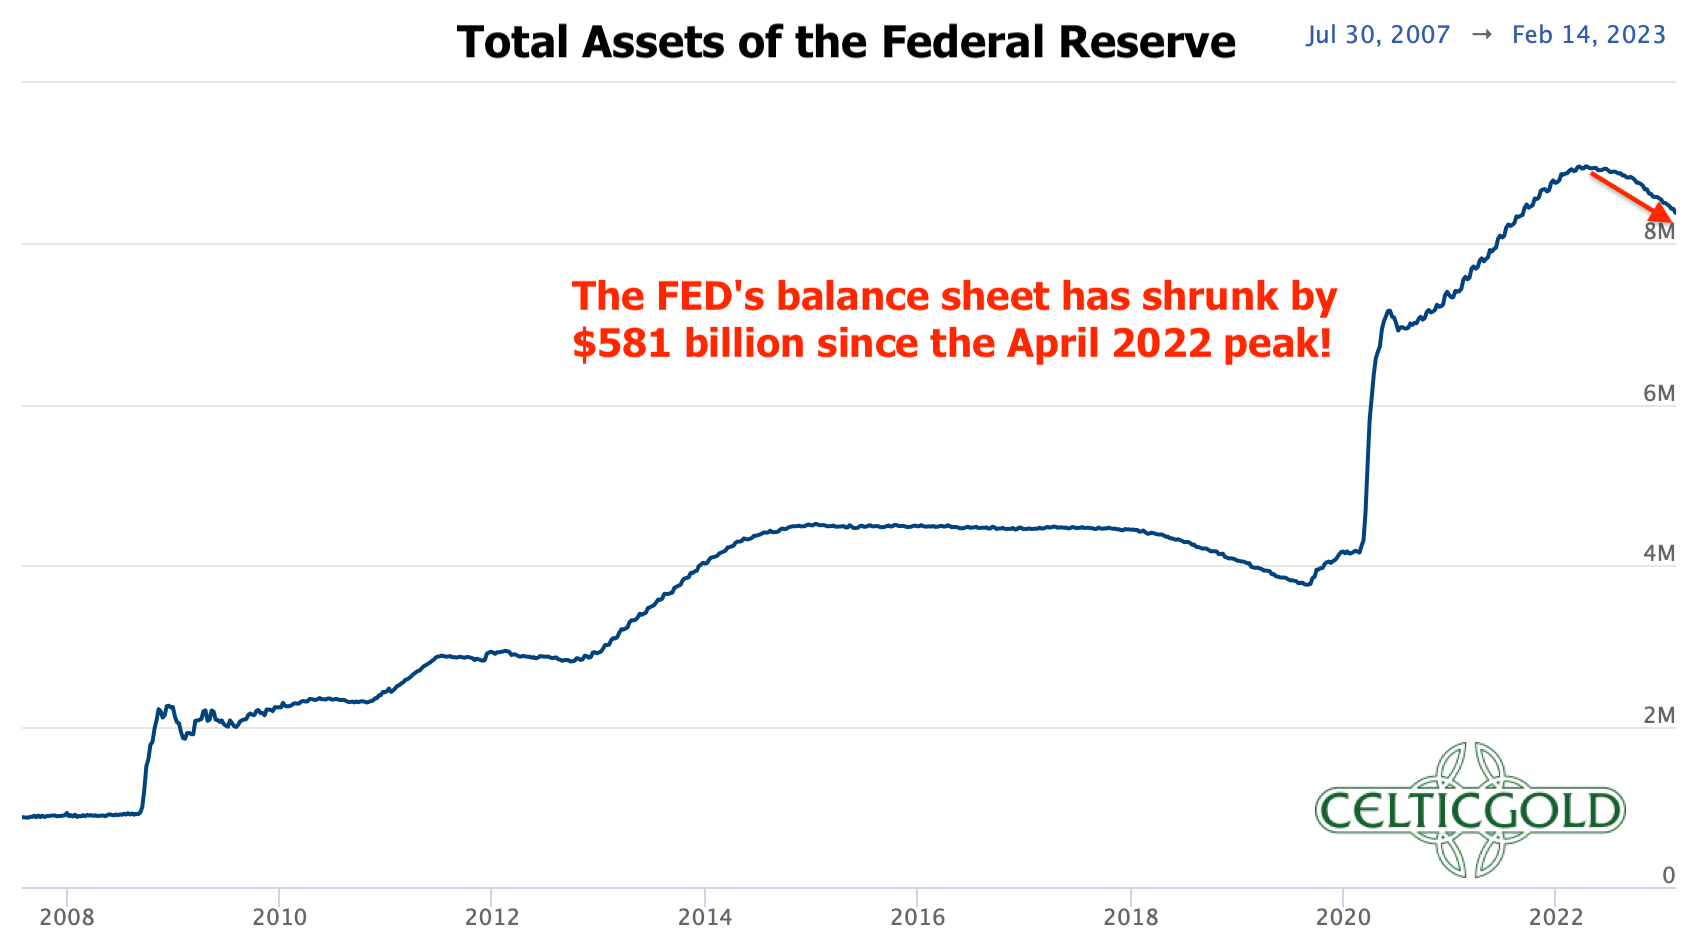 *Total assets of the Federal Reserve as of February 20th, 2023. Source: Federal Reserve* Given the persistently high inflation rates, the markets are currently pricing in a quantitative as well as a temporal extension of the interest rate hike policy, and expect the US interest rates to be in a range of 5.25-5.50% by mid-June. This would make the most aggressive interest rate hike cycle in history already one year old. In the past, it usually took about 12 to 15 months before financial markets encountered serious difficulties and real economies collapsed. Therefore, it could become uncomfortable again from midsummer onwards. Bitcoin will not be able to escape such stress in the markets. 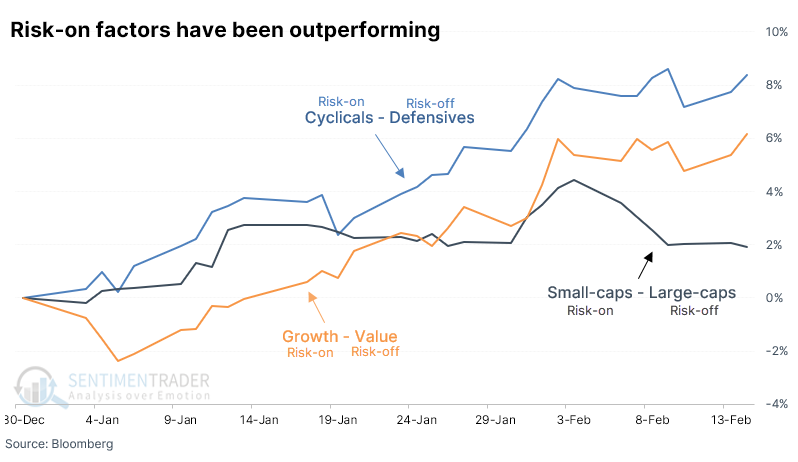 *Risk-on factors have been outperforming as of February 22nd, 2023. Source: Sentimentrader* In the first 30 days of 2023 though, risk-on factors have demonstrated a clear outperformance over risk-off factors. This was evidenced by the remarkable difference between multiple factors, which was the second-largest of any year since 1950. Notably, during years of risk-on factor outperformance, forward returns were consistently positive. As an example, investors have favored cyclical stocks over defensive stocks, small-caps over large-caps, and growth over value, as demonstrated by the Nasdaq’s significant outperformance relative to the Dow. #### Escalating geopolitics as only warmongers set the tone Besides the question of how much the global real economy will be damaged by the most aggressive interest rate hikes of all time and the upcoming balance sheet reductions, the war in Ukraine remains another major uncertainty. Although China is trying to initiate bilateral peace talks, the question of who is responsible for the war already slows down any reconciliation efforts. Russia and China have successfully advocated for their version of the war and who is responsible for it with some countries in recent months. Furthermore, China will certainly not back away from its close relationship with Russia. On the other side, the US and the North Atlantic Treaty Organization (NATO) significantly influenced by the US, are trying to maintain morale and provide more arms. Although the fronts are more than hardened and diplomacy is practically non-existent, one can only hope that the situation does not escalate further. #### Bitcoin is undervalued For Bitcoin, the development in Ukraine is not decisive at first glance. Rather, the liquidity in the global financial system plays a much more important role. However, if the stock markets come under pressure due to further escalation of the war, Bitcoin is likely to feel the impact. On the other hand, one can argue that speculation has almost completely left Bitcoin and that in the last two months, only diehard or strong hands have been active. 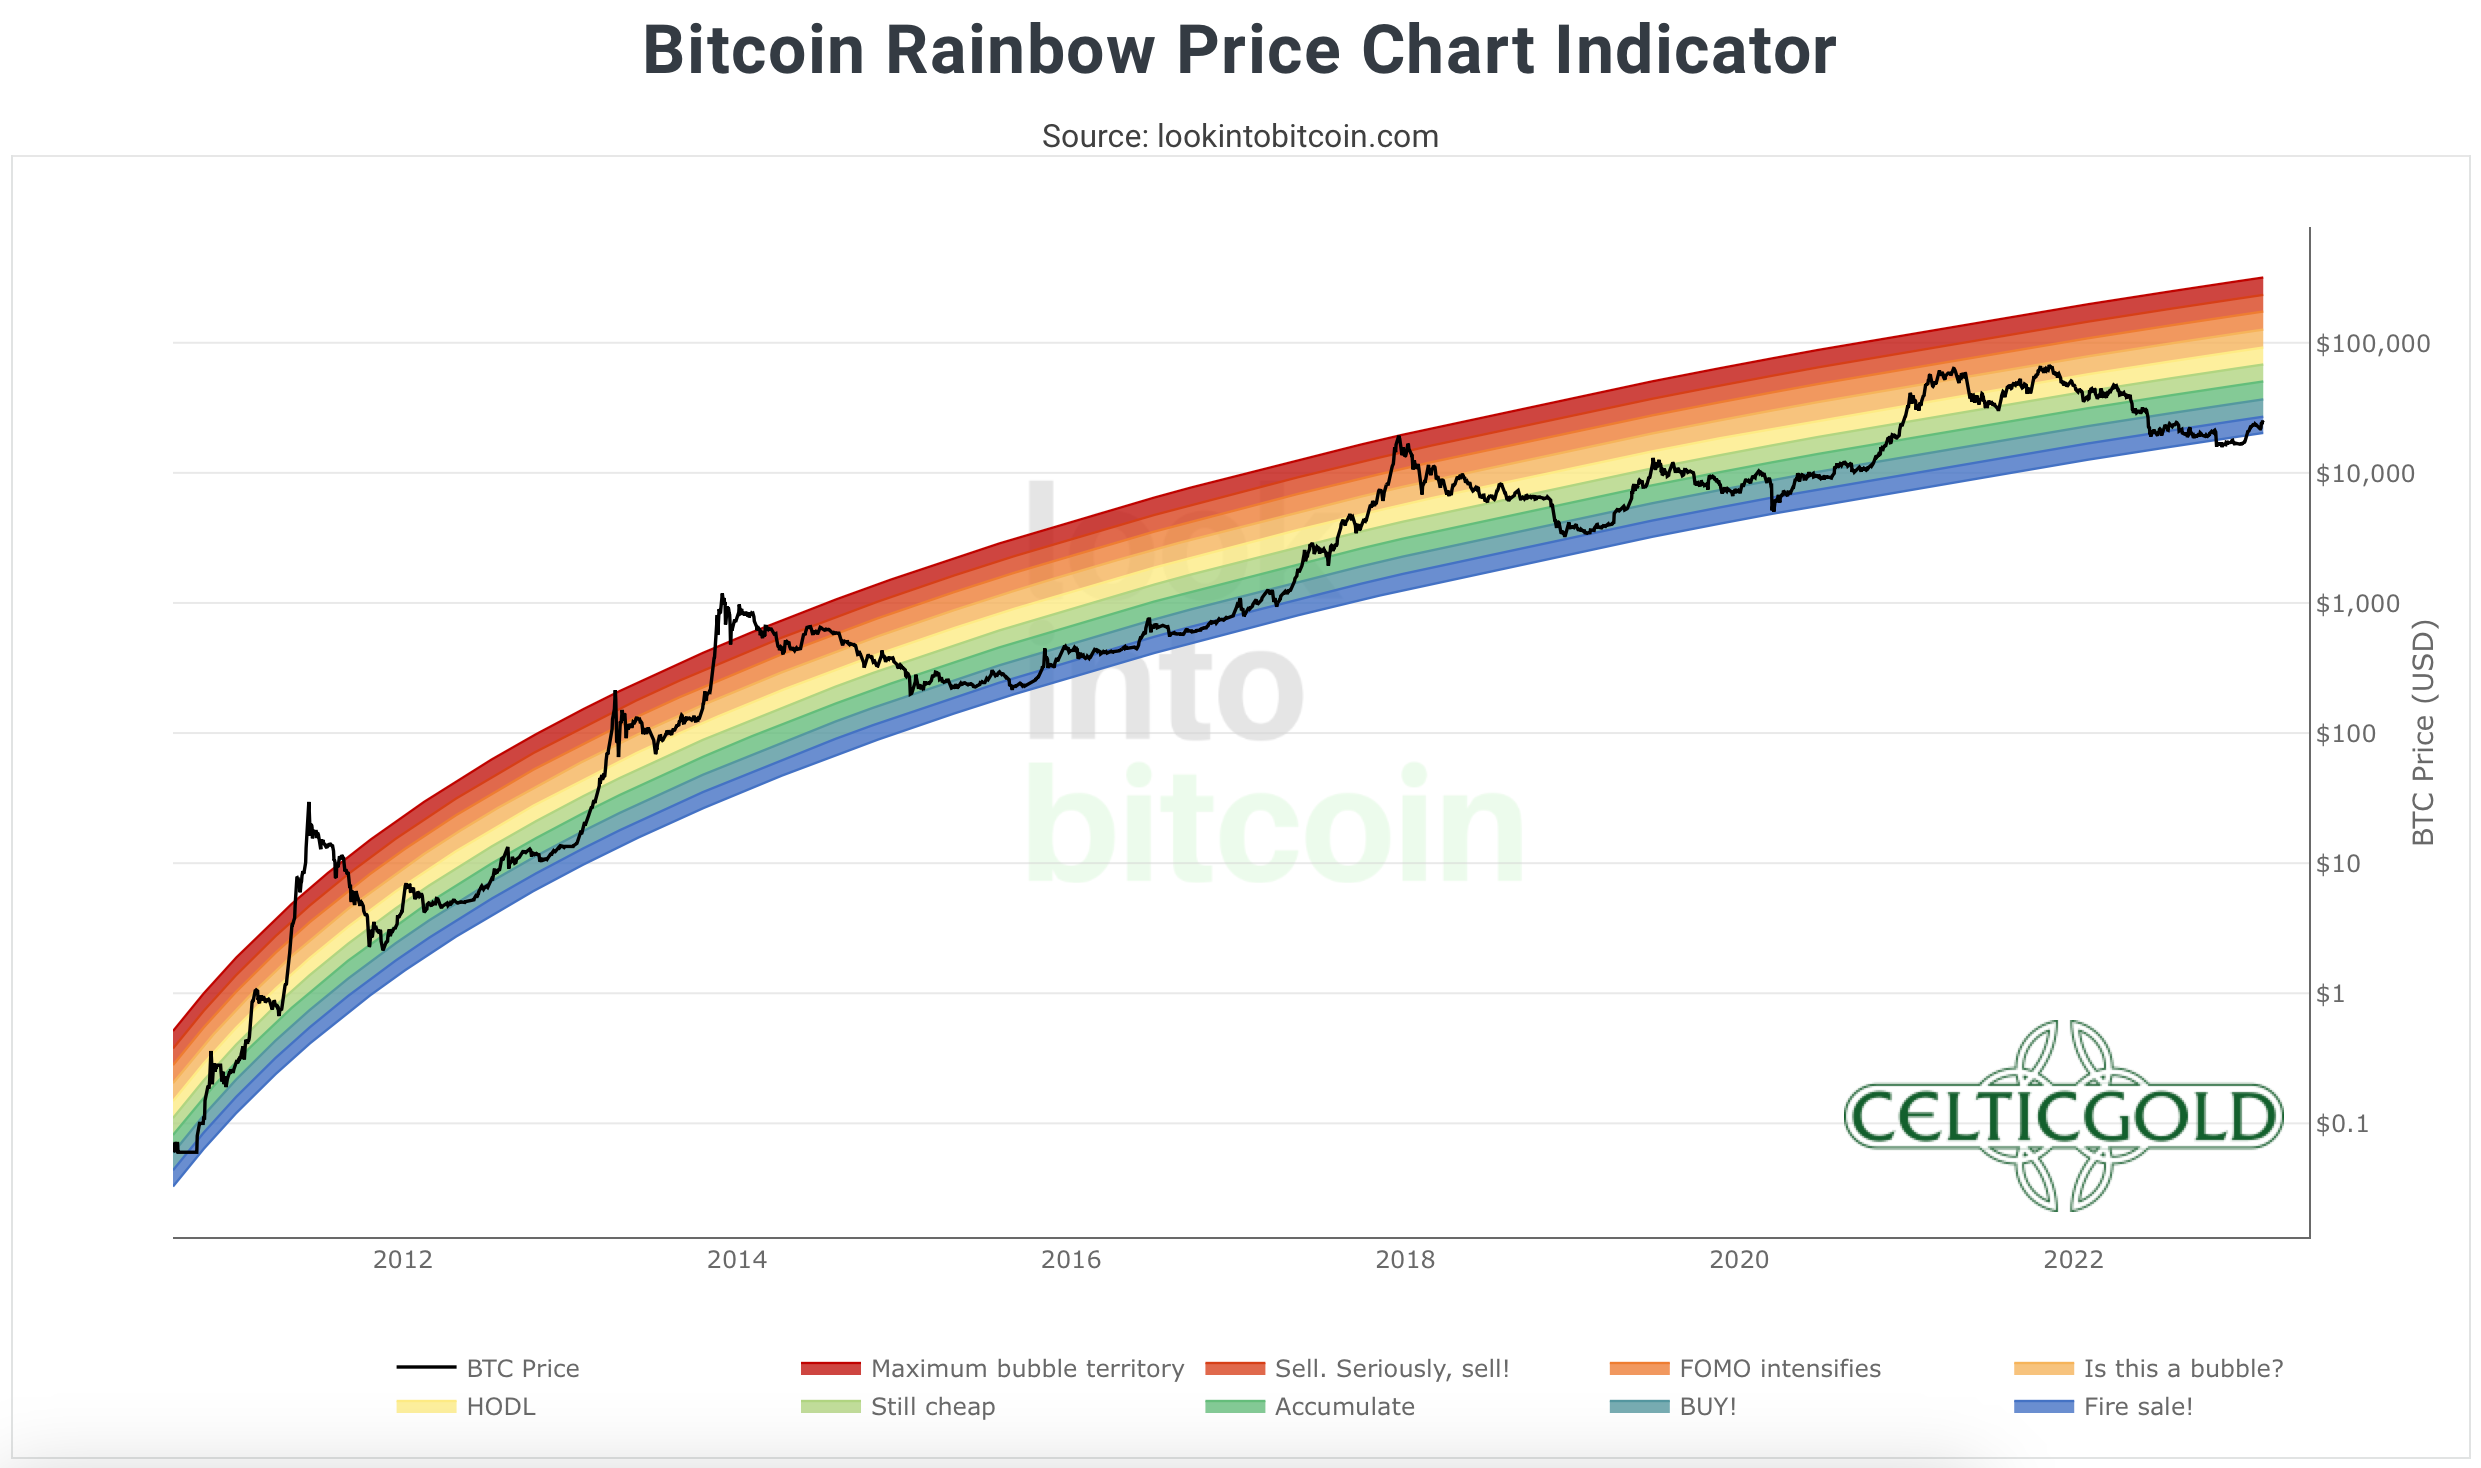 *Bitcoin Rainbow Price Chart Indicator as of February 20th, 2023. Source: Lookintobitcoin* In the big picture, Bitcoin prices around 24,000 USD are still cheap, even though five-digit prices still deter many market participants. One long-term valuation tool for Bitcoin is, for example, the twelve-year Bitcoin Rainbow Chart, which classifies prices below 25,000 USD as a “fire sale.” Of course, there is no guarantee that past performance within the rainbow channel will continue in the future, but currently Bitcoin is trading about 65% below its all-time high. ### Conclusion: Bitcoin – Next target 30,000 USD In the past few days, Bitcoin has bounced off the 25,000 USD mark three times. As long as the pullbacks can hold above 23,500 USD, a breakout towards around 30,000 USD is the most likely scenario from a technical perspective. At the same time, the restrictive monetary policies of central banks hang over the markets like a sword of Damocles. As a highly speculative asset, Bitcoin is unlikely to escape the stress that is expected to return to financial markets later in the year. Therefore, we are cautiously optimistic in the short term, specifically in the coming weeks. Depending on how strong the short squeeze is after the expected breakout above 25,000 USD, price targets of 30,000 USD, 35,000 USD, and even 50,000 USD are possible in spring or early summer. However, we would not venture out of cover for too long at the moment and instead continue to pursue a defensive approach. Only when market turbulences are forcing central banks to radically reverse their monetary policies will Bitcoin and precious metals have their moment to shine. Until then, it is advisable to proceed with caution and take things one step at a time. --------------------- _Analysis sponsored and initially published on February 22nd, 2023, by [www.celticgold.eu](https://celticgold.de/blog/gold-und-bitcoin-analysen-von-florian-grummes-32/bitcoin-deutliche-erholung-zu-erwarten-204). Translated into English and partially updated on February 23rd, 2023._ _Feel free to join us in our free [Telegram channel](https://t.me/MidasTouchConsulting) for daily real time data and a great community._ _If you like to get regular updates on our gold model, precious metals, commodities, and cryptocurrencies you can subscribe to our [free newsletter](http://bit.ly/1EUdt2K)._ _Disclosure: This article and the content are for informational purposes only and do not contain investment advice or recommendations. Every investment and trading move involves risk, and readers should conduct their own research when making a decision. The views, thoughts and opinions expressed here are the author’s alone. They do not necessarily reflect or represent the views and opinions of Midas Touch Consulting._ |
| json metadata | {"tags":["leofinance","bitcoin","steemitcryptoacademy","ethereum","cryptocurrency","investing","trading","gold"],"image":["https://cdn.steemitimages.com/DQmZntXw1JT1zkWmSUstf8z15qQYD5hKc2QQdHHSsHXB1QX/celtic-gold-midas-touch-bitcoin-update-header.jpg","https://cdn.steemitimages.com/DQmaS4i1SDq7pzDSCXkVBTdAZdxZt6X68C71fe9kHEKcQBB/Chart%2001%20Performance%20Chart%20220223.png","https://cdn.steemitimages.com/DQmVAK3G9Y6FgVnQ8bbSo5tiAS77JktsN6MBCKnUpeswdPf/Chart%2002%20Bitcoin%20weekly%20chart%20230223.png","https://cdn.steemitimages.com/DQmWCuvLwykZzg5QYKJwtNA8S81yEgMkghmGK7ZcDDh6cdi/Chart%2003%20Bitcoin%20daily%20chart%20230223.png","https://cdn.steemitimages.com/DQmYMh97cbXJfQcu9oyVxENm6EKHoxoJ8TU6G3wahuyt3MU/Chart%2004%20Crypto%20Fear%20&%20Greed%20Index%20220223.png","https://cdn.steemitimages.com/DQmar4gZS6g5r9WU64RqwNRL5otZvSeWYtWkcdPigEXKihy/Chart%2005%20Crypto%20Fear%20&%20Greed%20Index%20200223.png","https://cdn.steemitimages.com/DQmR9UPnLVGQceTsqyY5bmrVSVoYtNFzaoCW2gDz8udjenG/Chart%2006%20Bitcoin%20seasonality%20220223.png","https://cdn.steemitimages.com/DQmarLhGVUWtDMsFB3eaGYLjEVciPKFYFr2rcKKKNzT3uZm/Chart%2007%20Bitcoin:Gold-Ratio%20230223.png","https://cdn.steemitimages.com/DQmNVhMgJHiuDmqfifgQPWz1xA8x8vHz5hdNubaCEuvTvi7/Chart%2008%20Fed%20Balance%20sheet%20130222.png","https://cdn.steemitimages.com/DQmQaBGa3RzZRefMYpiYWqGDYAcCH2xRsCEXnqPRgcxnjxV/Chart%2009%20Risk-on%20factors%20have%20greatly%20outperformed%20220223.png","https://cdn.steemitimages.com/DQmXyU2qcx5A7PDHyjQjMft3KkEWEeyygTiamMG68n5qn8c/Chart%2010%20Bitcoin%20Rainbow%20Price%20Chart%20Indicator%20200223.png"],"links":["https://www.midastouch-consulting.com/23022023-bitcoin-next-target-30000-usd","https://celticgold.de/blog/gold-und-bitcoin-analysen-von-florian-grummes-32/bitcoin-deutliche-erholung-zu-erwarten-204","https://t.me/MidasTouchConsulting","http://bit.ly/1EUdt2K"],"app":"steemit/0.2","format":"markdown"} |
| parent author | |
| parent permlink | leofinance |
| permlink | february-23rd-2023-bitcoin-next-target-30-000-usd |
| title | February 23rd, 2023, Bitcoin – Next target 30,000 USD |
| Transaction Info | Block #72353965/Trx b6b3e65f13f8eb71d8e79f96997ed396658b3d43 |
View Raw JSON Data
{
"block": 72353965,
"op": [
"comment",
{
"author": "midastouch",
"body": " \n\n# [February 23rd, 2023, Bitcoin – Next target 30,000 USD](https://www.midastouch-consulting.com/23022023-bitcoin-next-target-30000-usd) \n\nIn the first few weeks of 2023, Bitcoin’s price has continued its upward trajectory, fueled by growing institutional adoption and increased investor confidence in the cryptocurrency market. Despite some short-term volatility, Bitcoin has remained above key support levels and is on track to recover further. As more traditional financial institutions enter the space and new use cases for blockchain and web3 technology emerge, the outlook for Bitcoin and the wider cryptocurrency market remains positive. Bitcoin – Next target 30,000 USD.\n\n### Review\n\nThe new trading year started on a high note for Bitcoin. Beginning from prices hovering around 16,500 USD, the market saw a nearly 53% increase in the last seven and a half weeks, catching many market participants off guard who had previously exited or were underinvested. This surge may have been further fueled by short sellers covering their short positions.\n\nIn December and January, we had already identified and laid out the case for a significant recovery and foreseeable upward momentum. Our recovery scenario predicting prices of at least 35,000 USD remains unchanged, with our first price target of 25,000 USD having been reached on February 16th.\n\n\n*Performance Bitcoin vs. Ethereum vs. stocks vs. gold since 1st of October 2022, as of February 23rd, 2023. Source: Tradingview.*\n\nDespite showing improvement since the start of the year, Bitcoin and the broader crypto sector still face challenges and are somewhat reliant on overall market trends. While stock markets and precious metals have experienced significant recoveries over the past four months, Bitcoin has yet to fully catch up, indicating further upside potential.\n\n#### Restrictive central bank policies remain a big burden\n\nHowever, the current fundamental setup for financial markets remains uncertain and complex due to the Federal Reserve and European Central Bank’s aggressive interest rate hikes and balance sheet reductions. Though equities and precious metals have shown a rally beyond what is typical of a bear market, the restrictive policies of central banks continue to pose a significant burden on the markets, with growing concerns that this issue has been increasingly ignored in recent months.\n\nMeanwhile, the recent pullback in the gold price following an impressive recovery rally over the past months and the U.S. dollar’s slight gain since February also present challenges for the market.\n\n### Technical Analysis for Bitcoin in US-Dollar\n\n#### Bitcoin Weekly Chart – Stabilization Following the First Breakout\n\n\n*Bitcoin in USD, weekly chart as of February 23rd, 2023. Source: Tradingview*\n\nBitcoin’s weekly chart reveals a notable stabilization following the first breakout above 22,700 USD in mid-January. This move was Bitcoin’s first answer to the severe fourteen months long correction of -77.5%. Although gains on the upside have been moderate thus far, the overall picture has stabilized significantly.\n\nThe chart also indicates that Bitcoin is likely to recover towards one of the classic retracement levels of the previous correction. Hence, the potential levels are at 28,109 USD (23.6%), 35,924 USD (38.2%), and 48,554 USD (61.8%). Even if the stochastic oscillator initially turns down from its overbought zone, the former downtrend line in the range of 20,500 USD is expected to withstand another test.\n\nOverall, the bullish weekly chart suggests a rise in the direction of approximately 28,000 USD. However, the bulls need to increase their momentum and bend up the upper Bollinger Band (25,298 USD). Only successful breach of this resistance level may result in a rapid ascent towards 30,000 USD and beyond.\n\n#### Bitcoin Daily Chart – When will Bitcoin break out above 25,250 USD?\n\n\n*Bitcoin in USD, daily chart as of February 23rd, 2023. Source: Tradingview*\n\nOn the daily chart, Bitcoin’s first bounce from the correction low of 15,479 USD on November 21st reached 18,373 USD. Using the Fibonacci extensions on this initial wave-up, we can create a rough roadmap for the further recovery. Currently, Bitcoin has reached the 1.618% and 2.618% extensions, with the 3.618% extension at 26,750 USD being the next logical step.\n\nIn the short term, Bitcoin’s prices have been running against the 25,000 USD mark for several days, with pullbacks not causing any significant downside damage thus far. Holding the support around 23,500 USD potentially creates a small ascending triangle. Since short sellers still outnumber the bulls, a sustained breakout above 25,250 USD could quickly trigger another sharp wave-up, pushing Bitcoin towards about 30,000 USD.\n\nIn summary, the daily chart indicates a bullish trend, and an imminent breakout above 25,250 USD is likely. Only the slightly overbought stochastic oscillator appears unfavorable, as it has yet to transform itself into the rare and super bullish embedded state (= both signal lines sitting above 80 for at least three trading days). Generally, as long as prices remain above 23,500 USD and, more importantly, above 22,500 USD, the imminent recovery scenario remains intact.\n\n### Sentiment Bitcoin – Next target 30,000 USD\n\n\n*Crypto Fear & Greed Index, as of February 22nd, 2023. Source: Lookintobitcoin*\n\nAs the crypto sector continues its significant recovery, the sentiment within the market has become more confident and optimistic. The Crypto Fear & Greed Index, which measures the emotions amongst the market participants, has risen to a value of 59, indicating a slight “greed state”.\n\n\n*Crypto Fear & Greed Index long term, as of February 20th, 2023. Source: Lookintobitcoin*\n\nDespite the current improvement, there is still room for more optimism and greed, as past experiences have shown that even during a recovery rally the sentiment index can reach levels in the 75 to 90 range before reversing. However, negative comments regarding Bitcoin continue to flood social media, revealing a deep-rooted hatred for the cryptocurrency that could provide unexpected upside potential in the coming weeks.\n\nOverall, there is currently no opportunity for any contrarian buying. However, the crypto sector is far from experiencing euphoria or exuberant optimism, and as a result, there is still potential for upside surprises.\n\n#### Seasonality Bitcoin – Still positive until beginning of June 2023\n\n\n*Seasonality for Bitcoin, as of February 22nd, 2023. Source: Seasonax*\n\nBased on the seasonal pattern that developed over the last 12 years, it is likely that Bitcoin will experience two to four more favorable months ahead, indicating an uptrend until early summer at best.\n\n### Sound Money: Bitcoin vs. Gold\n\n\n*Bitcoin/Gold-Ratio, weekly chart as of February 23rd, 2023. Source: Tradingview*\n\nAt current prices of around 24,000 USD for one Bitcoin and around 1,825 USD for one troy ounce of gold, one would have to pay about 13 ounces of gold for one Bitcoin. Stated differently, one troy ounce of gold currently costs about 0.076 Bitcoin.\n\nSince its low point on November 21st, Bitcoin has now recovered by around 53% against gold. Furthermore, the Bitcoin/Gold-ratio has broken clearly above its thirteen-month downtrend line and is currently trading in the middle of the first resistance zone between 12.75 and 14.\n\nGiven the significant trend reversal, the Bitcoin/Gold-ratio should aim for at least the 23.6% retracement of the correction, targeting the area around 15.65 in the coming weeks. Additionally, the normal minimum recovery target in form of the 38.2% retracement is waiting at 19.81. In both cases, the price of gold would lose significantly against Bitcoin.\n\nThe only small warning signal is the slightly overbought weekly stochastic.\n\nIn summary, the Bitcoin/Gold-ratio has been clearly recovering since the beginning of the year, with much room for further growth. The first minimum target between 13 and 14 has been achieved. If the ratio manages to jump above 14, further price increases in favor of Bitcoin are very likely to follow.\n\n### Macro Update – Extremely unfavorable setup\n\nThe macro situation remains highly tense and complex. While the broad recovery of the past three to four months has prevented worse outcomes, it has still been difficult to identify the right trends in a timely manner. Although volatility had decreased significantly in both, stock and bond markets, it has been rising again in recent days.\n\n\n*Total assets of the Federal Reserve as of February 20th, 2023. Source: Federal Reserve*\n\nGiven the persistently high inflation rates, the markets are currently pricing in a quantitative as well as a temporal extension of the interest rate hike policy, and expect the US interest rates to be in a range of 5.25-5.50% by mid-June. This would make the most aggressive interest rate hike cycle in history already one year old. In the past, it usually took about 12 to 15 months before financial markets encountered serious difficulties and real economies collapsed. Therefore, it could become uncomfortable again from midsummer onwards. Bitcoin will not be able to escape such stress in the markets.\n\n\n*Risk-on factors have been outperforming as of February 22nd, 2023. Source: Sentimentrader*\n\nIn the first 30 days of 2023 though, risk-on factors have demonstrated a clear outperformance over risk-off factors. This was evidenced by the remarkable difference between multiple factors, which was the second-largest of any year since 1950. Notably, during years of risk-on factor outperformance, forward returns were consistently positive. As an example, investors have favored cyclical stocks over defensive stocks, small-caps over large-caps, and growth over value, as demonstrated by the Nasdaq’s significant outperformance relative to the Dow.\n\n#### Escalating geopolitics as only warmongers set the tone\n\nBesides the question of how much the global real economy will be damaged by the most aggressive interest rate hikes of all time and the upcoming balance sheet reductions, the war in Ukraine remains another major uncertainty. Although China is trying to initiate bilateral peace talks, the question of who is responsible for the war already slows down any reconciliation efforts. Russia and China have successfully advocated for their version of the war and who is responsible for it with some countries in recent months. Furthermore, China will certainly not back away from its close relationship with Russia.\n\nOn the other side, the US and the North Atlantic Treaty Organization (NATO) significantly influenced by the US, are trying to maintain morale and provide more arms. Although the fronts are more than hardened and diplomacy is practically non-existent, one can only hope that the situation does not escalate further.\n\n#### Bitcoin is undervalued\n\nFor Bitcoin, the development in Ukraine is not decisive at first glance. Rather, the liquidity in the global financial system plays a much more important role. However, if the stock markets come under pressure due to further escalation of the war, Bitcoin is likely to feel the impact. On the other hand, one can argue that speculation has almost completely left Bitcoin and that in the last two months, only diehard or strong hands have been active.\n\n\n*Bitcoin Rainbow Price Chart Indicator as of February 20th, 2023. Source: Lookintobitcoin*\n\nIn the big picture, Bitcoin prices around 24,000 USD are still cheap, even though five-digit prices still deter many market participants. One long-term valuation tool for Bitcoin is, for example, the twelve-year Bitcoin Rainbow Chart, which classifies prices below 25,000 USD as a “fire sale.” Of course, there is no guarantee that past performance within the rainbow channel will continue in the future, but currently Bitcoin is trading about 65% below its all-time high.\n\n### Conclusion: Bitcoin – Next target 30,000 USD\n\nIn the past few days, Bitcoin has bounced off the 25,000 USD mark three times. As long as the pullbacks can hold above 23,500 USD, a breakout towards around 30,000 USD is the most likely scenario from a technical perspective.\n\nAt the same time, the restrictive monetary policies of central banks hang over the markets like a sword of Damocles. As a highly speculative asset, Bitcoin is unlikely to escape the stress that is expected to return to financial markets later in the year.\n\nTherefore, we are cautiously optimistic in the short term, specifically in the coming weeks. Depending on how strong the short squeeze is after the expected breakout above 25,000 USD, price targets of 30,000 USD, 35,000 USD, and even 50,000 USD are possible in spring or early summer.\n\nHowever, we would not venture out of cover for too long at the moment and instead continue to pursue a defensive approach. Only when market turbulences are forcing central banks to radically reverse their monetary policies will Bitcoin and precious metals have their moment to shine. Until then, it is advisable to proceed with caution and take things one step at a time.\n\n---------------------\n_Analysis sponsored and initially published on February 22nd, 2023, by [www.celticgold.eu](https://celticgold.de/blog/gold-und-bitcoin-analysen-von-florian-grummes-32/bitcoin-deutliche-erholung-zu-erwarten-204). Translated into English and partially updated on February 23rd, 2023._ \n\n_Feel free to join us in our free [Telegram channel](https://t.me/MidasTouchConsulting) for daily real time data and a great community._ \n\n_If you like to get regular updates on our gold model, precious metals, commodities, and cryptocurrencies you can subscribe to our [free newsletter](http://bit.ly/1EUdt2K)._ \n\n_Disclosure: This article and the content are for informational purposes only and do not contain investment advice or recommendations. Every investment and trading move involves risk, and readers should conduct their own research when making a decision. The views, thoughts and opinions expressed here are the author’s alone. They do not necessarily reflect or represent the views and opinions of Midas Touch Consulting._",
"json_metadata": "{\"tags\":[\"leofinance\",\"bitcoin\",\"steemitcryptoacademy\",\"ethereum\",\"cryptocurrency\",\"investing\",\"trading\",\"gold\"],\"image\":[\"https://cdn.steemitimages.com/DQmZntXw1JT1zkWmSUstf8z15qQYD5hKc2QQdHHSsHXB1QX/celtic-gold-midas-touch-bitcoin-update-header.jpg\",\"https://cdn.steemitimages.com/DQmaS4i1SDq7pzDSCXkVBTdAZdxZt6X68C71fe9kHEKcQBB/Chart%2001%20Performance%20Chart%20220223.png\",\"https://cdn.steemitimages.com/DQmVAK3G9Y6FgVnQ8bbSo5tiAS77JktsN6MBCKnUpeswdPf/Chart%2002%20Bitcoin%20weekly%20chart%20230223.png\",\"https://cdn.steemitimages.com/DQmWCuvLwykZzg5QYKJwtNA8S81yEgMkghmGK7ZcDDh6cdi/Chart%2003%20Bitcoin%20daily%20chart%20230223.png\",\"https://cdn.steemitimages.com/DQmYMh97cbXJfQcu9oyVxENm6EKHoxoJ8TU6G3wahuyt3MU/Chart%2004%20Crypto%20Fear%20&%20Greed%20Index%20220223.png\",\"https://cdn.steemitimages.com/DQmar4gZS6g5r9WU64RqwNRL5otZvSeWYtWkcdPigEXKihy/Chart%2005%20Crypto%20Fear%20&%20Greed%20Index%20200223.png\",\"https://cdn.steemitimages.com/DQmR9UPnLVGQceTsqyY5bmrVSVoYtNFzaoCW2gDz8udjenG/Chart%2006%20Bitcoin%20seasonality%20220223.png\",\"https://cdn.steemitimages.com/DQmarLhGVUWtDMsFB3eaGYLjEVciPKFYFr2rcKKKNzT3uZm/Chart%2007%20Bitcoin:Gold-Ratio%20230223.png\",\"https://cdn.steemitimages.com/DQmNVhMgJHiuDmqfifgQPWz1xA8x8vHz5hdNubaCEuvTvi7/Chart%2008%20Fed%20Balance%20sheet%20130222.png\",\"https://cdn.steemitimages.com/DQmQaBGa3RzZRefMYpiYWqGDYAcCH2xRsCEXnqPRgcxnjxV/Chart%2009%20Risk-on%20factors%20have%20greatly%20outperformed%20220223.png\",\"https://cdn.steemitimages.com/DQmXyU2qcx5A7PDHyjQjMft3KkEWEeyygTiamMG68n5qn8c/Chart%2010%20Bitcoin%20Rainbow%20Price%20Chart%20Indicator%20200223.png\"],\"links\":[\"https://www.midastouch-consulting.com/23022023-bitcoin-next-target-30000-usd\",\"https://celticgold.de/blog/gold-und-bitcoin-analysen-von-florian-grummes-32/bitcoin-deutliche-erholung-zu-erwarten-204\",\"https://t.me/MidasTouchConsulting\",\"http://bit.ly/1EUdt2K\"],\"app\":\"steemit/0.2\",\"format\":\"markdown\"}",
"parent_author": "",
"parent_permlink": "leofinance",
"permlink": "february-23rd-2023-bitcoin-next-target-30-000-usd",
"title": "February 23rd, 2023, Bitcoin – Next target 30,000 USD"
}
],
"op_in_trx": 0,
"timestamp": "2023-02-24T15:36:12",
"trx_id": "b6b3e65f13f8eb71d8e79f96997ed396658b3d43",
"trx_in_block": 1,
"virtual_op": 0
}midastouchclaimed reward balance: 0.094 STEEM, 0.104 SP2022/10/31 11:46:15
midastouchclaimed reward balance: 0.094 STEEM, 0.104 SP
2022/10/31 11:46:15
| account | midastouch |
| reward sbd | 0.000 SBD |
| reward steem | 0.094 STEEM |
| reward vests | 168.632921 VESTS |
| Transaction Info | Block #69027320/Trx 5616d0b6c93b3e77573321536362c546a0a19b43 |
View Raw JSON Data
{
  "block": 69027320,
  "op": [
    "claim_reward_balance",
    {
      "account": "midastouch",
      "reward_sbd": "0.000 SBD",
      "reward_steem": "0.094 STEEM",
      "reward_vests": "168.632921 VESTS"
    }
  ],
  "op_in_trx": 0,
  "timestamp": "2022-10-31T11:46:15",
  "trx_id": "5616d0b6c93b3e77573321536362c546a0a19b43",
  "trx_in_block": 4,
  "virtual_op": 0
}midastouchupvoted (100.00%) @midastouch / october-31st-2022-bitcoin-some-chance-for-a-recovery2022/10/31 11:46:06
midastouchupvoted (100.00%) @midastouch / october-31st-2022-bitcoin-some-chance-for-a-recovery
2022/10/31 11:46:06
| author | midastouch |
| permlink | october-31st-2022-bitcoin-some-chance-for-a-recovery |
| voter | midastouch |
| weight | 10000 (100.00%) |
| Transaction Info | Block #69027317/Trx 12f840fa1f839c8c7e9c09ea36cfc34c2c8cefc4 |
View Raw JSON Data
{
  "block": 69027317,
  "op": [
    "vote",
    {
      "author": "midastouch",
      "permlink": "october-31st-2022-bitcoin-some-chance-for-a-recovery",
      "voter": "midastouch",
      "weight": 10000
    }
  ],
  "op_in_trx": 0,
  "timestamp": "2022-10-31T11:46:06",
  "trx_id": "12f840fa1f839c8c7e9c09ea36cfc34c2c8cefc4",
  "trx_in_block": 4,
  "virtual_op": 0
}midastouchfollowed @pocket-change2022/10/31 11:44:54
midastouchfollowed @pocket-change
2022/10/31 11:44:54
| id | follow |
| json | ["follow",{"follower":"midastouch","following":"pocket-change","what":["blog",""]}] |
| required auths | [] |
| required posting auths | ["midastouch"] |
| Transaction Info | Block #69027293/Trx 36d27bc41e969517c94276e73de5b76a7af2fcaf |
View Raw JSON Data
{
  "block": 69027293,
  "op": [
    "custom_json",
    {
      "id": "follow",
      "json": "[\"follow\",{\"follower\":\"midastouch\",\"following\":\"pocket-change\",\"what\":[\"blog\",\"\"]}]",
      "required_auths": [],
      "required_posting_auths": [
        "midastouch"
      ]
    }
  ],
  "op_in_trx": 0,
  "timestamp": "2022-10-31T11:44:54",
  "trx_id": "36d27bc41e969517c94276e73de5b76a7af2fcaf",
  "trx_in_block": 5,
  "virtual_op": 0
}midastouchupvoted (100.00%) @pocket-change / rk7gqd2022/10/31 11:44:48
midastouchupvoted (100.00%) @pocket-change / rk7gqd
2022/10/31 11:44:48
| author | pocket-change |
| permlink | rk7gqd |
| voter | midastouch |
| weight | 10000 (100.00%) |
| Transaction Info | Block #69027291/Trx ec7076cb12b9699669ce2522e1b9a7f6003a330d |
View Raw JSON Data
{
  "block": 69027291,
  "op": [
    "vote",
    {
      "author": "pocket-change",
      "permlink": "rk7gqd",
      "voter": "midastouch",
      "weight": 10000
    }
  ],
  "op_in_trx": 0,
  "timestamp": "2022-10-31T11:44:48",
  "trx_id": "ec7076cb12b9699669ce2522e1b9a7f6003a330d",
  "trx_in_block": 1,
  "virtual_op": 0
}midastouchupvoted (100.00%) @pocket-change / rk7gqd2022/10/31 11:44:42
midastouchupvoted (100.00%) @pocket-change / rk7gqd
2022/10/31 11:44:42
| author | pocket-change |
| permlink | rk7gqd |
| voter | midastouch |
| weight | 10000 (100.00%) |
| Transaction Info | Block #69027289/Trx bb695ef0cfde6238ddfe3f81515bd3c95629a856 |
View Raw JSON Data
{
  "block": 69027289,
  "op": [
    "vote",
    {
      "author": "pocket-change",
      "permlink": "rk7gqd",
      "voter": "midastouch",
      "weight": 10000
    }
  ],
  "op_in_trx": 0,
  "timestamp": "2022-10-31T11:44:42",
  "trx_id": "bb695ef0cfde6238ddfe3f81515bd3c95629a856",
  "trx_in_block": 2,
  "virtual_op": 0
}midastouchupvoted (100.00%) @pocket-change / rk7gqd2022/10/31 11:44:36
midastouchupvoted (100.00%) @pocket-change / rk7gqd
2022/10/31 11:44:36
| author | pocket-change |
| permlink | rk7gqd |
| voter | midastouch |
| weight | 10000 (100.00%) |
| Transaction Info | Block #69027287/Trx 2a150670333f9ee45ab6650c2bdf971884450538 |
View Raw JSON Data
{
  "block": 69027287,
  "op": [
    "vote",
    {
      "author": "pocket-change",
      "permlink": "rk7gqd",
      "voter": "midastouch",
      "weight": 10000
    }
  ],
  "op_in_trx": 0,
  "timestamp": "2022-10-31T11:44:36",
  "trx_id": "2a150670333f9ee45ab6650c2bdf971884450538",
  "trx_in_block": 0,
  "virtual_op": 0
}midastouchpublished a new post: october-31st-2022-bitcoin-some-chance-for-a-recovery2022/10/31 11:44:18
midastouchpublished a new post: october-31st-2022-bitcoin-some-chance-for-a-recovery
2022/10/31 11:44:18
| author | midastouch |
| body |  # [October 31st, 2022, Bitcoin – Some chance for a recovery](https://www.midastouch-consulting.com/31102022-bitcoin-some-chance-for-a-recovery) Bitcoin and the whole crypto sector are in a bear market for nearly a year now. The selloff has been brutal and any recovery has been short-lived. However, in recent months the correction has slowed down, and Bitcoin continues to find support around 18,000 to 20,000 USD. Bitcoin – Some chance for a recovery. ### Review Since crashing to 17,600 USD in mid-June 2022 Bitcoin prices have only slowly to recovered. Although there was a weak bounce in August to around 25,200 USD, prices have mainly been moving sideways between 18,500 USD and 20,000 USD in recent months. If you want to report at least something positive, then it is probably the fact that Bitcoin (BTC), in contrast to stock and bond markets as well as the price of gold, has not marked a new low in the last four months. Instead, it has been able to hold above 18,200 USD since mid-June. 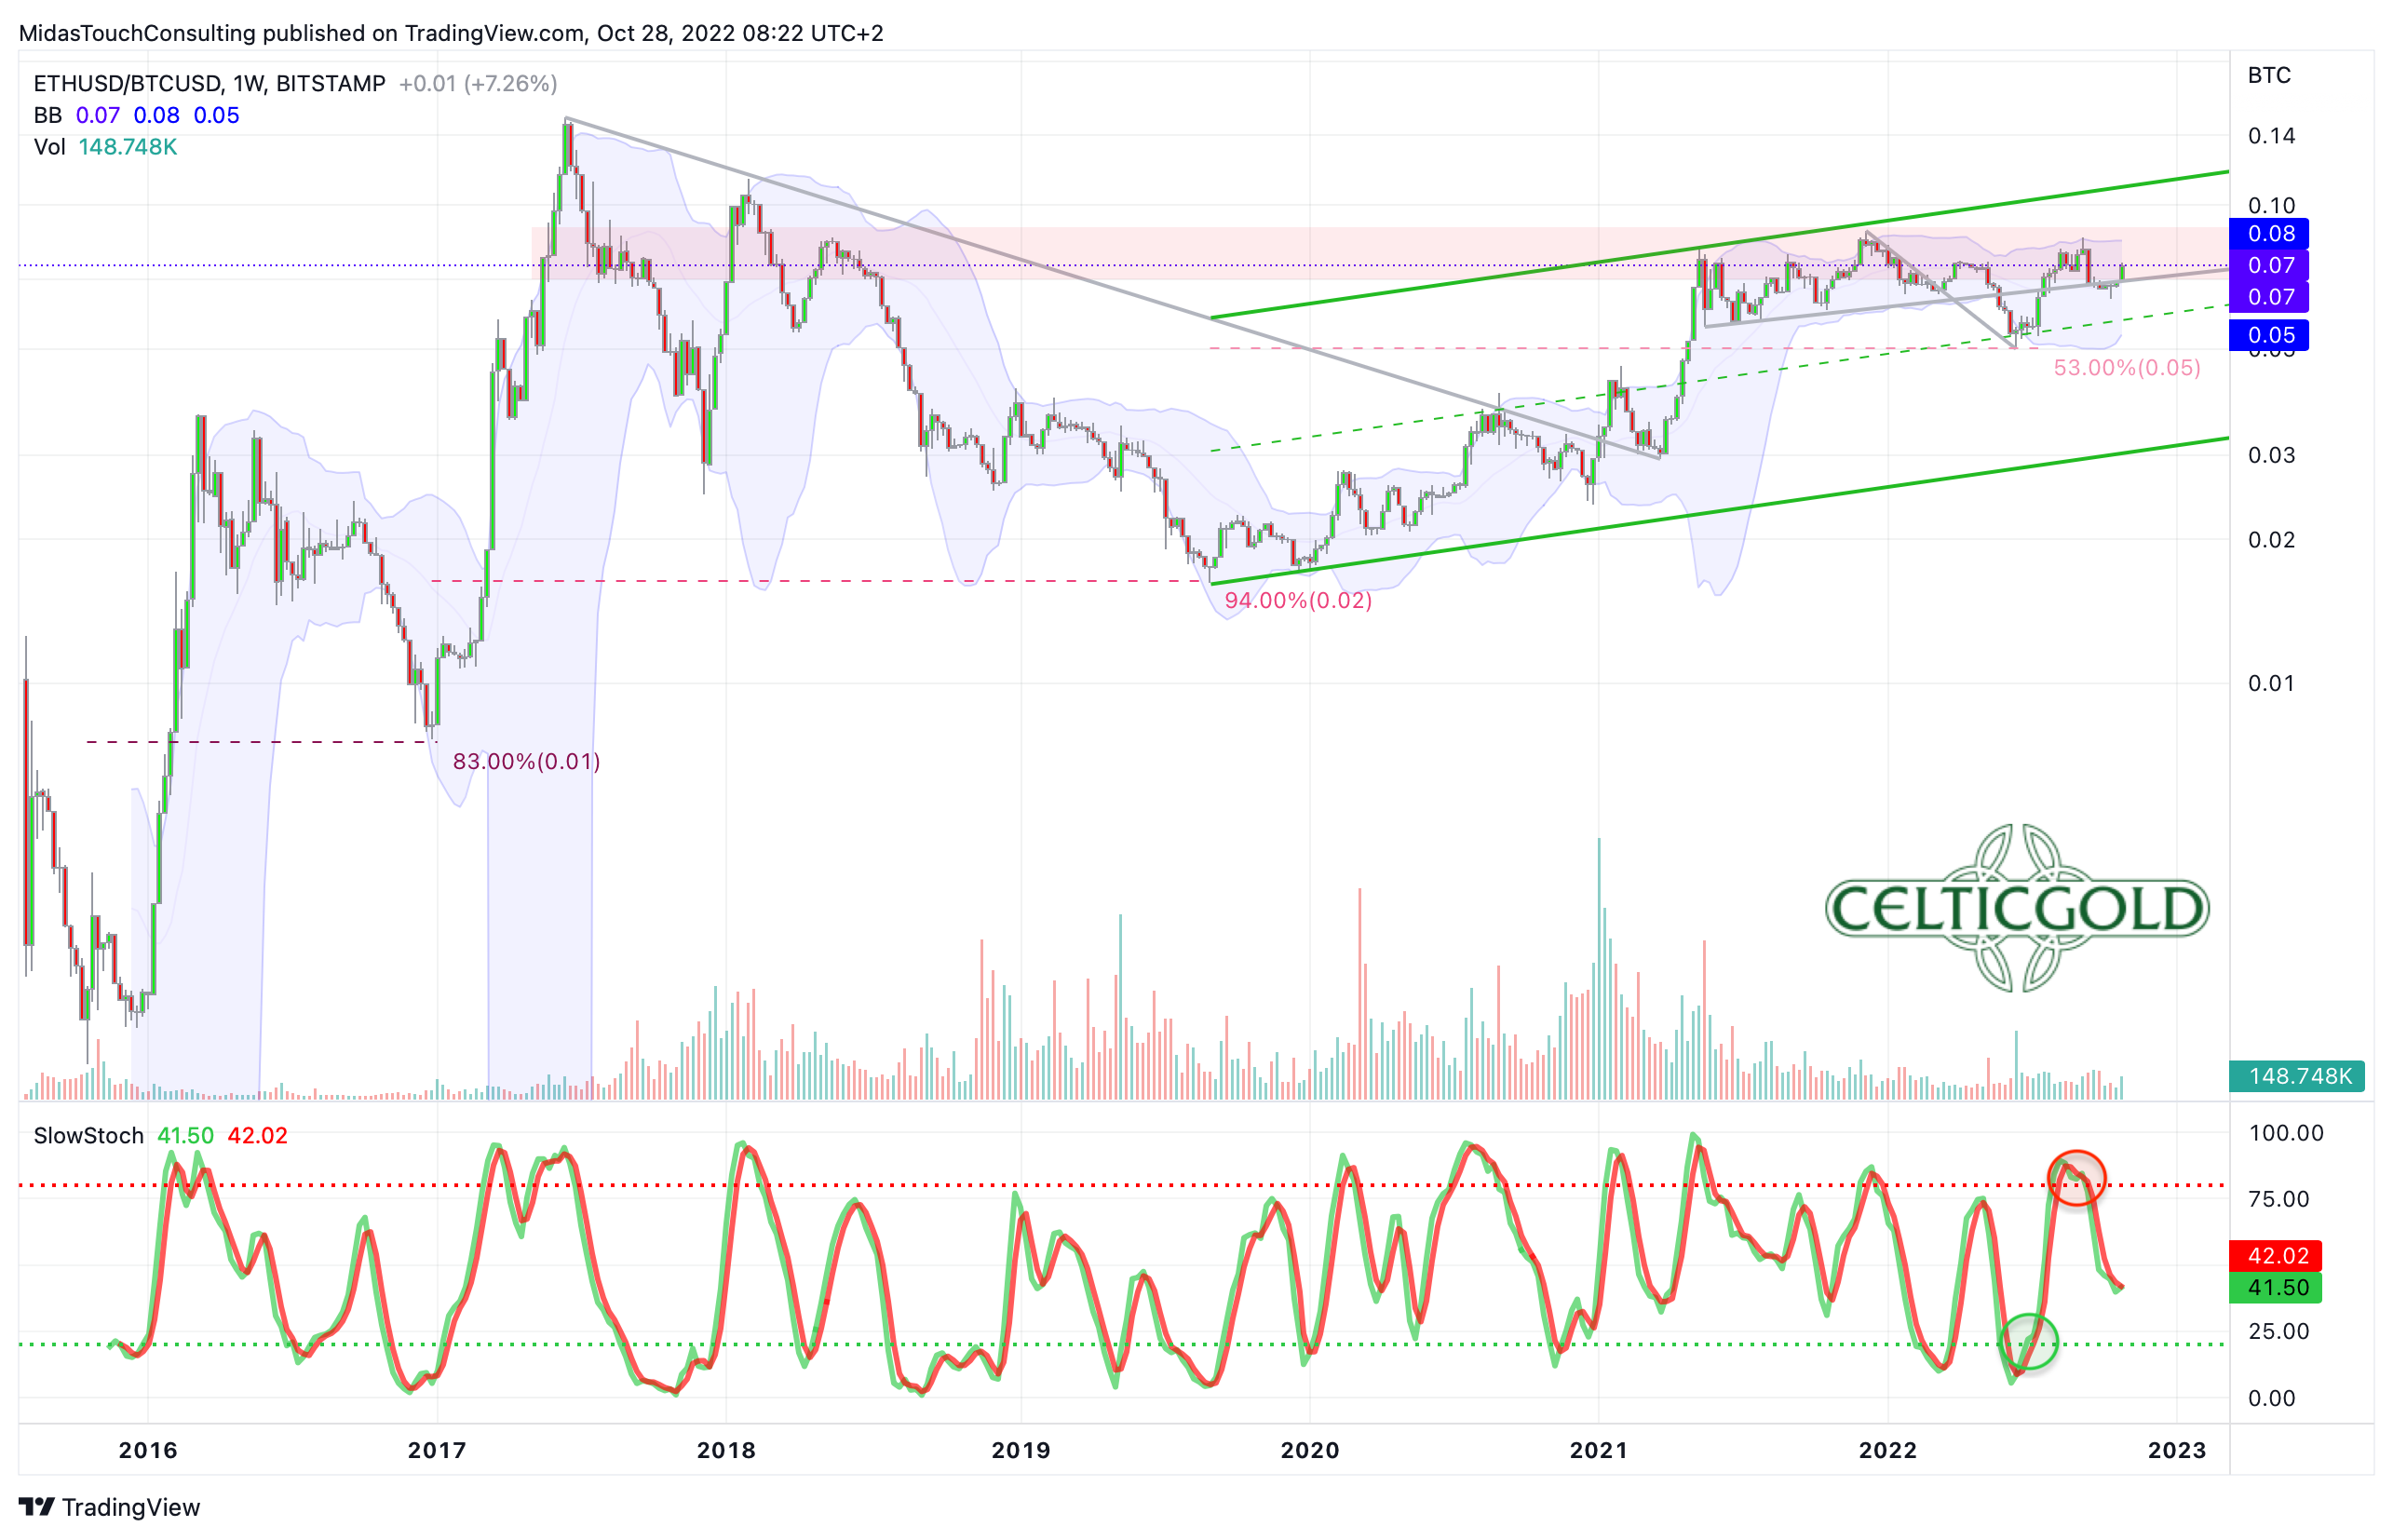 *Ethereum/Bitcoin-Ratio, weekly chart as of October 31st, 2022. Source: Tradingview.* The fact that Ethereum (ETH) has developed significantly better than Bitcoin since the crash in June is also interesting and positive. Although there is more than justified criticism of the Ethereum network and Bitcoin is still the only one that deserves the title “decentralized”, the market seems to know more. Nevertheless, in terms of market capitalization, Ethereum still lags far behind Bitcoin. However, the Ethereum/Bitcoin-Ratio makes it clear that Ethereum, which unlike Bitcoin was not designed as a currency and store of value, but for complex smart contracts and decentralized applications, continues to tinker with the breakout against Bitcoin. In fact, due to technological advances, Ethereum now better represents the “blockchain” innovation. And although interest in cryptocurrencies has waned in recent months due to price weakness, Chainanalysis’ Global Index shows that large and long-term crypto investors have held onto their positions. ### Technical Analysis For Bitcoin in US-Dollar #### Bitcoin Weekly Chart – Still within a clearly defined downtrend channel 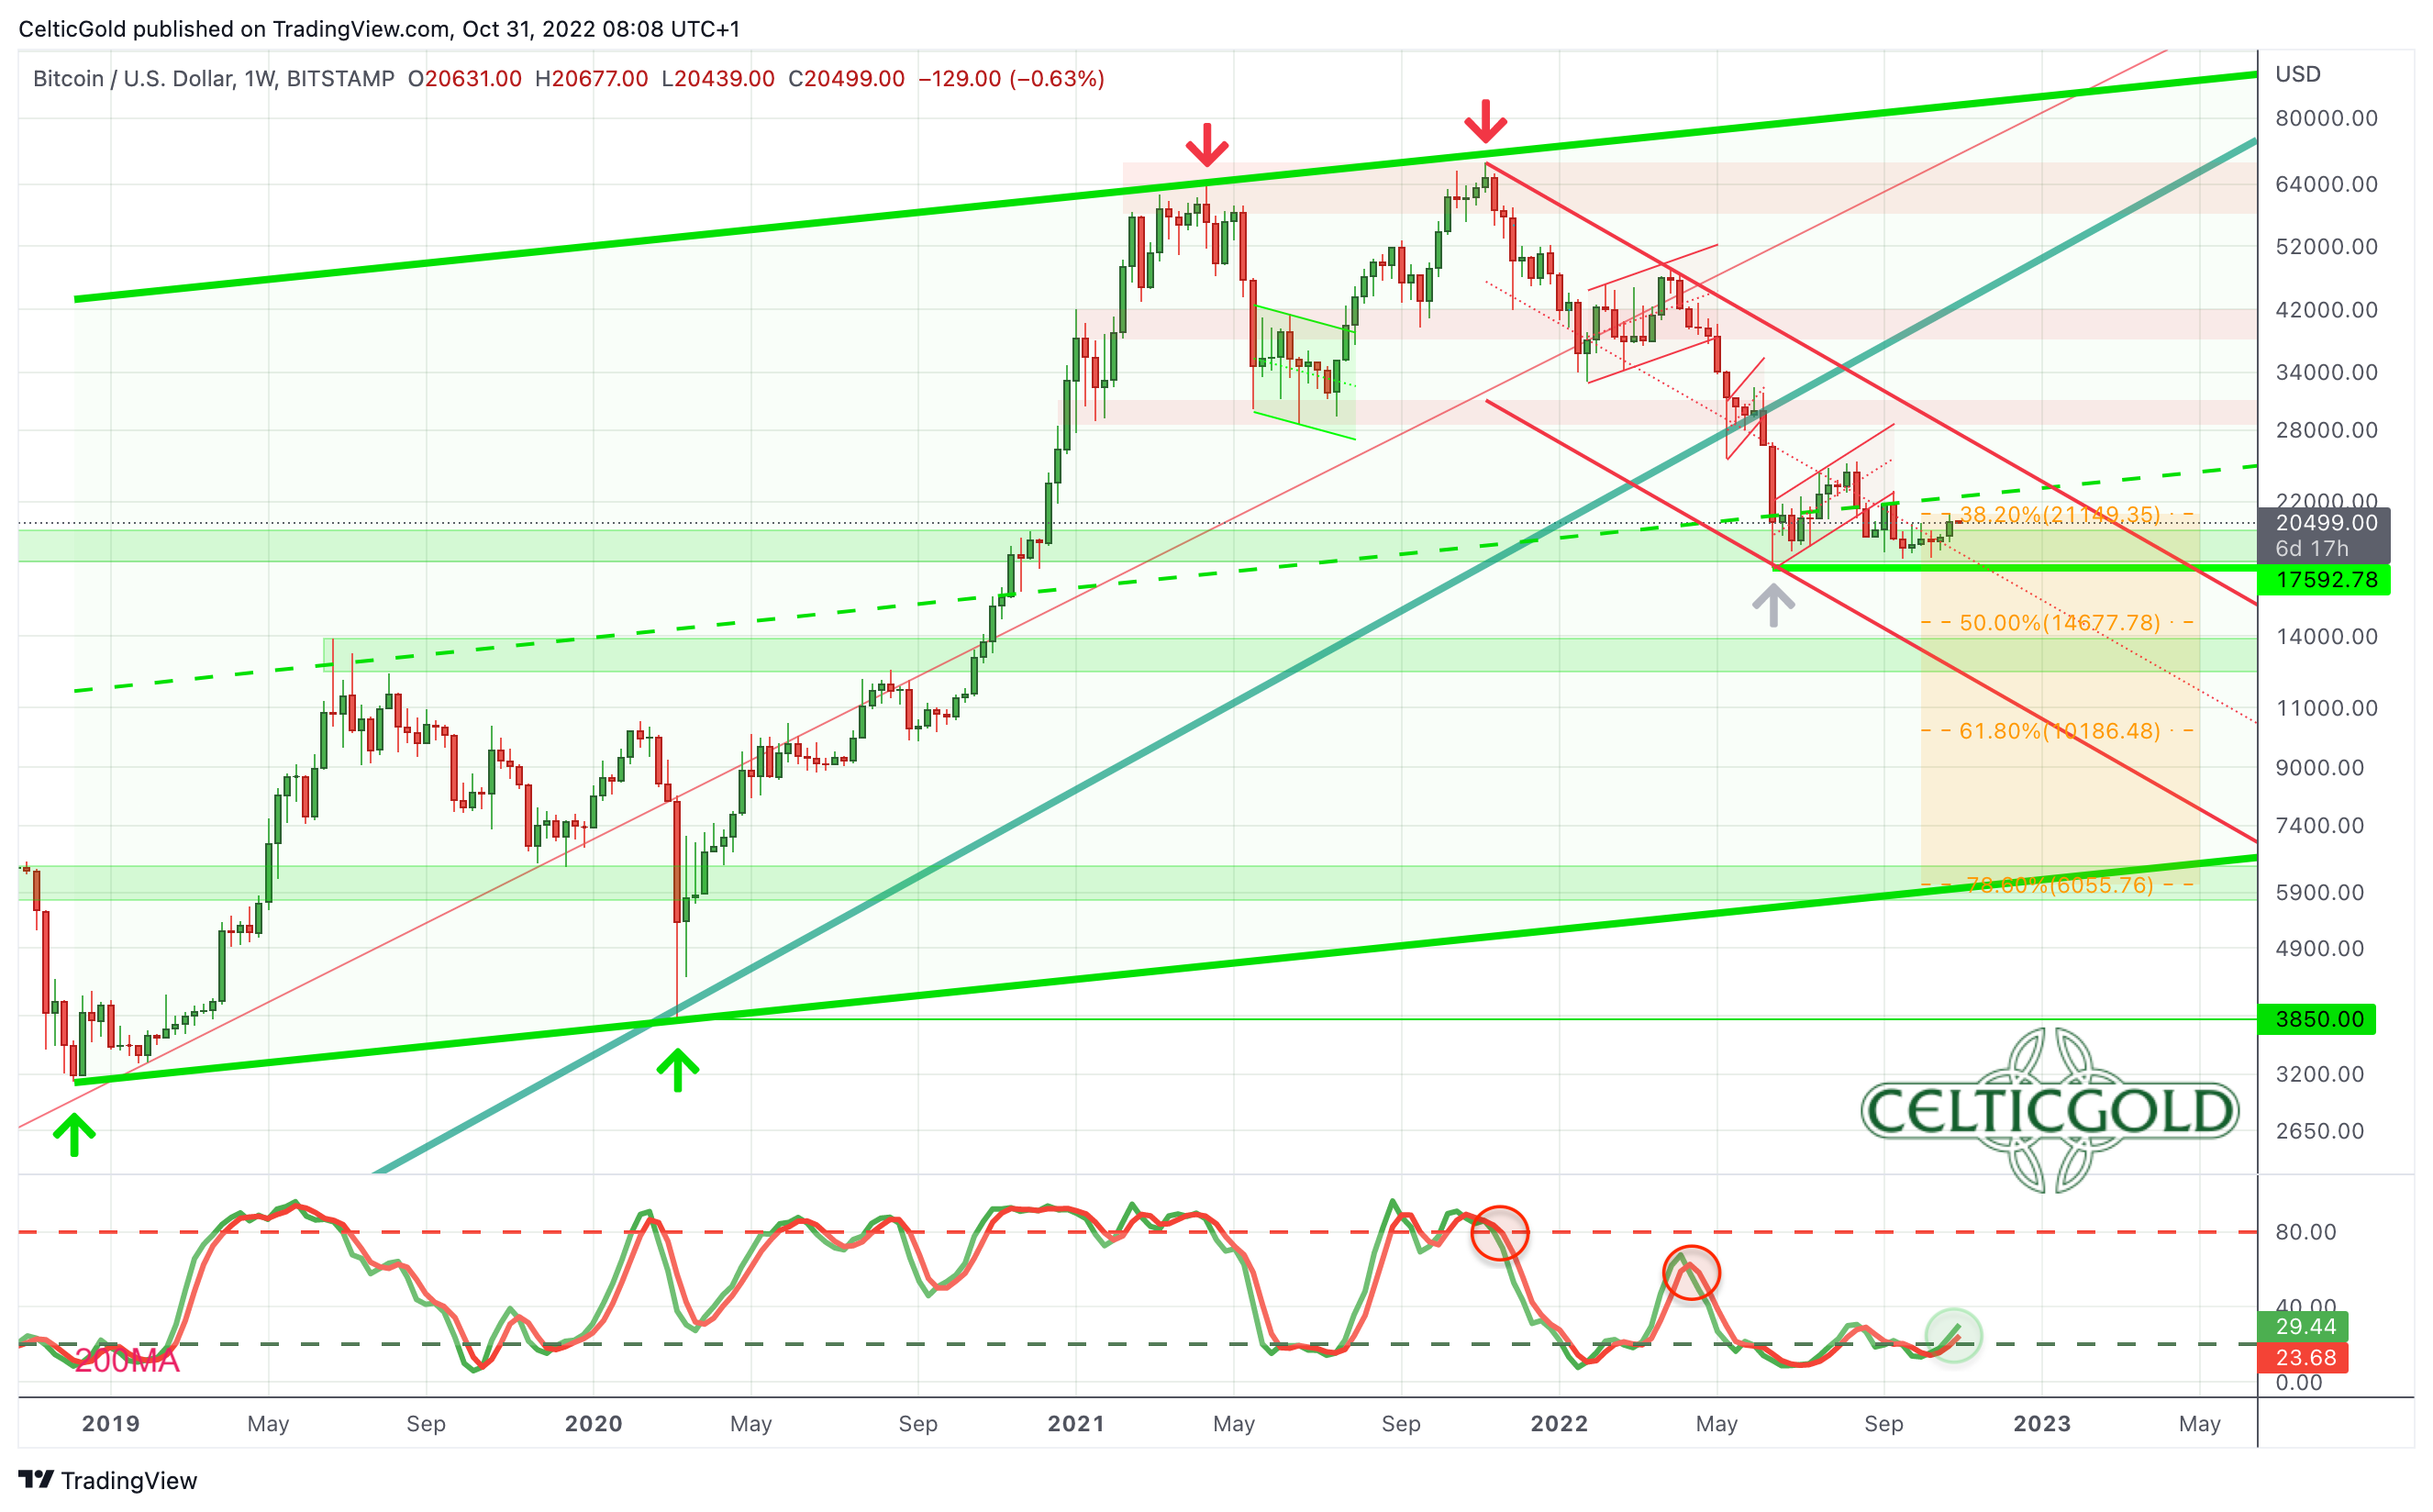 *Bitcoin in USD, weekly chart as of October 31st, 2022. Source: Tradingview* In the big picture, Bitcoin is currently trading just below the mid-trend line of its large overriding uptrend channel. Despite the 11-month correction, this trend channel is still intact and would only have to be cast aside with prices below around 6,000 USD. Since November 2021, however, price action has also been taking place in a clearly defined downtrend channel. Here, Bitcoin is currently trading just above the mid-trend line as well. A recovery within the downtrend channel would currently have room to around 27,500 USD. Overall, the trend on the weekly chart is still pointing downwards, but the tough sideways phase of the last few months could initially be resolved with a counter-trend recovery or a bounce. The oversold stochastic oscillator would be ideally positioned for this. At the same time, one is well advised not to overestimate any recovery movements. It would be better to wait for evidence that the crypto winter is over, because below 18,000 USD there is still a risk of another price slide of around 30-50% looming. #### Bitcoin Daily Chart – Some chance for a recovery 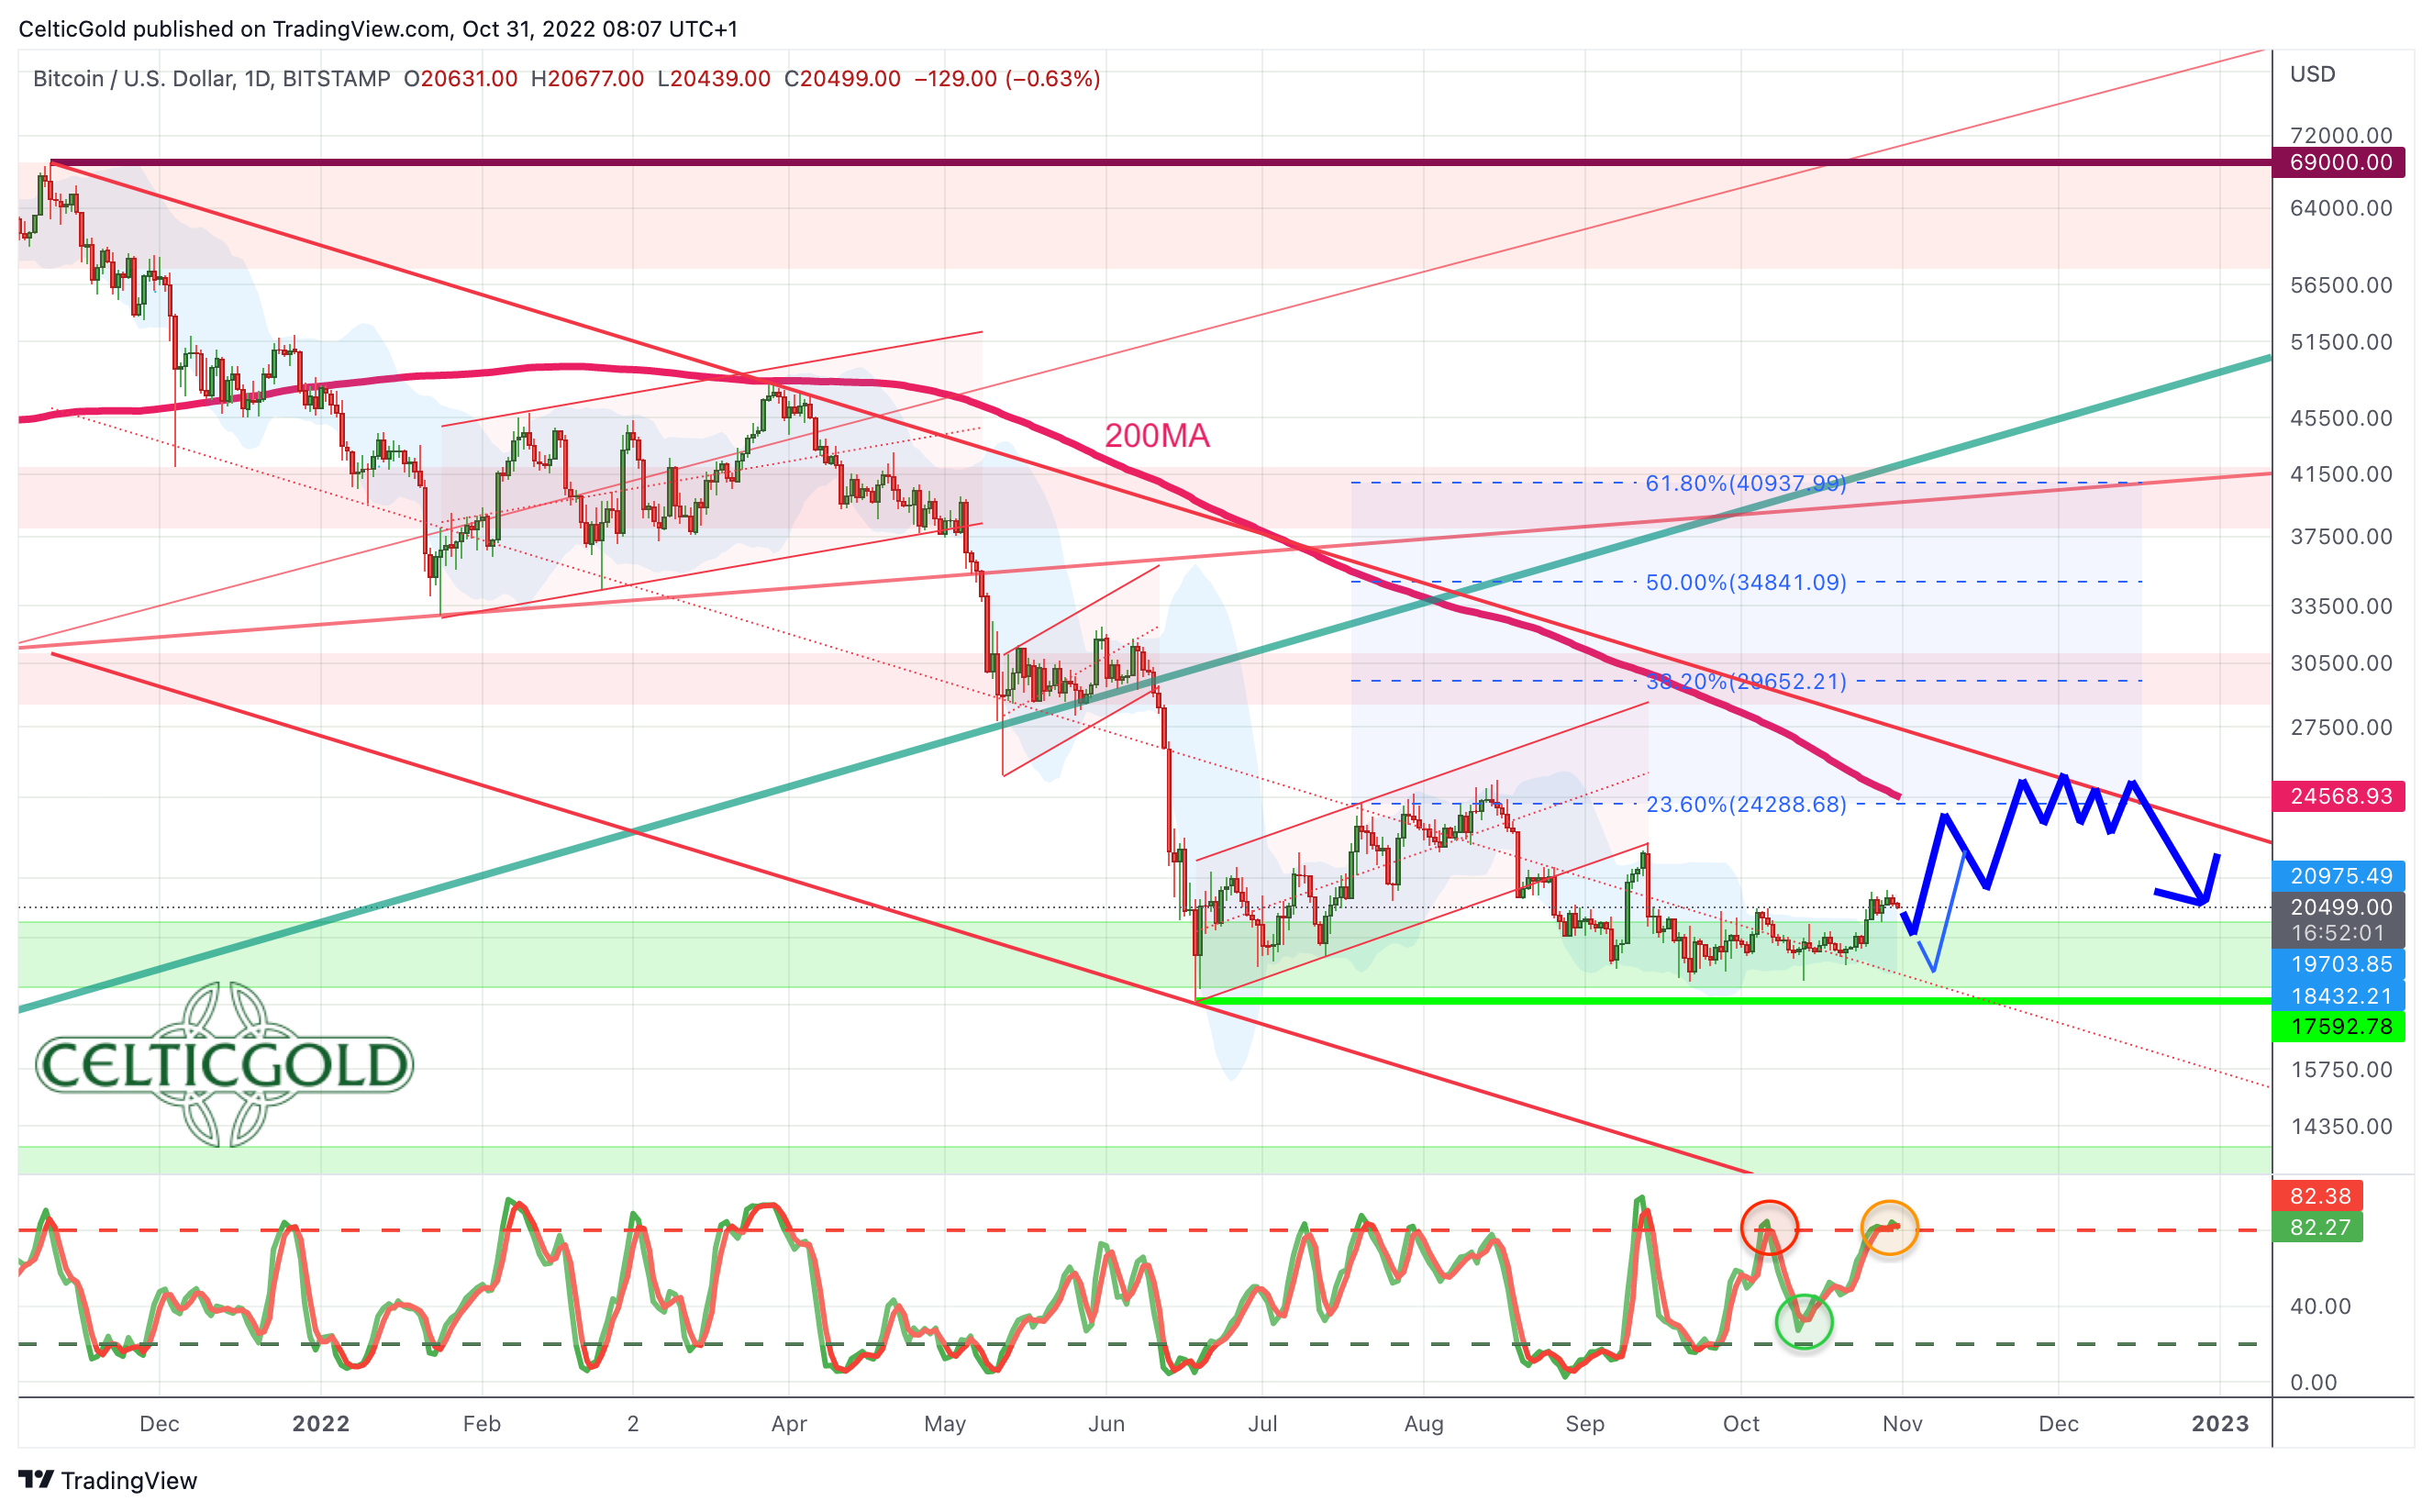 *Bitcoin in USD, daily chart as of October 31st, 2022. Source: Tradingview* On the daily chart, the broad support zone between 18,000 and 20,000 USD has held for the past few weeks. Bitcoin bulls are currently trying to break out to the upside. A first attempt failed on Wednesday, but the upper Bollinger band (20,987 USD) has been bent upwards. This gradually creates more space to the upside. The first target of a recovery would be the rapidly falling 200-day moving average (24,569 USD) and would actually be overdue. As well, a rally towards the upper edge of the downtrend channel around 25,000 to 26,000 USD seems possible. However, the stochastic has already reached its overbought zone again. In this respect, it looks more like a tough challenge for the bulls to advance directly. A pullback towards crucial support around 20,000 USD before another rally attempt is therefore likely. In summary, the chance for a slightly larger recovery is on the chart. However, prices well above 25,000 USD currently appear rather unrealistic. Nevertheless, if the US dollar actually corrects a little more, Bitcoin and the crypto sector would get a boost. ### Sentiment Bitcoin – Fear has been the norm since the beginning of the year 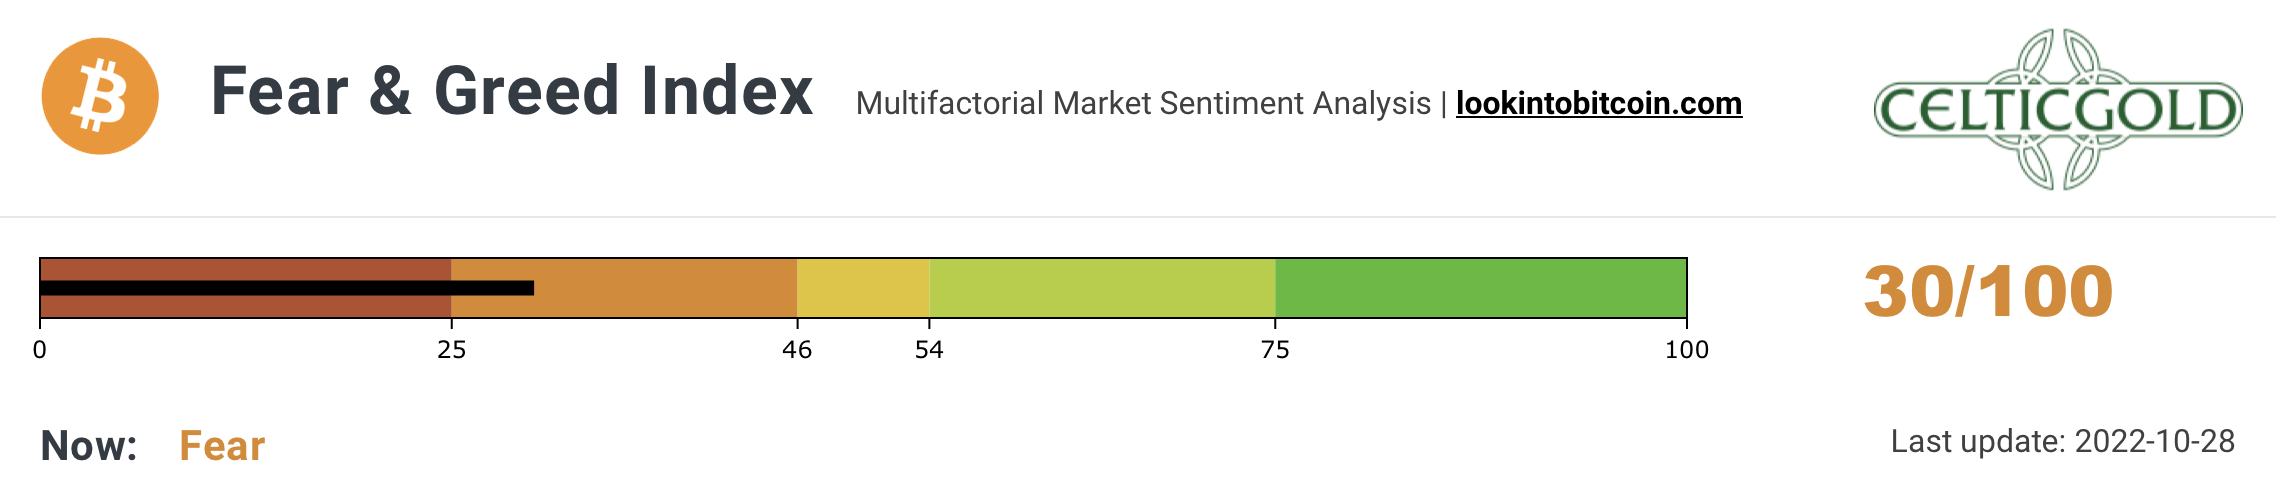 *Crypto Fear & Greed Index, as of October 28th, 2022. Source: Lookintobitcoin* The Crypto Fear & Greed Index is currently sitting at 31 and continues to measure high levels of fear in the crypto sector. This has become the norm since the price collapse at the beginning of the year. 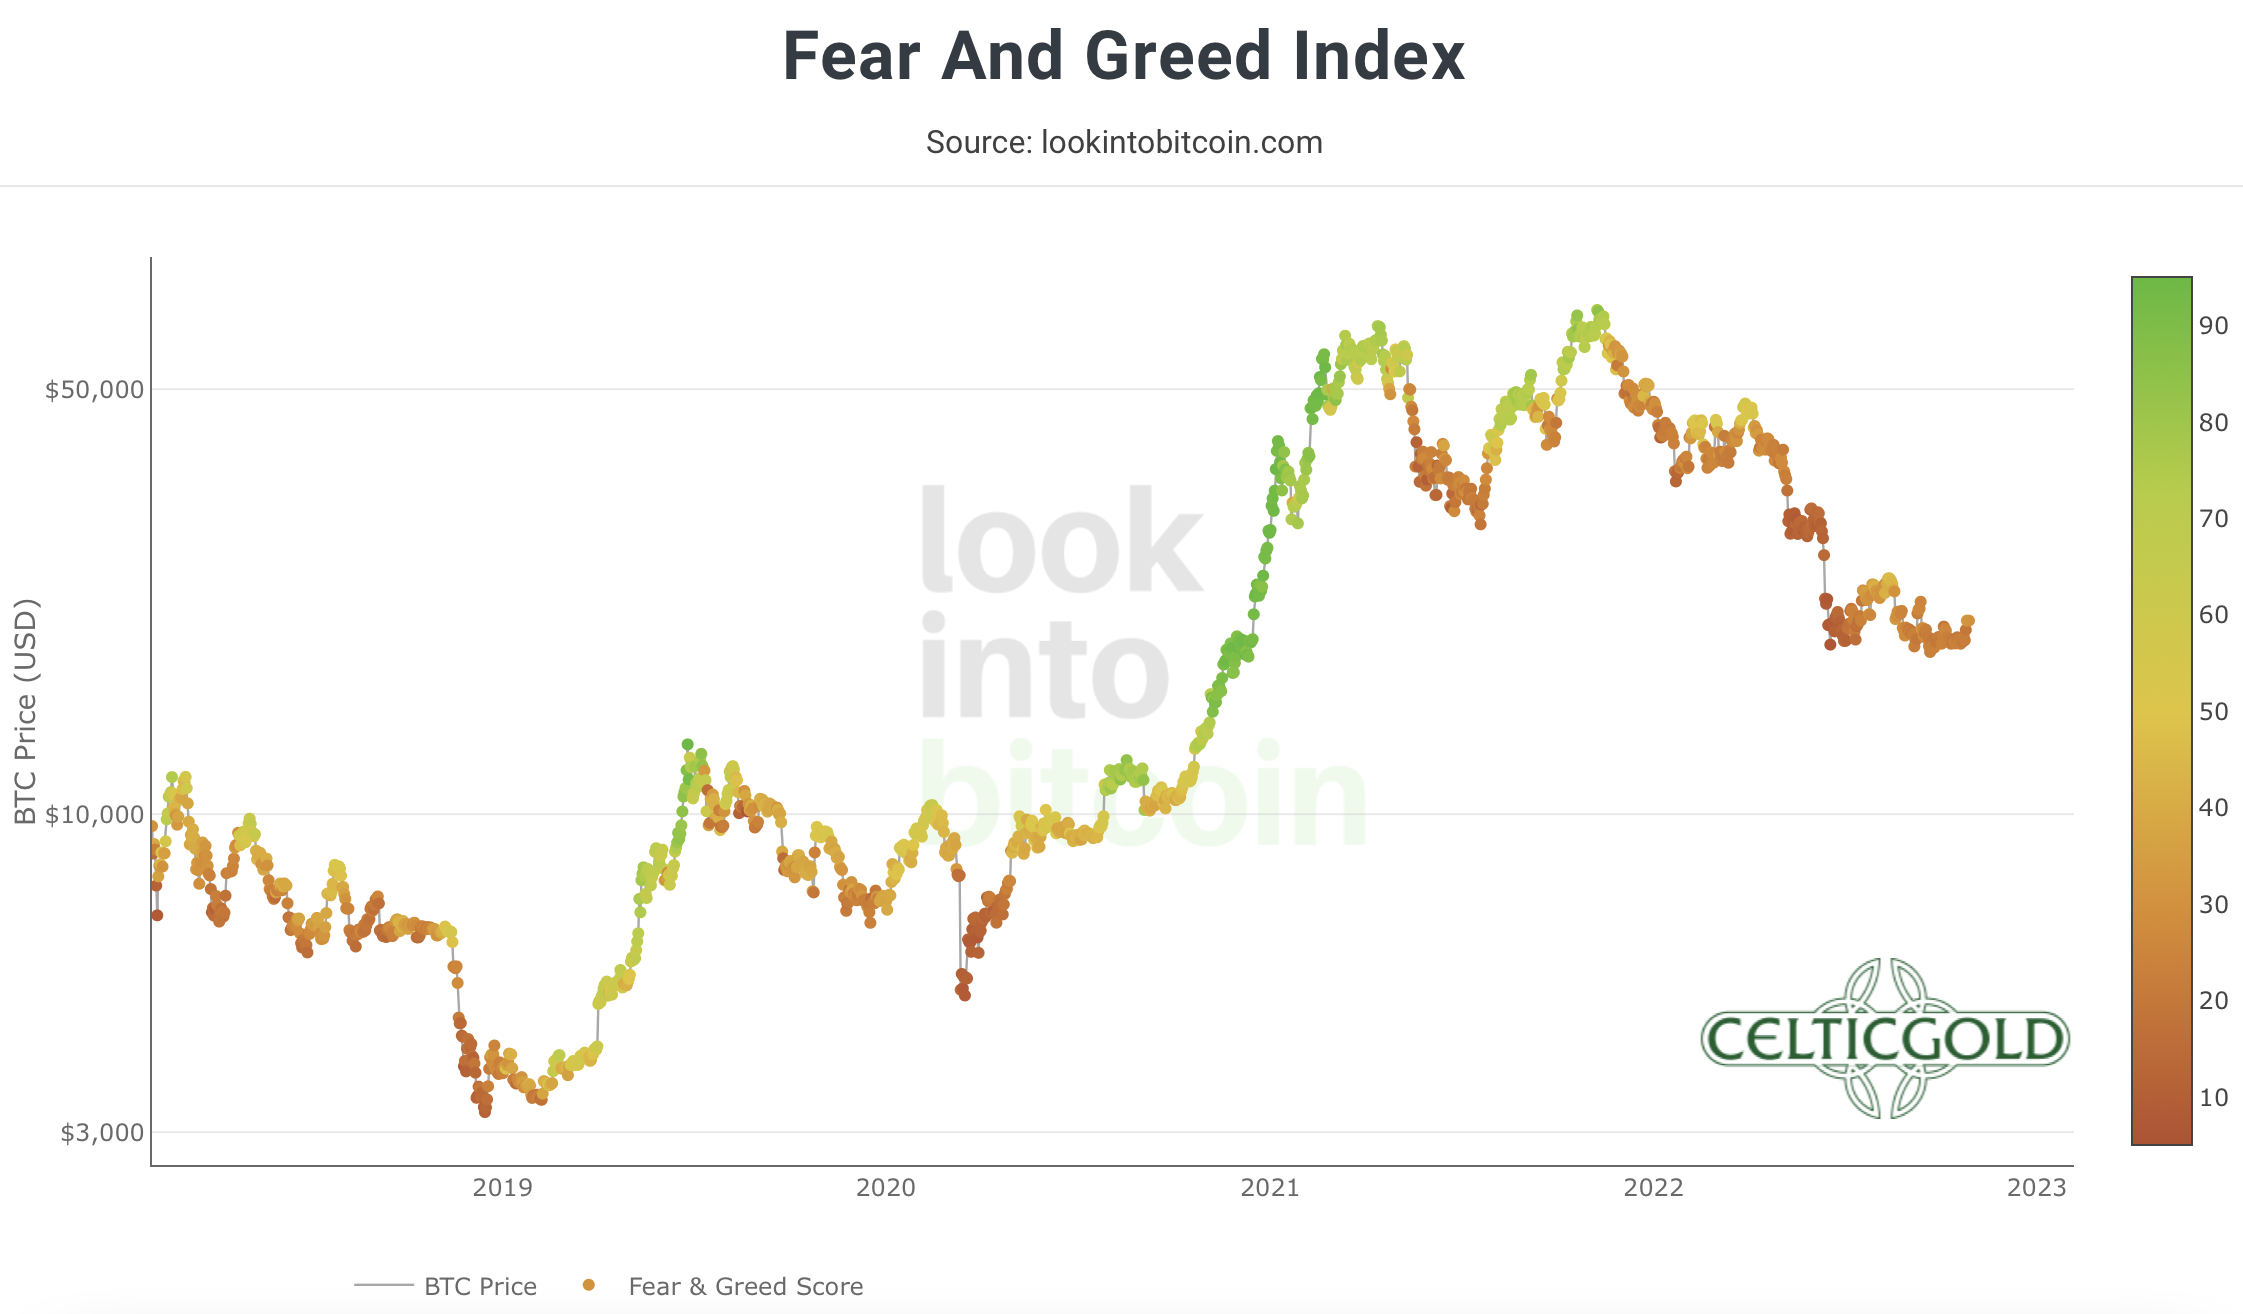 *Crypto Fear & Greed Index long term, as of October 28th, 2022. Source: Lookintobitcoin* In the big picture, however, the bombed-out sentiment also provides a contrarian opportunity. ### Seasonality Bitcoin – Strong 4th quarter 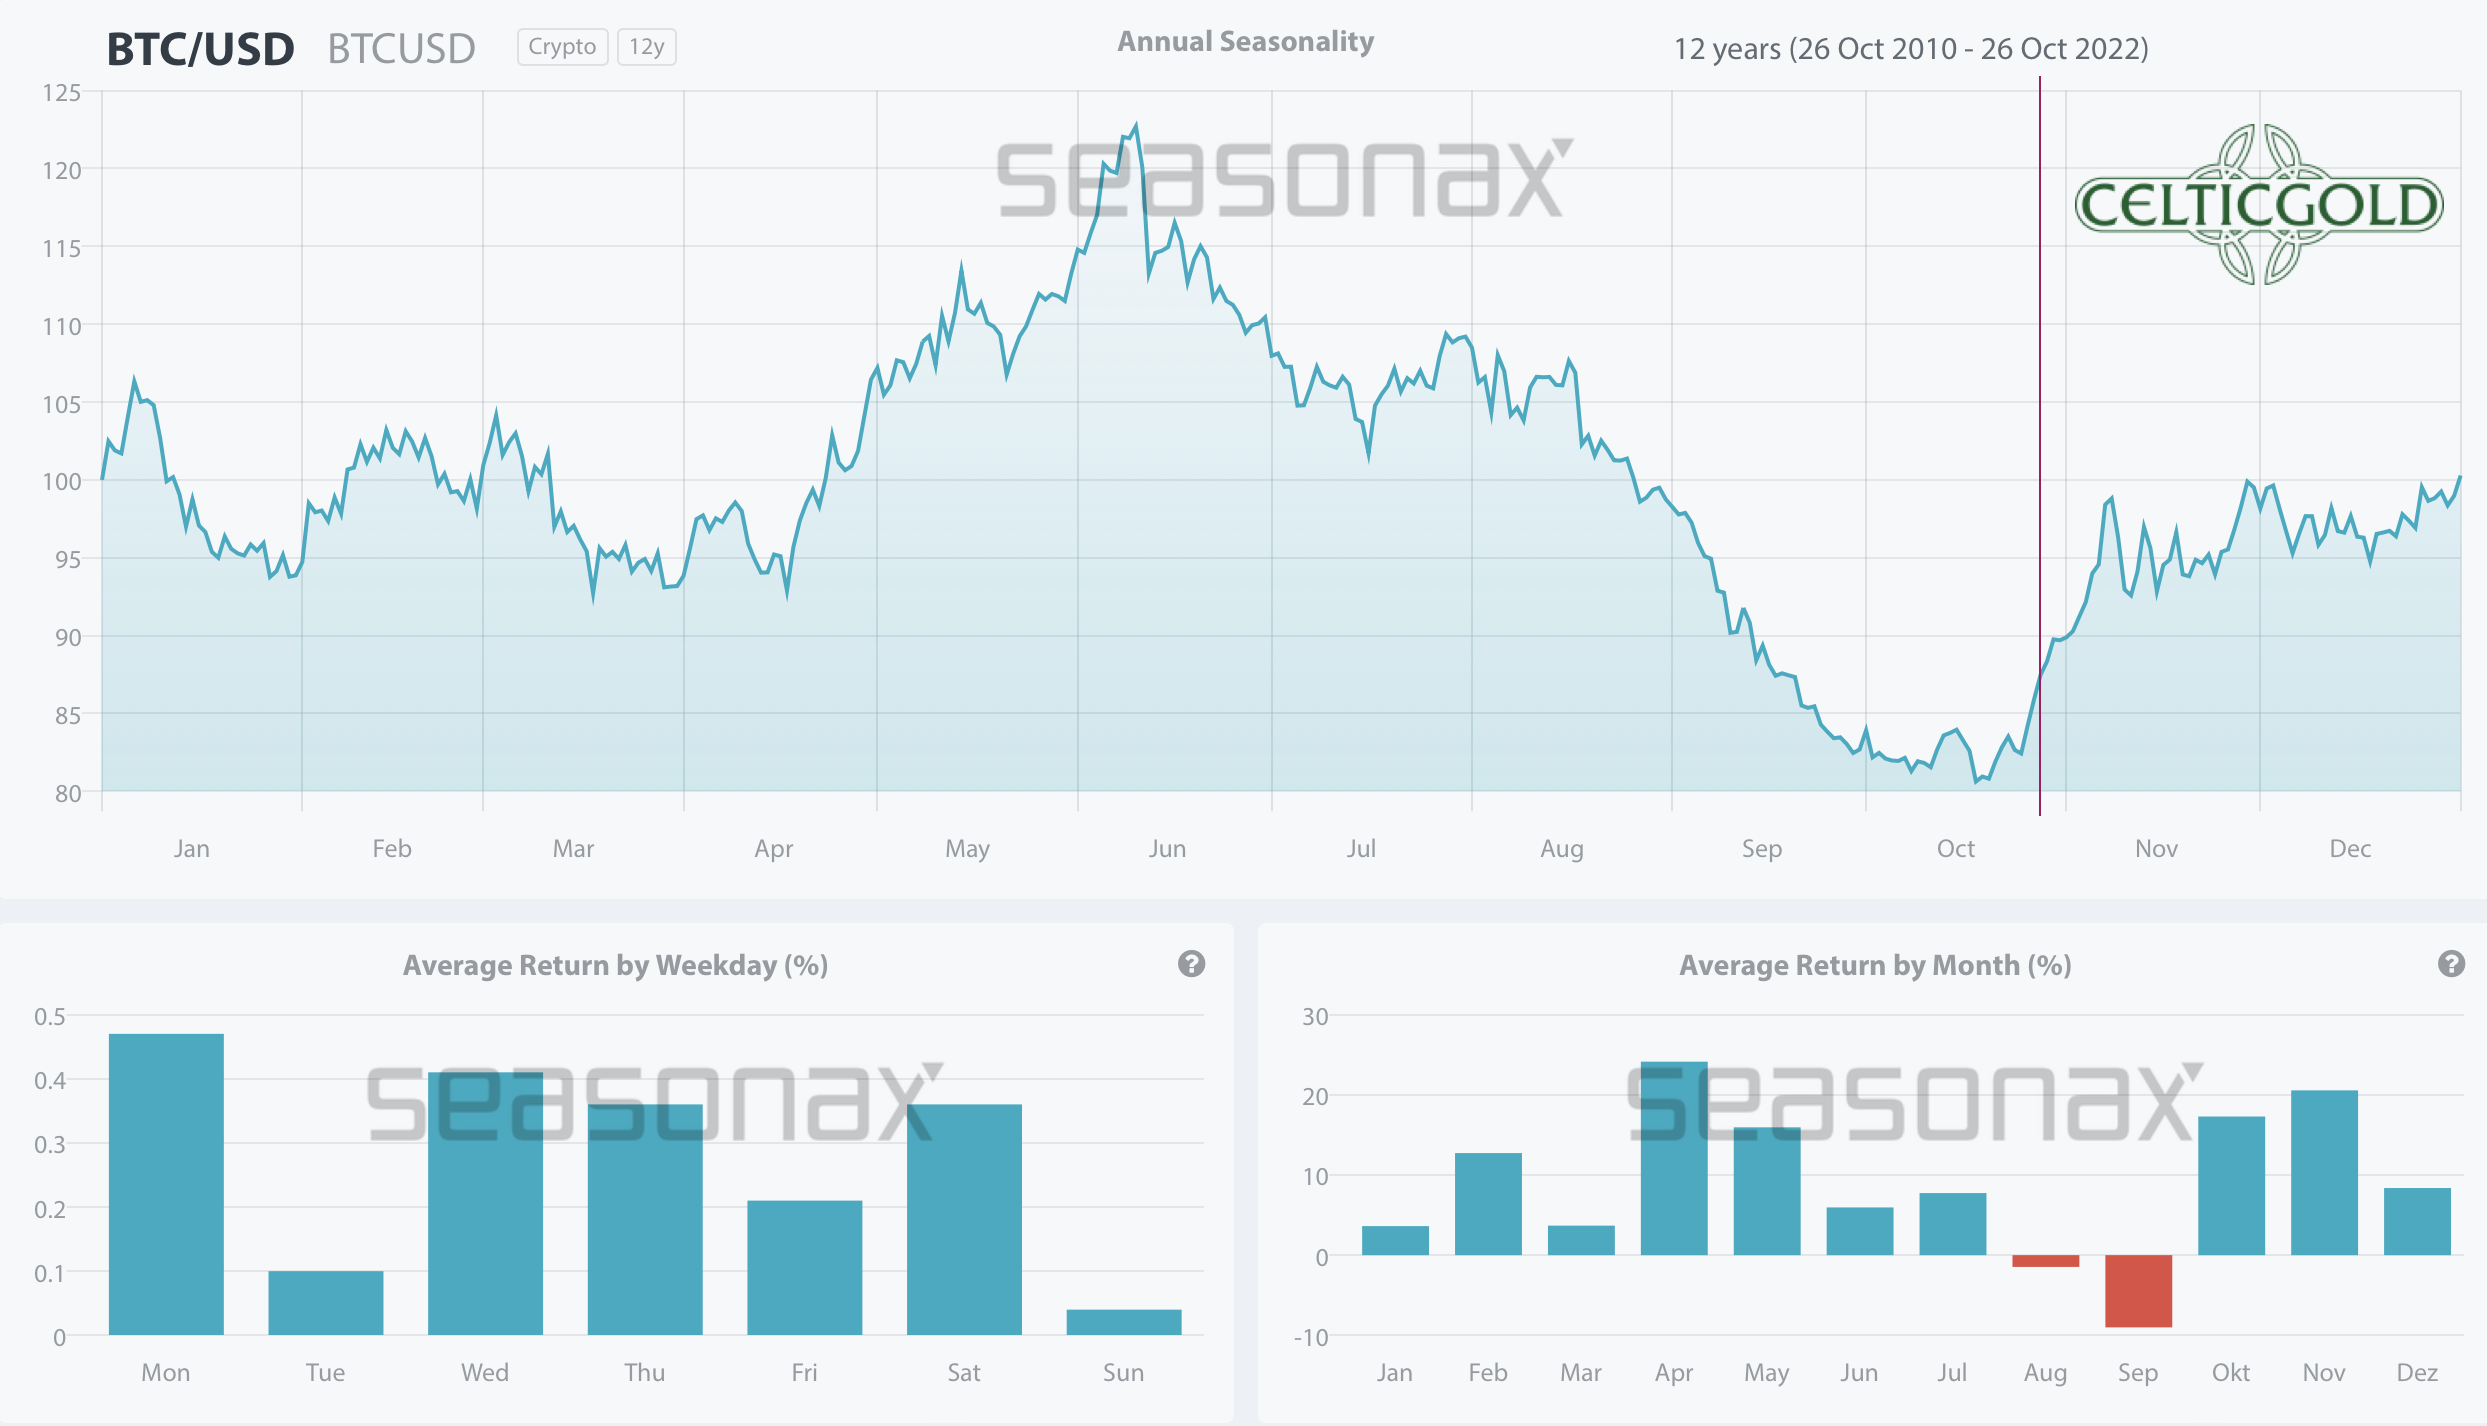 *Seasonality for bitcoin, as of October 28th, 2022. Source: Seasonax* Statistically, Bitcoin had a strong 4th quarter over the past 12 years. Of course, seasonal statistics cannot guarantee future price movements. Nevertheless, the probability of a recovery towards the end of the year is significantly higher from a seasonal perspective. ### Sound Money: Bitcoin vs. Gold 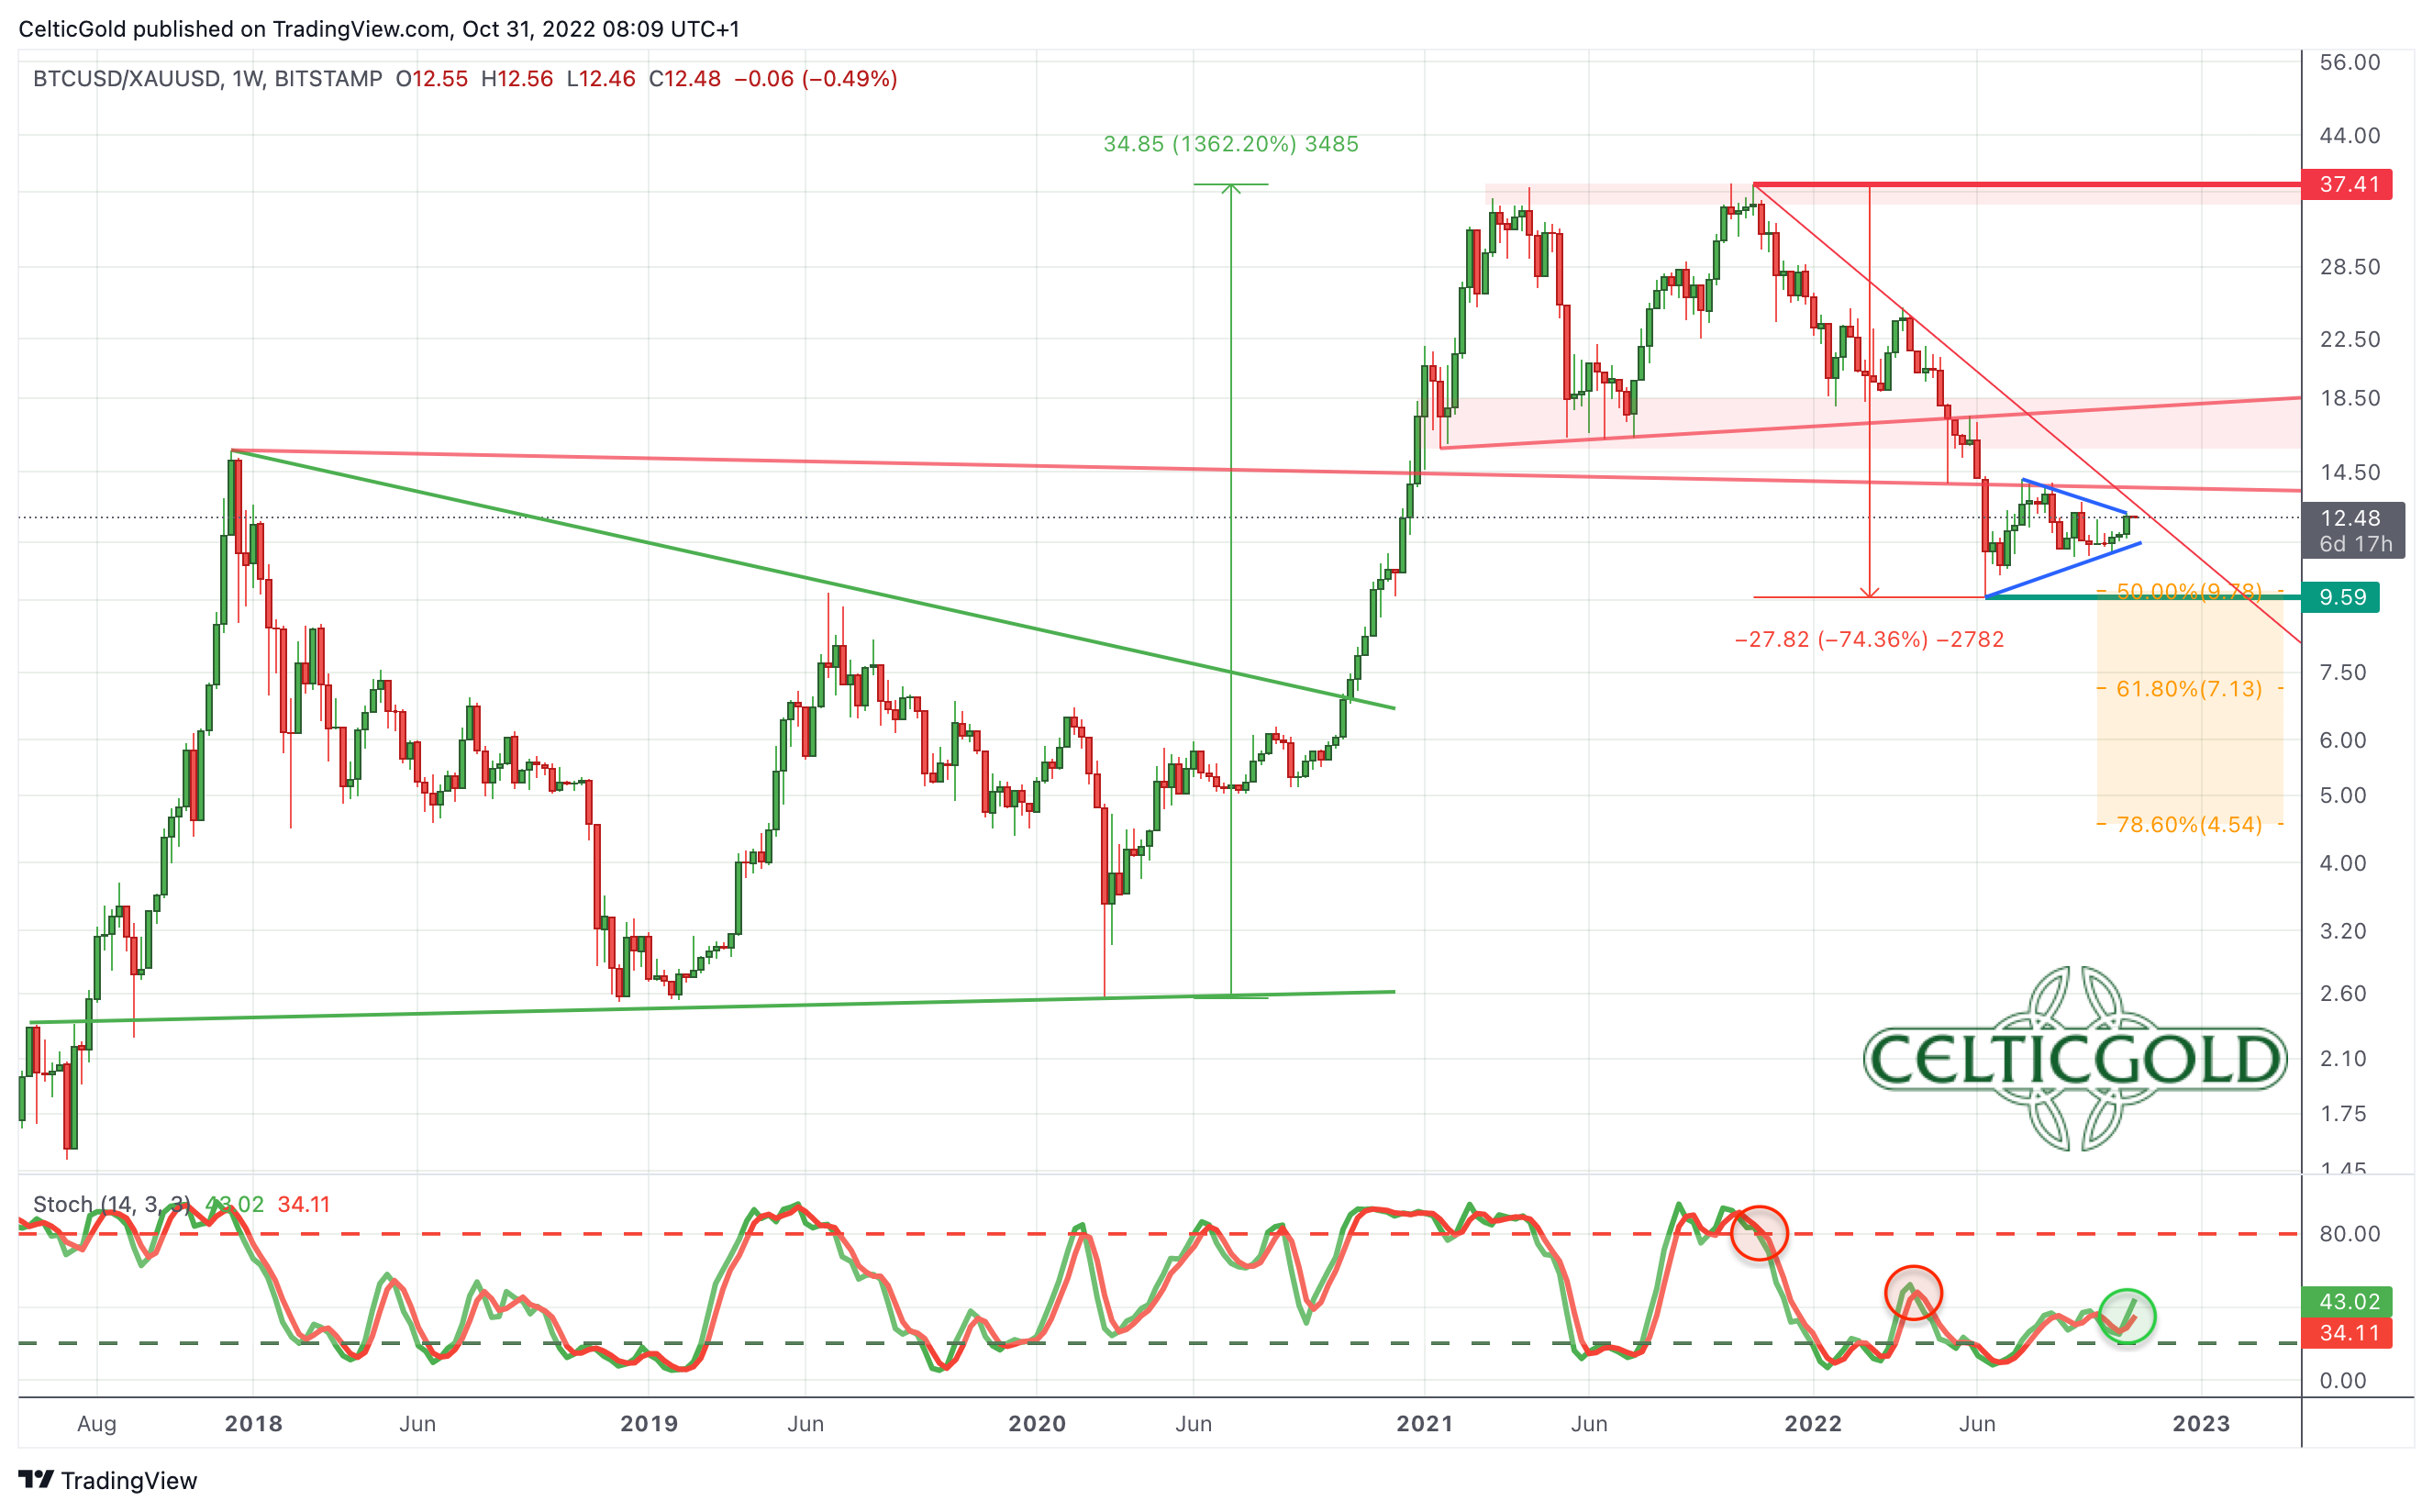 *Bitcoin/Gold-Ratio, weekly chart as of October 31st, 2022. Source: Tradingview* At current prices of around 20,500 USD for one bitcoin and around 1,640 USD for one ounce of gold, you have to pay 12.5 ounces of gold for one bitcoin. In other words, an ounce of gold currently costs 0.08 Bitcoin. Just like Bitcoin prices, the Bitcoin/Gold-Ratio has been running sideways for a good four and a half months. A recovery in favor of bitcoin has not yet succeeded. The overarching trend is therefore pointing further south, and the Bitcoin/Gold-Ratio would have to rise above 14 at least to clearly and sustainably break the downtrend. In summary, the Bitcoin/Gold-Ratio remains in a downtrend, and continues to consolidate the last major slide in prices with a sideways chop. ### Macro Update – A breather until the congressional elections 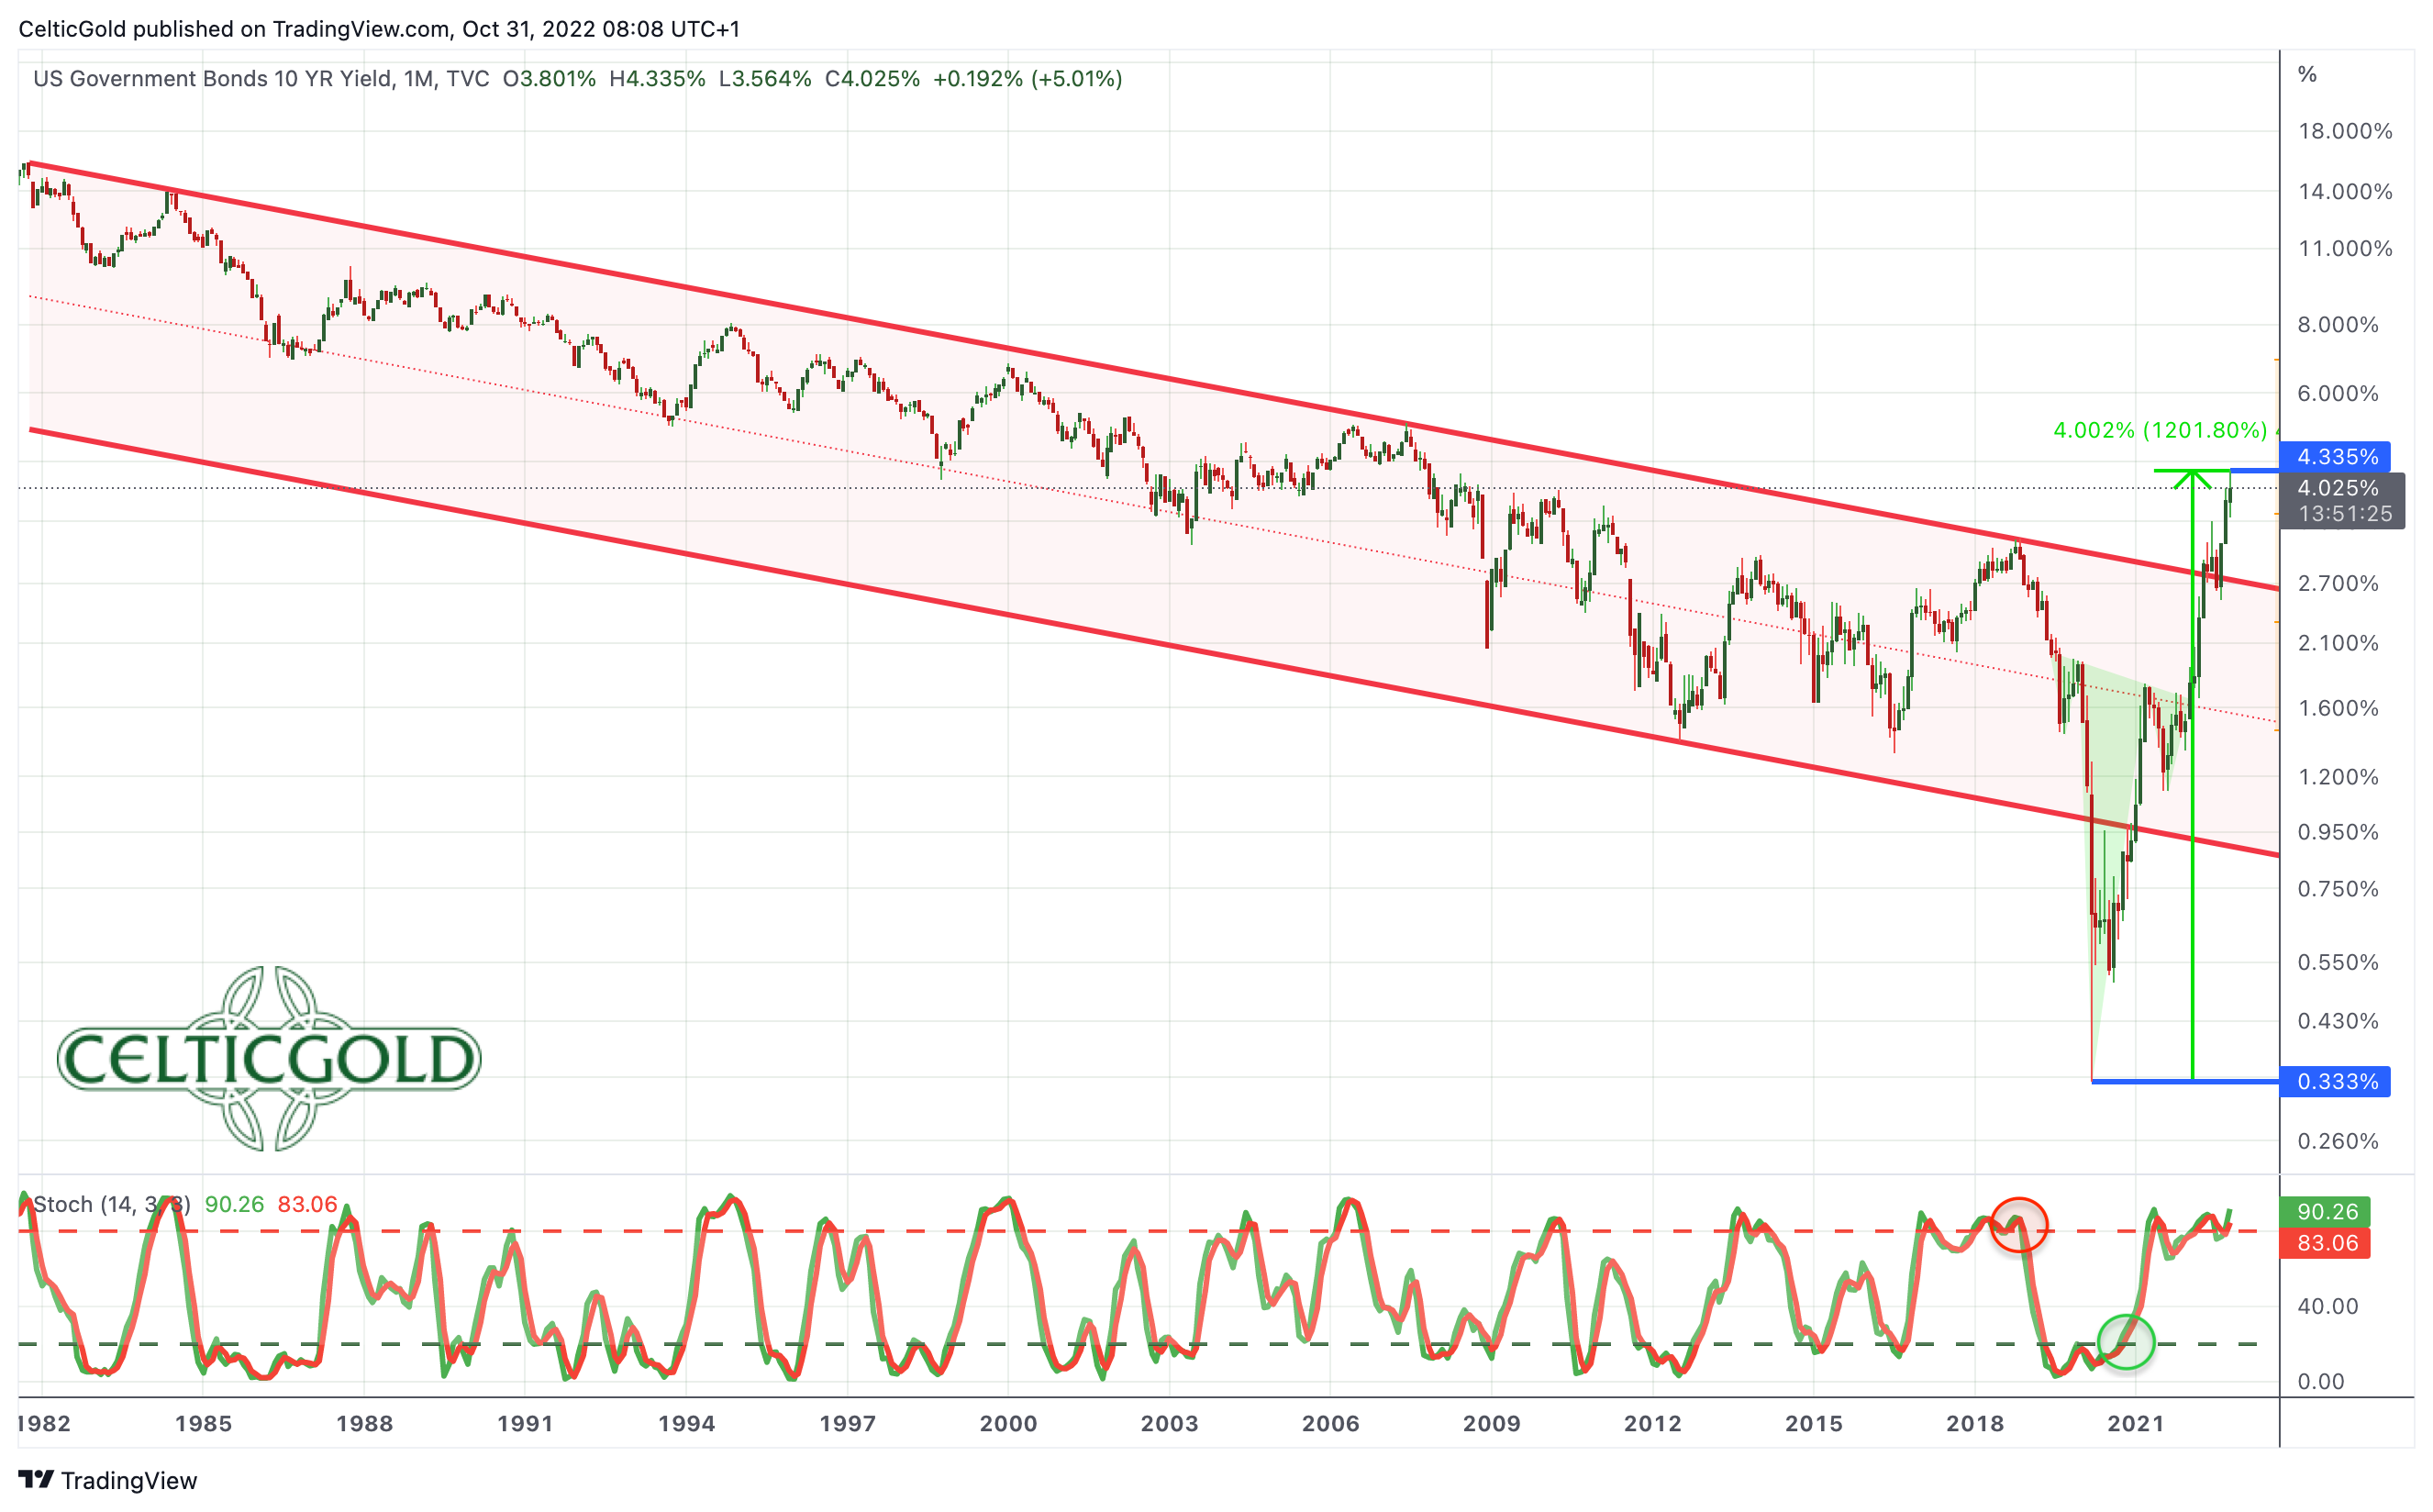 *US Treasury 10-year bond, monthly chart as of October 31st, 2022. Source: Tradingview* The 10-year US Treasury bond yields rose further over the past four weeks, reaching 4.33% before falling back to 3.97% in the last few trading days. 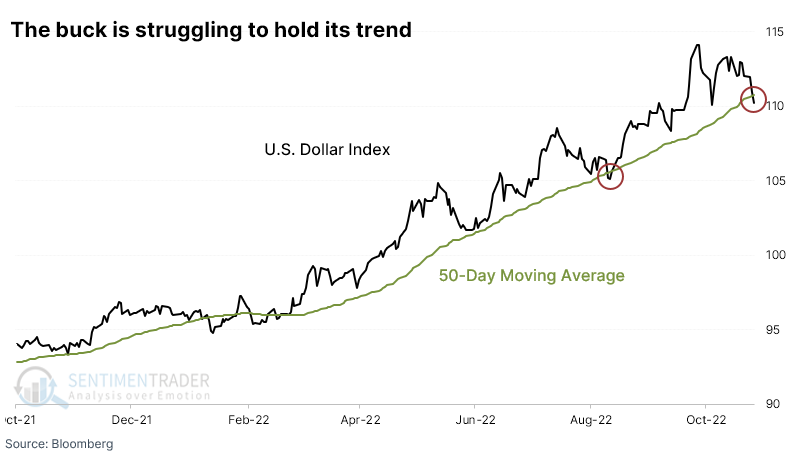 *US Dollar Index as of October 27th, 2022. Source: Sentimenttrader* For the first time since the beginning of the year, the US Dollar also seems to be faltering, as the greenback fell below its 50-day moving average for the first time. Both, the constellation in the futures markets and the sentiment actually speak for a correction in the US Dollar. 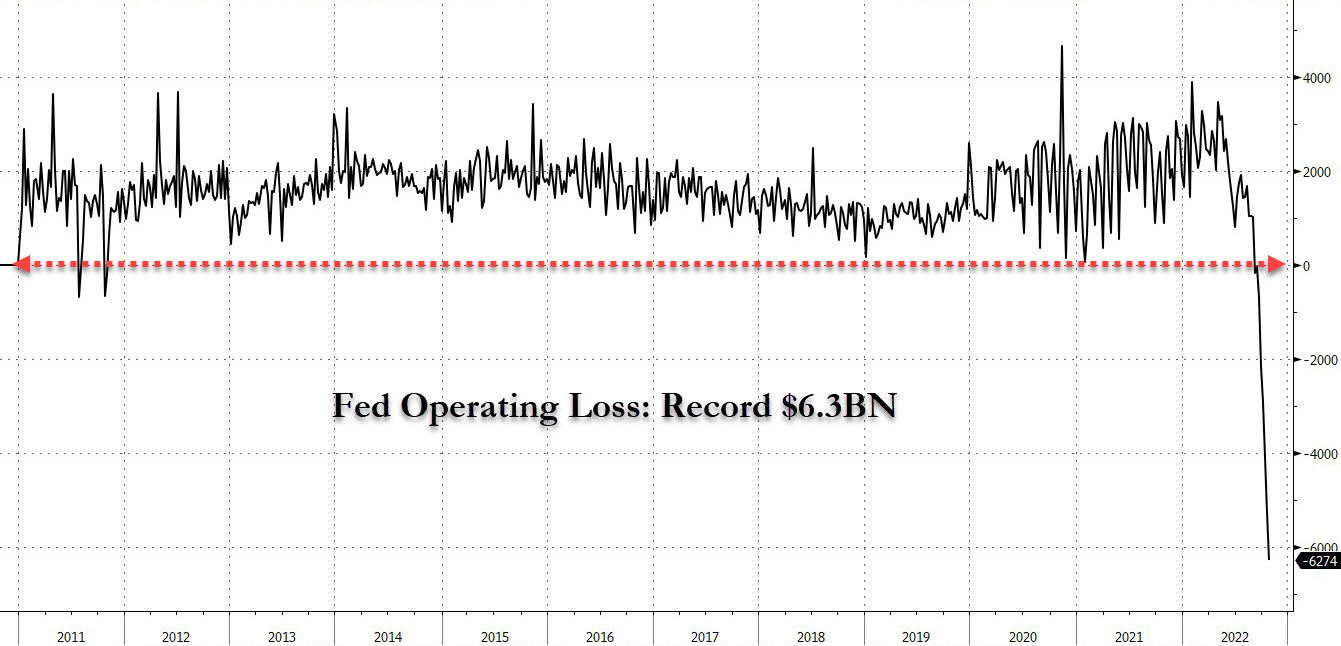 *Federal Reserve Bank Operating Profit or Loss, as of October 28th, 2022. © ZeroHedge* At the same time, the significantly higher interest rates are costing the American central bank a lot of money, because the Fed has to pay over half a billion USD in interest to American and foreign banks every day. The Fed’s operating loss rose to a record 6.3 billion USD last week! Overall, the two major stress factors in financial markets (rising interest rates and a strong US dollar) have calmed down somewhat recently. Signs of a major recovery in the stock markets immediately materialized, but so far this has not been very sustainable for other market sectors. Bitcoin was also able to shoot up to 21,000 USD for a short time. Nevertheless, the situation remains tense and the corrective movement in the US Dollar, which is actually overdue, has not yet been confirmed. However, a recovery around the US congressional elections on November 8th would be overdue in all sectors. It could even turn into a year-end rally. Due to the fragile overall situation, the FED could at least soften its tone a little in this week’s FOMC announcement and thus further fuel a relief rally. Nevertheless, it is still far too early to call the end of the bear market in financial markets. ### Conclusion: Bitcoin – Some chance for a recovery At 20,500 USD, Bitcoin is currently trading around 70% below its all-time high. The last 11 months have been characterized by a brutal downturn, and so far there are no signs of a change in trend. On the contrary, in view of the desolate macro situation, the correction in the crypto sector could be significantly longer, especially in terms of time. Nevertheless, two months before year-end there is at least some chance for a (small) recovery towards around 25,000 USD. Hence, a new attack on the support at around 18,000 USD would not be expected until 2023. _Analysis sponsored and initially published on October 28th, 2022, by [www.celticgold.eu](https://celticgold.de/blog/gold-und-bitcoin-analysen-von-florian-grummes-32/bitcoin-erholungschance-194). Translated into English and partially updated on October 31st, 2022._ _Feel free to join us in our free [Telegram channel](https://t.me/MidasTouchConsulting) for daily real time data and a great community._ _If you like to get regular updates on our gold model, precious metals, commodities, and cryptocurrencies you can subscribe to our [free newsletter](http://bit.ly/1EUdt2K)._ _Disclosure: This article and the content are for informational purposes only and do not contain investment advice or recommendations. Every investment and trading move involves risk, and readers should conduct their own research when making a decision. The views, thoughts, and opinions expressed here are the author’s alone. They do not necessarily reflect or represent the views and opinions of Midas Touch Consulting._ |
| json metadata | {"tags":["leofinance","steemitcryptoacademy","bitcoin","ethereum","cryptocurrency","investing","trading","gold"],"image":["https://cdn.steemitimages.com/DQmZntXw1JT1zkWmSUstf8z15qQYD5hKc2QQdHHSsHXB1QX/celtic-gold-midas-touch-bitcoin-update-header.jpg","https://cdn.steemitimages.com/DQmUP7qzKMEJjV45LfAubqytX3H13an6owexTHWHbPcNPDD/Chart%2001%20Ethereum:Bitcoin-Ratio%20weekly%20chart%2028102022.png","https://cdn.steemitimages.com/DQmfTEWv85bawaip52JQfL1iiytQuCo6gBHJpF14zonxvVR/Chart%2002%20Bitcoin%20weekly%20chart%2031102022.png","https://cdn.steemitimages.com/DQmQyj1bx4DPyVhhPFtmAgo1U9mfe1siJBTvqCR5FexR3RD/Chart%2003%20Bitcoin%20daily%20chart%2031102022.png","https://cdn.steemitimages.com/DQmPg2Foib3fbD5owZXNmG924G9PJrhWot6dd8k957yaWRx/Chart%2004%20Crypto%20Fear%20&%20Greed%20Index%2028102022.png","https://cdn.steemitimages.com/DQmP8e1g5kCib9RsWNbi6bv9mRLGa9VSWYucWNbjxhUtqzh/Chart%2005%20Crypto%20Fear%20&%20Greed%20Index%2028102022.png","https://cdn.steemitimages.com/DQmTeXCKwB544RJqKx6iZ5d8DPG7TygcCAKfmhWX6MyBD2Q/Chart%2006%20Bitcoin%20seasonality%2028102022.png","https://cdn.steemitimages.com/DQmU5wvzSHE24eqQ2JwLXuhYxHdk1csgvGLkF2TkQFj8D4g/Chart%2007%20Bitcoin:Gold-Ratio%20weekly%20chart%2031102022.png","https://cdn.steemitimages.com/DQmQ2bjV5ek1s2w2d3LqdSkUEbxGCFJtxJBdyiiS99dxD9e/Chart%2008%20US%2010-Year%20Bond%2031102022.png","https://cdn.steemitimages.com/DQmeR6kVz3Bf7S7fxiokPbzps61YugbZJCTZUH5fhBh4TSK/Chart%2009%20The%20dollar%20is%20starting%20to%20stumble%2027102022%20.png","https://cdn.steemitimages.com/DQmZxfCV8eCUCPBPpch3xrb26bocsvYqq9rnfVfy4452BB1/Chart%2010%20FED%20weekly%20operative%20gain:loss%2028102022.jpeg"],"links":["https://www.midastouch-consulting.com/31102022-bitcoin-some-chance-for-a-recovery","https://celticgold.de/blog/gold-und-bitcoin-analysen-von-florian-grummes-32/bitcoin-erholungschance-194","https://t.me/MidasTouchConsulting","http://bit.ly/1EUdt2K"],"app":"steemit/0.2","format":"markdown"} |
| parent author | |
| parent permlink | leofinance |
| permlink | october-31st-2022-bitcoin-some-chance-for-a-recovery |
| title | October 31st, 2022, Bitcoin – Some chance for a recovery |
| Transaction Info | Block #69027281/Trx 8c713b698eade40d7765c891e305f38417230c42 |
View Raw JSON Data
{
"block": 69027281,
"op": [
"comment",
{
"author": "midastouch",
"body": " \n\n# [October 31st, 2022, Bitcoin – Some chance for a recovery](https://www.midastouch-consulting.com/31102022-bitcoin-some-chance-for-a-recovery)\n\nBitcoin and the whole crypto sector are in a bear market for nearly a year now. The selloff has been brutal and any recovery has been short-lived. However, in recent months the correction has slowed down, and Bitcoin continues to find support around 18,000 to 20,000 USD. Bitcoin – Some chance for a recovery.\n\n### Review\n\nSince crashing to 17,600 USD in mid-June 2022 Bitcoin prices have only slowly to recovered. Although there was a weak bounce in August to around 25,200 USD, prices have mainly been moving sideways between 18,500 USD and 20,000 USD in recent months.\n\nIf you want to report at least something positive, then it is probably the fact that Bitcoin (BTC), in contrast to stock and bond markets as well as the price of gold, has not marked a new low in the last four months. Instead, it has been able to hold above 18,200 USD since mid-June.\n\n*Ethereum/Bitcoin-Ratio, weekly chart as of October 31st, 2022. Source: Tradingview.*\n\nThe fact that Ethereum (ETH) has developed significantly better than Bitcoin since the crash in June is also interesting and positive. Although there is more than justified criticism of the Ethereum network and Bitcoin is still the only one that deserves the title “decentralized”, the market seems to know more. Nevertheless, in terms of market capitalization, Ethereum still lags far behind Bitcoin.\n\nHowever, the Ethereum/Bitcoin-Ratio makes it clear that Ethereum, which unlike Bitcoin was not designed as a currency and store of value, but for complex smart contracts and decentralized applications, continues to tinker with the breakout against Bitcoin. In fact, due to technological advances, Ethereum now better represents the “blockchain” innovation. And although interest in cryptocurrencies has waned in recent months due to price weakness, Chainanalysis’ Global Index shows that large and long-term crypto investors have held onto their positions.\n\n### Technical Analysis For Bitcoin in US-Dollar\n\n#### Bitcoin Weekly Chart – Still within a clearly defined downtrend channel\n\n*Bitcoin in USD, weekly chart as of October 31st, 2022. Source: Tradingview*\n\nIn the big picture, Bitcoin is currently trading just below the mid-trend line of its large overriding uptrend channel. Despite the 11-month correction, this trend channel is still intact and would only have to be cast aside with prices below around 6,000 USD.\n\nSince November 2021, however, price action has also been taking place in a clearly defined downtrend channel. Here, Bitcoin is currently trading just above the mid-trend line as well. A recovery within the downtrend channel would currently have room to around 27,500 USD.\n\nOverall, the trend on the weekly chart is still pointing downwards, but the tough sideways phase of the last few months could initially be resolved with a counter-trend recovery or a bounce. The oversold stochastic oscillator would be ideally positioned for this. At the same time, one is well advised not to overestimate any recovery movements. It would be better to wait for evidence that the crypto winter is over, because below 18,000 USD there is still a risk of another price slide of around 30-50% looming.\n\n#### Bitcoin Daily Chart – Some chance for a recovery\n\n*Bitcoin in USD, daily chart as of October 31st, 2022. Source: Tradingview*\n\nOn the daily chart, the broad support zone between 18,000 and 20,000 USD has held for the past few weeks. Bitcoin bulls are currently trying to break out to the upside. A first attempt failed on Wednesday, but the upper Bollinger band (20,987 USD) has been bent upwards. This gradually creates more space to the upside.\n\nThe first target of a recovery would be the rapidly falling 200-day moving average (24,569 USD) and would actually be overdue. As well, a rally towards the upper edge of the downtrend channel around 25,000 to 26,000 USD seems possible. However, the stochastic has already reached its overbought zone again. In this respect, it looks more like a tough challenge for the bulls to advance directly. A pullback towards crucial support around 20,000 USD before another rally attempt is therefore likely.\n\nIn summary, the chance for a slightly larger recovery is on the chart. However, prices well above 25,000 USD currently appear rather unrealistic. Nevertheless, if the US dollar actually corrects a little more, Bitcoin and the crypto sector would get a boost.\n\n### Sentiment Bitcoin – Fear has been the norm since the beginning of the year\n\n*Crypto Fear & Greed Index, as of October 28th, 2022. Source: Lookintobitcoin*\n\nThe Crypto Fear & Greed Index is currently sitting at 31 and continues to measure high levels of fear in the crypto sector. This has become the norm since the price collapse at the beginning of the year.\n\n*Crypto Fear & Greed Index long term, as of October 28th, 2022. Source: Lookintobitcoin*\n\nIn the big picture, however, the bombed-out sentiment also provides a contrarian opportunity.\n\n### Seasonality Bitcoin – Strong 4th quarter\n\n*Seasonality for bitcoin, as of October 28th, 2022. Source: Seasonax*\n\nStatistically, Bitcoin had a strong 4th quarter over the past 12 years. Of course, seasonal statistics cannot guarantee future price movements.\n\nNevertheless, the probability of a recovery towards the end of the year is significantly higher from a seasonal perspective.\n\n### Sound Money: Bitcoin vs. Gold\n\n*Bitcoin/Gold-Ratio, weekly chart as of October 31st, 2022. Source: Tradingview*\n\nAt current prices of around 20,500 USD for one bitcoin and around 1,640 USD for one ounce of gold, you have to pay 12.5 ounces of gold for one bitcoin. In other words, an ounce of gold currently costs 0.08 Bitcoin. Just like Bitcoin prices, the Bitcoin/Gold-Ratio has been running sideways for a good four and a half months. A recovery in favor of bitcoin has not yet succeeded. The overarching trend is therefore pointing further south, and the Bitcoin/Gold-Ratio would have to rise above 14 at least to clearly and sustainably break the downtrend.\n\nIn summary, the Bitcoin/Gold-Ratio remains in a downtrend, and continues to consolidate the last major slide in prices with a sideways chop.\n\n### Macro Update – A breather until the congressional elections\n\n*US Treasury 10-year bond, monthly chart as of October 31st, 2022. Source: Tradingview*\n\nThe 10-year US Treasury bond yields rose further over the past four weeks, reaching 4.33% before falling back to 3.97% in the last few trading days.\n\n*US Dollar Index as of October 27th, 2022. Source: Sentimenttrader*\n\nFor the first time since the beginning of the year, the US Dollar also seems to be faltering, as the greenback fell below its 50-day moving average for the first time. Both, the constellation in the futures markets and the sentiment actually speak for a correction in the US Dollar.\n\n*Federal Reserve Bank Operating Profit or Loss, as of October 28th, 2022. © ZeroHedge*\n\nAt the same time, the significantly higher interest rates are costing the American central bank a lot of money, because the Fed has to pay over half a billion USD in interest to American and foreign banks every day. The Fed’s operating loss rose to a record 6.3 billion USD last week!\n\nOverall, the two major stress factors in financial markets (rising interest rates and a strong US dollar) have calmed down somewhat recently. Signs of a major recovery in the stock markets immediately materialized, but so far this has not been very sustainable for other market sectors. Bitcoin was also able to shoot up to 21,000 USD for a short time. Nevertheless, the situation remains tense and the corrective movement in the US Dollar, which is actually overdue, has not yet been confirmed.\n\nHowever, a recovery around the US congressional elections on November 8th would be overdue in all sectors. It could even turn into a year-end rally. Due to the fragile overall situation, the FED could at least soften its tone a little in this week’s FOMC announcement and thus further fuel a relief rally. Nevertheless, it is still far too early to call the end of the bear market in financial markets.\n\n### Conclusion: Bitcoin – Some chance for a recovery\n\nAt 20,500 USD, Bitcoin is currently trading around 70% below its all-time high. The last 11 months have been characterized by a brutal downturn, and so far there are no signs of a change in trend. On the contrary, in view of the desolate macro situation, the correction in the crypto sector could be significantly longer, especially in terms of time. Nevertheless, two months before year-end there is at least some chance for a (small) recovery towards around 25,000 USD. Hence, a new attack on the support at around 18,000 USD would not be expected until 2023.\n\n_Analysis sponsored and initially published on October 28th, 2022, by [www.celticgold.eu](https://celticgold.de/blog/gold-und-bitcoin-analysen-von-florian-grummes-32/bitcoin-erholungschance-194). Translated into English and partially updated on October 31st, 2022._\n\n_Feel free to join us in our free [Telegram channel](https://t.me/MidasTouchConsulting) for daily real time data and a great community._ \n\n_If you like to get regular updates on our gold model, precious metals, commodities, and cryptocurrencies you can subscribe to our [free newsletter](http://bit.ly/1EUdt2K)._ \n\n_Disclosure: This article and the content are for informational purposes only and do not contain investment advice or recommendations. Every investment and trading move involves risk, and readers should conduct their own research when making a decision. The views, thoughts, and opinions expressed here are the author’s alone. They do not necessarily reflect or represent the views and opinions of Midas Touch Consulting._",
"json_metadata": "{\"tags\":[\"leofinance\",\"steemitcryptoacademy\",\"bitcoin\",\"ethereum\",\"cryptocurrency\",\"investing\",\"trading\",\"gold\"],\"image\":[\"https://cdn.steemitimages.com/DQmZntXw1JT1zkWmSUstf8z15qQYD5hKc2QQdHHSsHXB1QX/celtic-gold-midas-touch-bitcoin-update-header.jpg\",\"https://cdn.steemitimages.com/DQmUP7qzKMEJjV45LfAubqytX3H13an6owexTHWHbPcNPDD/Chart%2001%20Ethereum:Bitcoin-Ratio%20weekly%20chart%2028102022.png\",\"https://cdn.steemitimages.com/DQmfTEWv85bawaip52JQfL1iiytQuCo6gBHJpF14zonxvVR/Chart%2002%20Bitcoin%20weekly%20chart%2031102022.png\",\"https://cdn.steemitimages.com/DQmQyj1bx4DPyVhhPFtmAgo1U9mfe1siJBTvqCR5FexR3RD/Chart%2003%20Bitcoin%20daily%20chart%2031102022.png\",\"https://cdn.steemitimages.com/DQmPg2Foib3fbD5owZXNmG924G9PJrhWot6dd8k957yaWRx/Chart%2004%20Crypto%20Fear%20&%20Greed%20Index%2028102022.png\",\"https://cdn.steemitimages.com/DQmP8e1g5kCib9RsWNbi6bv9mRLGa9VSWYucWNbjxhUtqzh/Chart%2005%20Crypto%20Fear%20&%20Greed%20Index%2028102022.png\",\"https://cdn.steemitimages.com/DQmTeXCKwB544RJqKx6iZ5d8DPG7TygcCAKfmhWX6MyBD2Q/Chart%2006%20Bitcoin%20seasonality%2028102022.png\",\"https://cdn.steemitimages.com/DQmU5wvzSHE24eqQ2JwLXuhYxHdk1csgvGLkF2TkQFj8D4g/Chart%2007%20Bitcoin:Gold-Ratio%20weekly%20chart%2031102022.png\",\"https://cdn.steemitimages.com/DQmQ2bjV5ek1s2w2d3LqdSkUEbxGCFJtxJBdyiiS99dxD9e/Chart%2008%20US%2010-Year%20Bond%2031102022.png\",\"https://cdn.steemitimages.com/DQmeR6kVz3Bf7S7fxiokPbzps61YugbZJCTZUH5fhBh4TSK/Chart%2009%20The%20dollar%20is%20starting%20to%20stumble%2027102022%20.png\",\"https://cdn.steemitimages.com/DQmZxfCV8eCUCPBPpch3xrb26bocsvYqq9rnfVfy4452BB1/Chart%2010%20FED%20weekly%20operative%20gain:loss%2028102022.jpeg\"],\"links\":[\"https://www.midastouch-consulting.com/31102022-bitcoin-some-chance-for-a-recovery\",\"https://celticgold.de/blog/gold-und-bitcoin-analysen-von-florian-grummes-32/bitcoin-erholungschance-194\",\"https://t.me/MidasTouchConsulting\",\"http://bit.ly/1EUdt2K\"],\"app\":\"steemit/0.2\",\"format\":\"markdown\"}",
"parent_author": "",
"parent_permlink": "leofinance",
"permlink": "october-31st-2022-bitcoin-some-chance-for-a-recovery",
"title": "October 31st, 2022, Bitcoin – Some chance for a recovery"
}
],
"op_in_trx": 0,
"timestamp": "2022-10-31T11:44:18",
"trx_id": "8c713b698eade40d7765c891e305f38417230c42",
"trx_in_block": 0,
"virtual_op": 0
}midastouchreceived 0.094 STEEM, 0.104 SP author reward for @midastouch / october-22nd-2022-gold-in-search-of-a-bottom2022/10/30 08:49:54
midastouchreceived 0.094 STEEM, 0.104 SP author reward for @midastouch / october-22nd-2022-gold-in-search-of-a-bottom
2022/10/30 08:49:54
| author | midastouch |
| permlink | october-22nd-2022-gold-in-search-of-a-bottom |
| sbd payout | 0.000 SBD |
| steem payout | 0.094 STEEM |
| vesting payout | 168.632921 VESTS |
| Transaction Info | Block #68995133/Virtual Operation #3 |
View Raw JSON Data
{
  "block": 68995133,
  "op": [
    "author_reward",
    {
      "author": "midastouch",
      "permlink": "october-22nd-2022-gold-in-search-of-a-bottom",
      "sbd_payout": "0.000 SBD",
      "steem_payout": "0.094 STEEM",
      "vesting_payout": "168.632921 VESTS"
    }
  ],
  "op_in_trx": 0,
  "timestamp": "2022-10-30T08:49:54",
  "trx_id": "0000000000000000000000000000000000000000",
  "trx_in_block": 4294967295,
  "virtual_op": 3
}pocket-changeupvoted (100.00%) @midastouch / october-22nd-2022-gold-in-search-of-a-bottom2022/10/23 12:17:21
pocket-changeupvoted (100.00%) @midastouch / october-22nd-2022-gold-in-search-of-a-bottom
2022/10/23 12:17:21
| author | midastouch |
| permlink | october-22nd-2022-gold-in-search-of-a-bottom |
| voter | pocket-change |
| weight | 10000 (100.00%) |
| Transaction Info | Block #68798723/Trx 22aaf32c76444c445c95b84b4042c3b928a9b722 |
View Raw JSON Data
{
  "block": 68798723,
  "op": [
    "vote",
    {
      "author": "midastouch",
      "permlink": "october-22nd-2022-gold-in-search-of-a-bottom",
      "voter": "pocket-change",
      "weight": 10000
    }
  ],
  "op_in_trx": 0,
  "timestamp": "2022-10-23T12:17:21",
  "trx_id": "22aaf32c76444c445c95b84b4042c3b928a9b722",
  "trx_in_block": 12,
  "virtual_op": 0
}pocket-changereplied to @midastouch / rk7gqd2022/10/23 12:15:48
pocket-changereplied to @midastouch / rk7gqd
2022/10/23 12:15:48
| author | pocket-change |
| body | If measured in Fiat USD's, I figure the Melt Value of Silver will reach as high as 900 Fiat USD's per ounce, and the Melt Value of Gold will reach as high as 9,000 Fiat USD's per ounce... If measured in our Corrected U.S. Silver and Gold Coinage, the Melt Value of Silver will reach as high as $9 per ounce and the Melt Value of Gold will reach as high as $90 per ounce... |
| json metadata | {"app":"steemit/0.2"} |
| parent author | midastouch |
| parent permlink | october-22nd-2022-gold-in-search-of-a-bottom |
| permlink | rk7gqd |
| title | |
| Transaction Info | Block #68798692/Trx 668ef8093f1d4f2101a5b2c595b9e458f34cb339 |
View Raw JSON Data
{
  "block": 68798692,
  "op": [
    "comment",
    {
      "author": "pocket-change",
      "body": "If measured in Fiat USD's, I figure the Melt Value of Silver will reach as high as 900 Fiat USD's per ounce, and the Melt Value of Gold will reach as high as 9,000 Fiat USD's per ounce...\n\nIf measured in our Corrected U.S. Silver and Gold Coinage, the Melt Value of Silver will reach as high as $9 per ounce and the Melt Value of Gold will reach as high as $90 per ounce...",
      "json_metadata": "{\"app\":\"steemit/0.2\"}",
      "parent_author": "midastouch",
      "parent_permlink": "october-22nd-2022-gold-in-search-of-a-bottom",
      "permlink": "rk7gqd",
      "title": ""
    }
  ],
  "op_in_trx": 0,
  "timestamp": "2022-10-23T12:15:48",
  "trx_id": "668ef8093f1d4f2101a5b2c595b9e458f34cb339",
  "trx_in_block": 12,
  "virtual_op": 0
}midastouchupvoted (100.00%) @midastouch / october-22nd-2022-gold-in-search-of-a-bottom2022/10/23 08:58:54
midastouchupvoted (100.00%) @midastouch / october-22nd-2022-gold-in-search-of-a-bottom
2022/10/23 08:58:54
| author | midastouch |
| permlink | october-22nd-2022-gold-in-search-of-a-bottom |
| voter | midastouch |
| weight | 10000 (100.00%) |
| Transaction Info | Block #68794770/Trx ed1b8aa786697df134fcadd48e52458b21d1e84a |
View Raw JSON Data
{
  "block": 68794770,
  "op": [
    "vote",
    {
      "author": "midastouch",
      "permlink": "october-22nd-2022-gold-in-search-of-a-bottom",
      "voter": "midastouch",
      "weight": 10000
    }
  ],
  "op_in_trx": 0,
  "timestamp": "2022-10-23T08:58:54",
  "trx_id": "ed1b8aa786697df134fcadd48e52458b21d1e84a",
  "trx_in_block": 2,
  "virtual_op": 0
}midastouchupdated their account properties2022/10/23 08:58:54
midastouchupdated their account properties
2022/10/23 08:58:54
| account | midastouch |
| extensions | [] |
| json metadata | |
| posting json metadata | {"profile":{"name":"MidasTouchConsulting","location":"Munich","about":"Our mission is to help investor and traders to become profitable & wealthy","website":"https://www.midastouch-consulting.com","cover_image":"https://cdn.steemitimages.com/DQmWE9M5BHdDJYiSU9SXgJsQ6FxpXZPAeEpMaSuc3B38TsS/Bitcoin%20&%20Gold.jpg","profile_image":"https://postimg.org/image/eqeafo8d7/","version":2}} |
| Transaction Info | Block #68794770/Trx 91b84a0bc6aac29311853231abbe57484705b566 |
View Raw JSON Data
{
  "block": 68794770,
  "op": [
    "account_update2",
    {
      "account": "midastouch",
      "extensions": [],
      "json_metadata": "",
      "posting_json_metadata": "{\"profile\":{\"name\":\"MidasTouchConsulting\",\"location\":\"Munich\",\"about\":\"Our mission is to help investor and traders to become profitable & wealthy\",\"website\":\"https://www.midastouch-consulting.com\",\"cover_image\":\"https://cdn.steemitimages.com/DQmWE9M5BHdDJYiSU9SXgJsQ6FxpXZPAeEpMaSuc3B38TsS/Bitcoin%20&%20Gold.jpg\",\"profile_image\":\"https://postimg.org/image/eqeafo8d7/\",\"version\":2}}"
    }
  ],
  "op_in_trx": 0,
  "timestamp": "2022-10-23T08:58:54",
  "trx_id": "91b84a0bc6aac29311853231abbe57484705b566",
  "trx_in_block": 1,
  "virtual_op": 0
}midastouchupdated their account properties2022/10/23 08:58:39
midastouchupdated their account properties
2022/10/23 08:58:39
| account | midastouch |
| extensions | [] |
| json metadata | |
| posting json metadata | {"profile":{"name":"MidasTouchConsulting","location":"Munich","about":"Our mission is to help investor and traders to become profitable & wealthy","website":"https://www.midastouch-consulting.com","cover_image":"https://postimg.org/image/eqeafo8d7/","profile_image":"https://postimg.org/image/eqeafo8d7/","version":2}} |
| Transaction Info | Block #68794765/Trx 598fa6320b053999527f1423b6b046cb61f7840e |
View Raw JSON Data
{
  "block": 68794765,
  "op": [
    "account_update2",
    {
      "account": "midastouch",
      "extensions": [],
      "json_metadata": "",
      "posting_json_metadata": "{\"profile\":{\"name\":\"MidasTouchConsulting\",\"location\":\"Munich\",\"about\":\"Our mission is to help investor and traders to become profitable & wealthy\",\"website\":\"https://www.midastouch-consulting.com\",\"cover_image\":\"https://postimg.org/image/eqeafo8d7/\",\"profile_image\":\"https://postimg.org/image/eqeafo8d7/\",\"version\":2}}"
    }
  ],
  "op_in_trx": 0,
  "timestamp": "2022-10-23T08:58:39",
  "trx_id": "598fa6320b053999527f1423b6b046cb61f7840e",
  "trx_in_block": 0,
  "virtual_op": 0
}midastouchupdated their account properties2022/10/23 08:57:54
midastouchupdated their account properties
2022/10/23 08:57:54
| account | midastouch |
| extensions | [] |
| json metadata | |
| posting json metadata | {"profile":{"name":"MidasTouchConsulting","location":"Munich","about":"Our mission is to help investor and traders to become profitable & wealthy","website":"https://www.midastouch-consulting.com","cover_image":"https://cdn.steemitimages.com/DQmWE9M5BHdDJYiSU9SXgJsQ6FxpXZPAeEpMaSuc3B38TsS/Bitcoin%20&%20Gold.jpg","profile_image":"https://postimg.org/image/eqeafo8d7/","version":2}} |
| Transaction Info | Block #68794750/Trx 6d6845e04f879591324aa9c93566f959e2412734 |
View Raw JSON Data
{
  "block": 68794750,
  "op": [
    "account_update2",
    {
      "account": "midastouch",
      "extensions": [],
      "json_metadata": "",
      "posting_json_metadata": "{\"profile\":{\"name\":\"MidasTouchConsulting\",\"location\":\"Munich\",\"about\":\"Our mission is to help investor and traders to become profitable & wealthy\",\"website\":\"https://www.midastouch-consulting.com\",\"cover_image\":\"https://cdn.steemitimages.com/DQmWE9M5BHdDJYiSU9SXgJsQ6FxpXZPAeEpMaSuc3B38TsS/Bitcoin%20&%20Gold.jpg\",\"profile_image\":\"https://postimg.org/image/eqeafo8d7/\",\"version\":2}}"
    }
  ],
  "op_in_trx": 0,
  "timestamp": "2022-10-23T08:57:54",
  "trx_id": "6d6845e04f879591324aa9c93566f959e2412734",
  "trx_in_block": 0,
  "virtual_op": 0
}midastouchupdated their account properties2022/10/23 08:57:12
midastouchupdated their account properties
2022/10/23 08:57:12
| account | midastouch |
| extensions | [] |
| json metadata | |
| posting json metadata | {"profile":{"name":"MidasTouchConsulting","location":"Munich","about":"Our mission is to help investor and traders to become profitable & wealthy","website":"https://www.midastouch-consulting.com","cover_image":"https://images.hive.blog/DQmWE9M5BHdDJYiSU9SXgJsQ6FxpXZPAeEpMaSuc3B38TsS/Bitcoin%20&%20Gold.jpg","profile_image":"https://postimg.org/image/eqeafo8d7/","version":2}} |
| Transaction Info | Block #68794736/Trx 30f13262df163fa8be83ec2ac3a1f2c2e895f1b1 |
View Raw JSON Data
{
  "block": 68794736,
  "op": [
    "account_update2",
    {
      "account": "midastouch",
      "extensions": [],
      "json_metadata": "",
      "posting_json_metadata": "{\"profile\":{\"name\":\"MidasTouchConsulting\",\"location\":\"Munich\",\"about\":\"Our mission is to help investor and traders to become profitable & wealthy\",\"website\":\"https://www.midastouch-consulting.com\",\"cover_image\":\"https://images.hive.blog/DQmWE9M5BHdDJYiSU9SXgJsQ6FxpXZPAeEpMaSuc3B38TsS/Bitcoin%20&%20Gold.jpg\",\"profile_image\":\"https://postimg.org/image/eqeafo8d7/\",\"version\":2}}"
    }
  ],
  "op_in_trx": 0,
  "timestamp": "2022-10-23T08:57:12",
  "trx_id": "30f13262df163fa8be83ec2ac3a1f2c2e895f1b1",
  "trx_in_block": 1,
  "virtual_op": 0
}midastouchclaimed reward balance: 0.070 STEEM, 0.008 SBD, 0.113 SP2022/10/23 08:56:24
midastouchclaimed reward balance: 0.070 STEEM, 0.008 SBD, 0.113 SP
2022/10/23 08:56:24
| account | midastouch |
| reward sbd | 0.008 SBD |
| reward steem | 0.070 STEEM |
| reward vests | 183.415046 VESTS |
| Transaction Info | Block #68794720/Trx 40b131fc17f5cf361b8b2f061a7297cf5be25a1e |
View Raw JSON Data
{
  "block": 68794720,
  "op": [
    "claim_reward_balance",
    {
      "account": "midastouch",
      "reward_sbd": "0.008 SBD",
      "reward_steem": "0.070 STEEM",
      "reward_vests": "183.415046 VESTS"
    }
  ],
  "op_in_trx": 0,
  "timestamp": "2022-10-23T08:56:24",
  "trx_id": "40b131fc17f5cf361b8b2f061a7297cf5be25a1e",
  "trx_in_block": 0,
  "virtual_op": 0
}alexmove.witnesssent 0.001 STEEM to @midastouch- "Please support me @alexmove.witness as witness on site https://steemitwallet.com/~witnesses. I send daily Witness vote STEEM reward and voted for some posts of those who voted. Your vote is very impor..."2022/10/23 08:51:03
alexmove.witnesssent 0.001 STEEM to @midastouch- "Please support me @alexmove.witness as witness on site https://steemitwallet.com/~witnesses. I send daily Witness vote STEEM reward and voted for some posts of those who voted. Your vote is very impor..."
2022/10/23 08:51:03
| amount | 0.001 STEEM |
| from | alexmove.witness |
| memo | Please support me @alexmove.witness as witness on site https://steemitwallet.com/~witnesses. I send daily Witness vote STEEM reward and voted for some posts of those who voted. Your vote is very important to me, midastouch! Good luck! 20221023 |
| to | midastouch |
| Transaction Info | Block #68794613/Trx eb1106e1ea47170b62bb90e5da9c22012f21dc1d |
View Raw JSON Data
{
  "block": 68794613,
  "op": [
    "transfer",
    {
      "amount": "0.001 STEEM",
      "from": "alexmove.witness",
      "memo": "Please support me @alexmove.witness as witness on site https://steemitwallet.com/~witnesses. I send daily Witness vote STEEM reward and voted for some posts of those who voted. Your vote is very important to me, midastouch! Good luck! 20221023",
      "to": "midastouch"
    }
  ],
  "op_in_trx": 0,
  "timestamp": "2022-10-23T08:51:03",
  "trx_id": "eb1106e1ea47170b62bb90e5da9c22012f21dc1d",
  "trx_in_block": 6,
  "virtual_op": 0
}midastouchpublished a new post: october-22nd-2022-gold-in-search-of-a-bottom2022/10/23 08:49:54
midastouchpublished a new post: october-22nd-2022-gold-in-search-of-a-bottom
2022/10/23 08:49:54
| author | midastouch |
| body |  # [October 22nd, 2022: Gold – In search of a bottom](https://www.midastouch-consulting.com/22102022-gold-in-search-of-a-bottom) In our last in-depth gold analysis we saw gold on the brink of the abyss and feared that the support around 1,680 USD would not hold. Indeed, two weeks later gold broke through this support and the following sell-off only stopped at 1,615 USD. Gold – In search of a bottom. ### Review With the early failure of the summer rally at 1,807 USD, the outlook for the gold market quickly deteriorated again since mid-August. As a result, the bears were able to push gold prices without much resistance below the important support at 1,680 USD. This mark had withstood all attacks for the past two and a half years. In a miserable overall market environment, gold bulls were no longer able to defend this zone, hence gold prices sold off to 1,615 USD at the end of September, reaching their lowest level since April 2020. From the March high at 2,070 USD, gold has lost around 455 USD or almost 22% in just under seven months! In Euro, however, the picture looks much better. The weak Euro ensured that the price of gold in Euros can still show a small plus of 3.75% year-to-date. In a desolate 2022 for European equity and bond investors, gold brought at least some stabilization into a diversified portfolio. 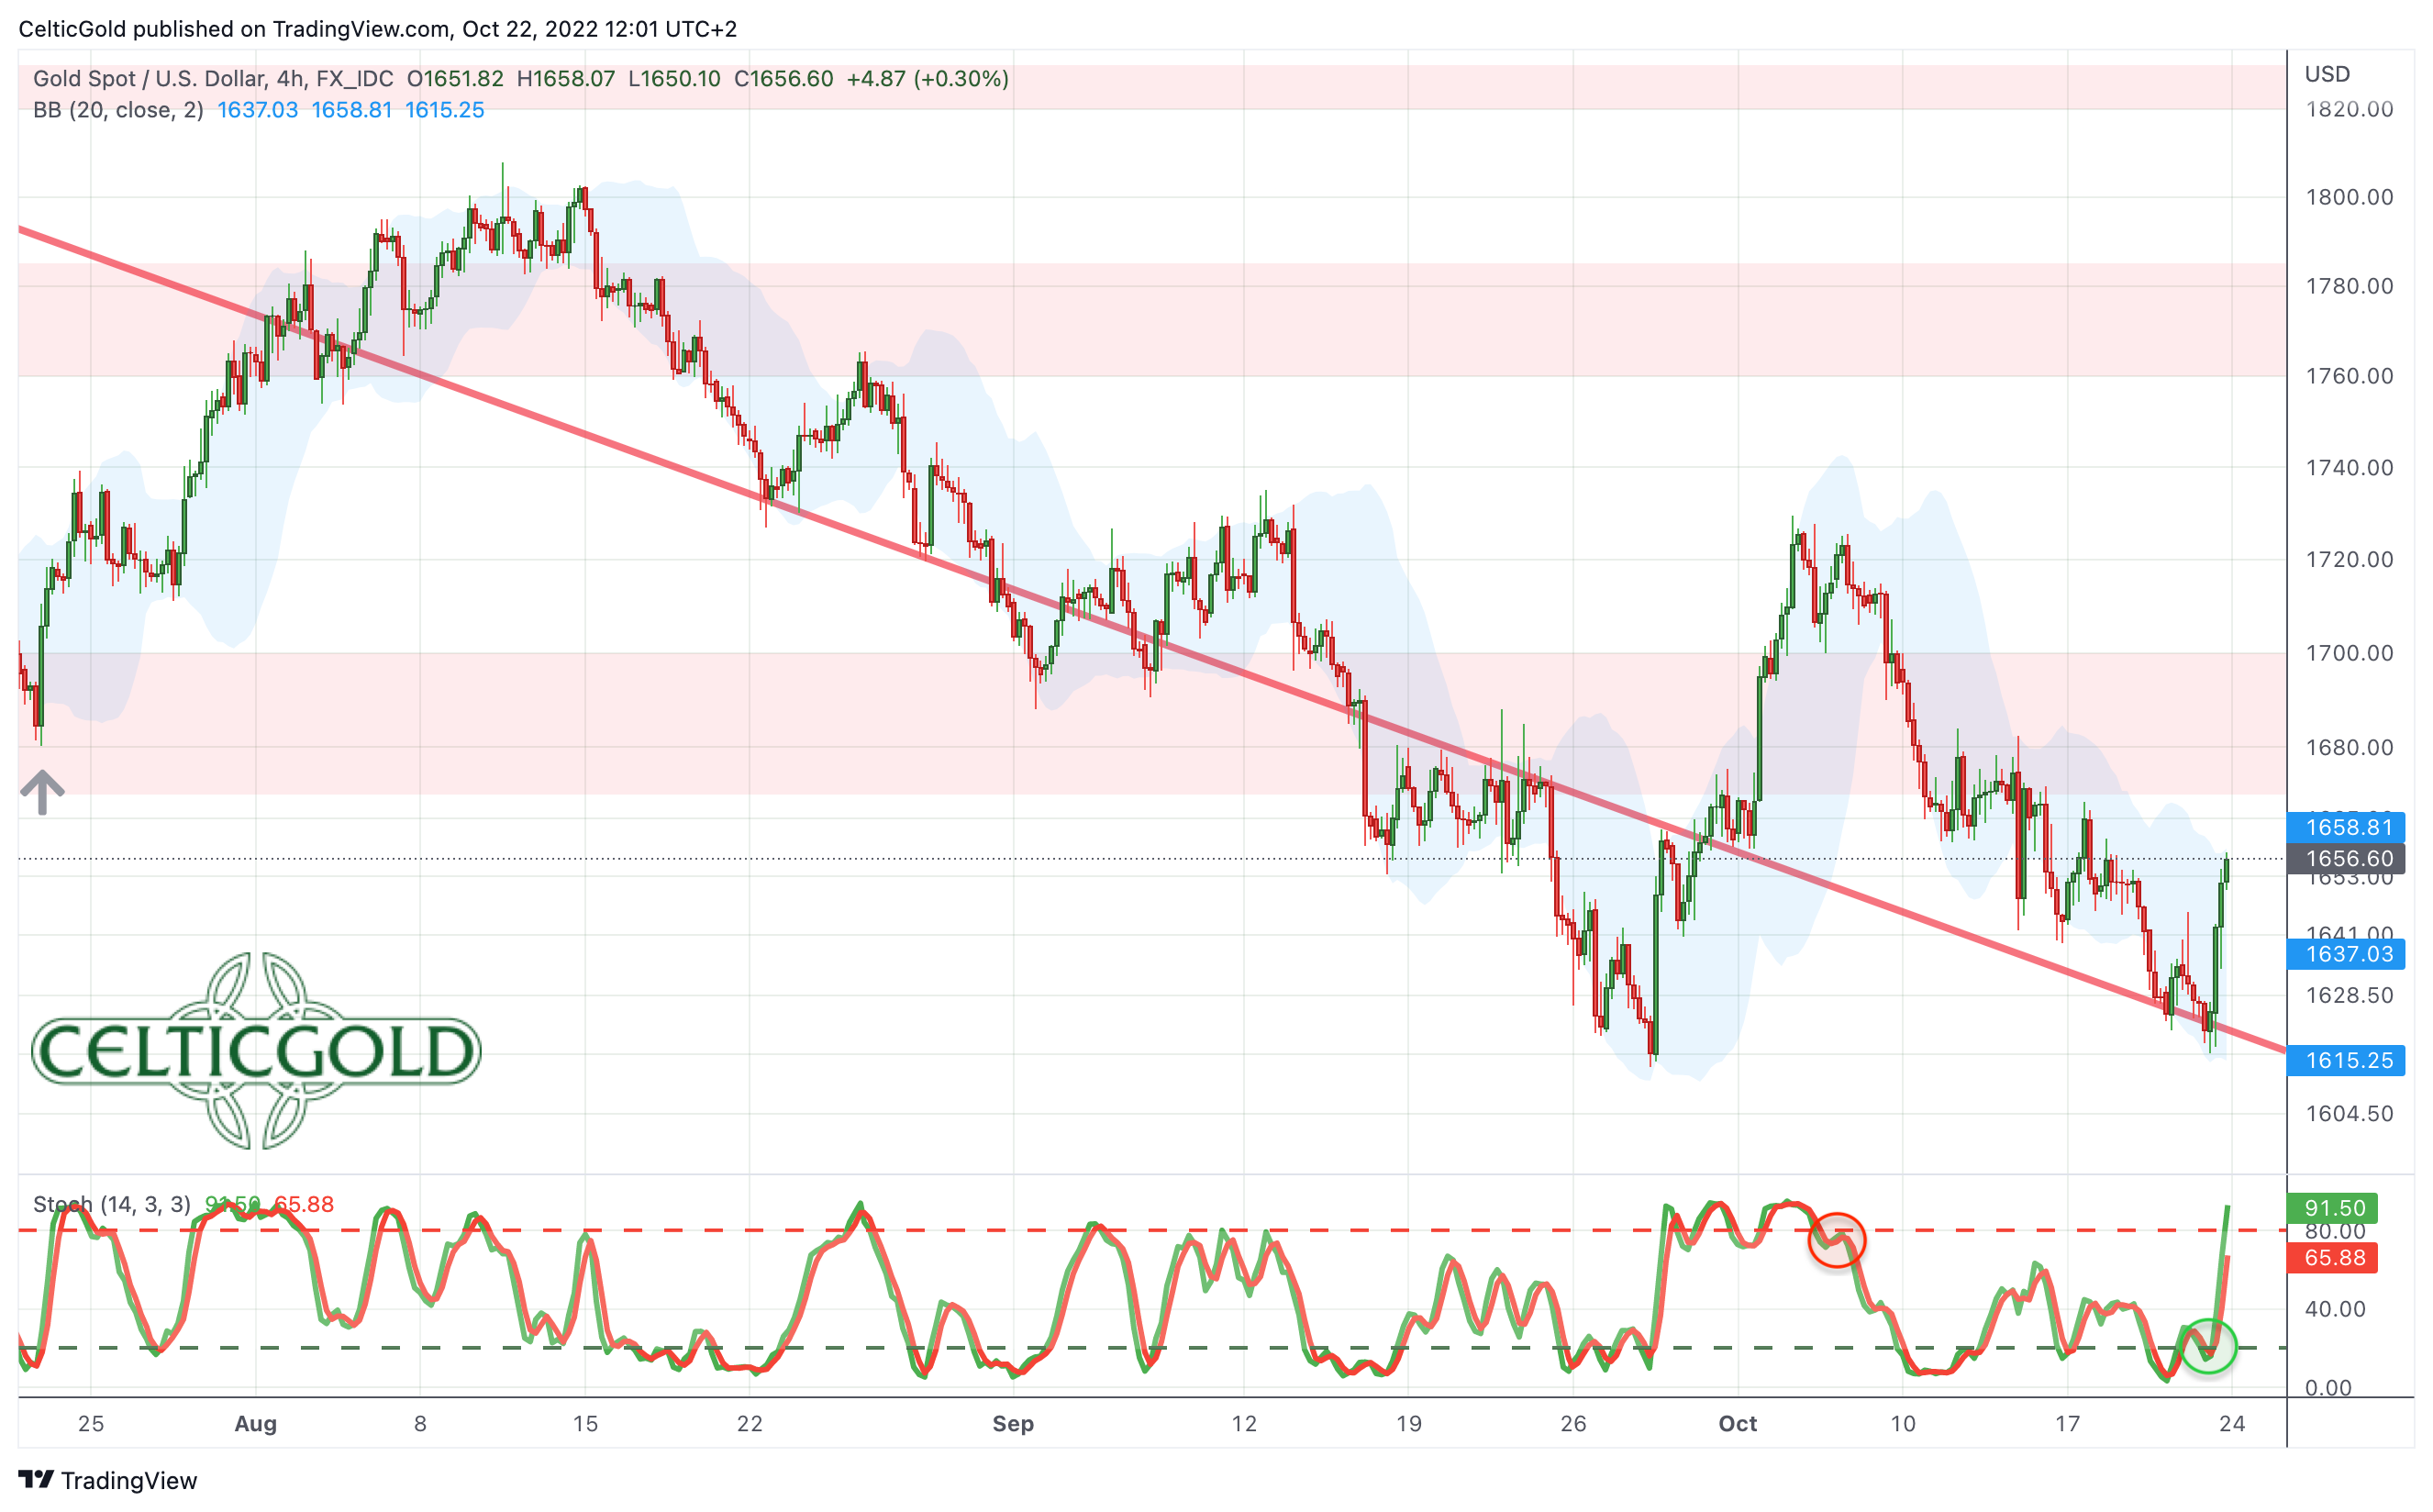 *Gold in US-Dollar, 4-hour chart as of October 22nd, 2022. Source: Tradingview* With the emergency intervention by the British central bank to support the imploding bond market, gold violently turned around on September 28th, and was able to recover significantly to 1,729 USD within just five trading days. However, this recovery didn’t last long, as bears have pushed gold prices lower again over the past three weeks. Trading very close to the September low, a renewed recovery attempt could start any time. Given the heavily oversold situation and the beaten down sentiment, the chances of a larger recovery are not that bad. #### All sectors remain in a severe bear market Nevertheless, nothing has changed in the bigger picture as all sectors remain in a severe bear market. The continued strength of the US-Dollar, combined with rising US interest rates, is putting all asset classes under enormous pressure and further withdraws liquidity from the markets. It’s a vicious circle that is likely to continue until credit markets freeze, at which point the Federal Reserve will be forced to make a radical change in their money policy. ### Chart Analysis Gold in US Dollars #### Weekly chart: The support at 1,680 USD has been clearly broken 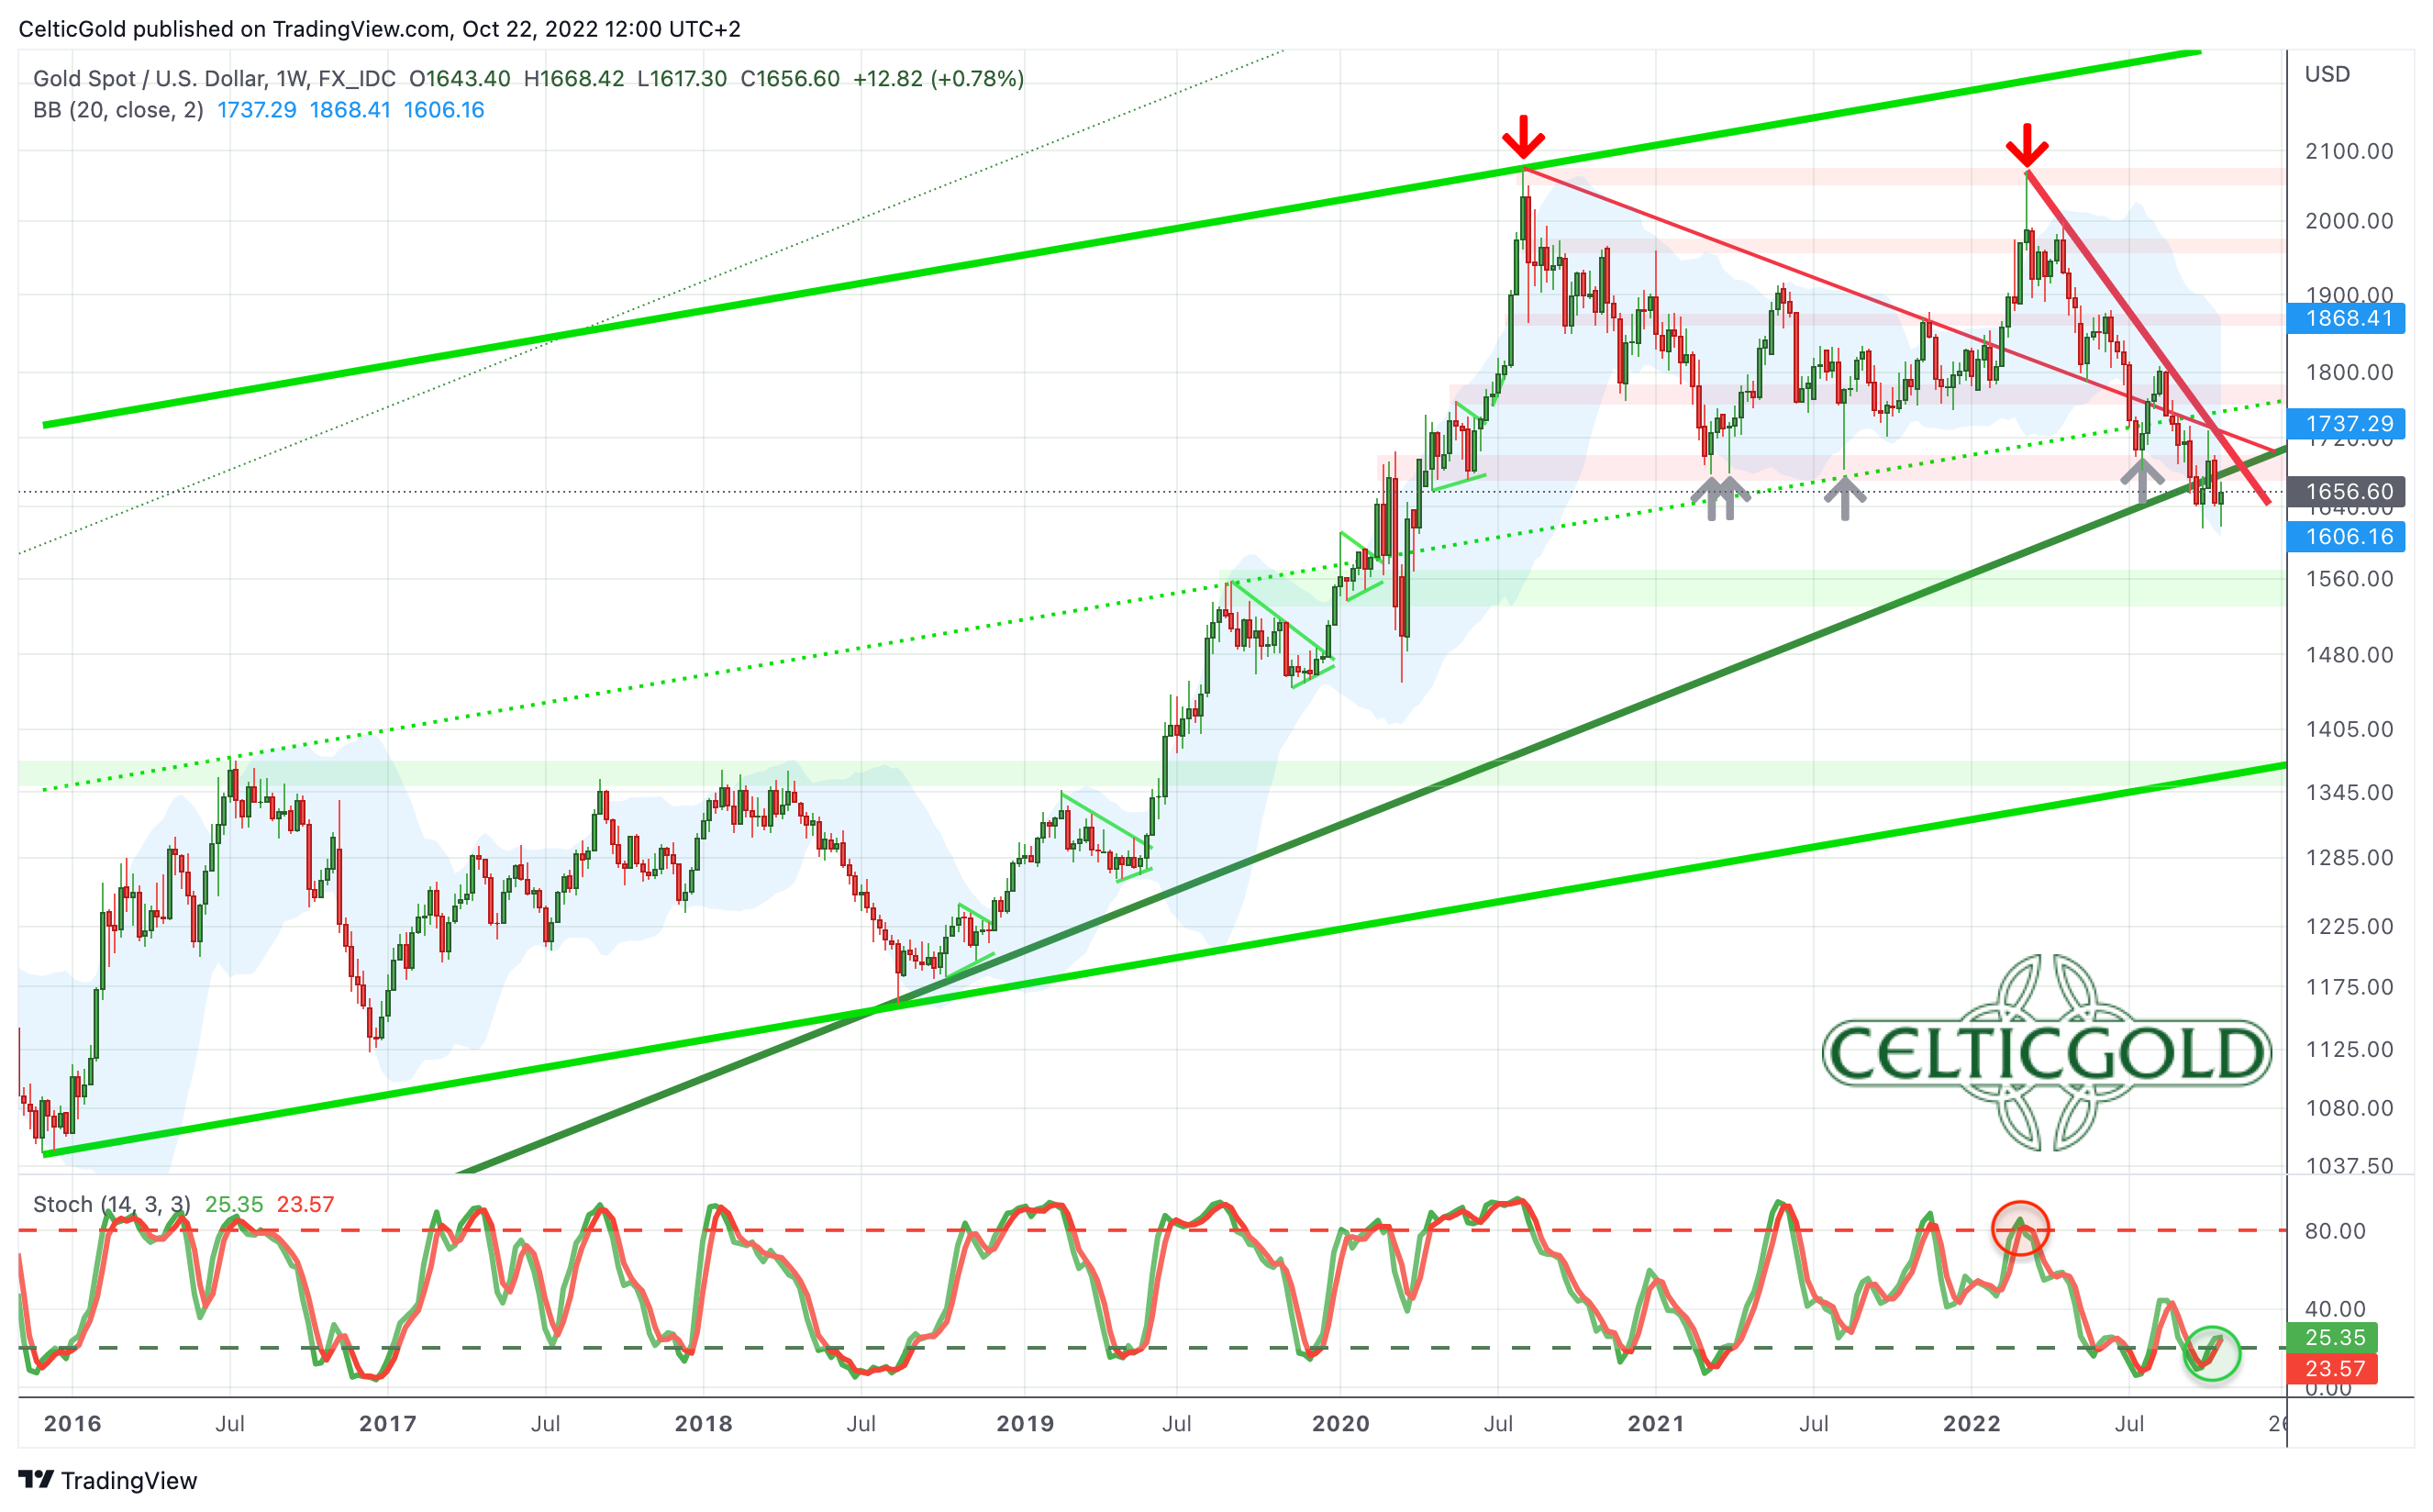 *Gold in US-Dollar, weekly chart as of October 22nd, 2022. Source: Tradingview* As feared, the support at 1,680 USD no longer withstood the pressure from the bears on their fifth attempt. Although the breakthrough was not very quick, the situation is clear. Gold prices are trading at their lowest levels since March 2020 and bullish signals are in nowhere in sight. At least, the stochastic oscillator on the weekly chart is heavily oversold. But apart from the already broken lower edge of the long-term uptrend, there are no significant supports down to the area around 1,530 to USD 1,570. The absolute “worst case” scenario remains a pullback towards around 1,350 USD. On the way up, the bulls must first clear the former support around 1,680 USD to provide an initial signal of a trend reversal. So far, this has not been successful and the resistance zone around 1,680 USD is now being additionally strengthened with two crossing trend lines. Overall, the weekly chart is bearish. From a trend follower perspective, lower prices below the round number of 1,600 USD would therefore be the next logical step. At the same time, however, the technical situation is extremely oversold and a bet on lower prices no longer has a good risk/reward-ratio. #### Daily chart: Clearly oversold again 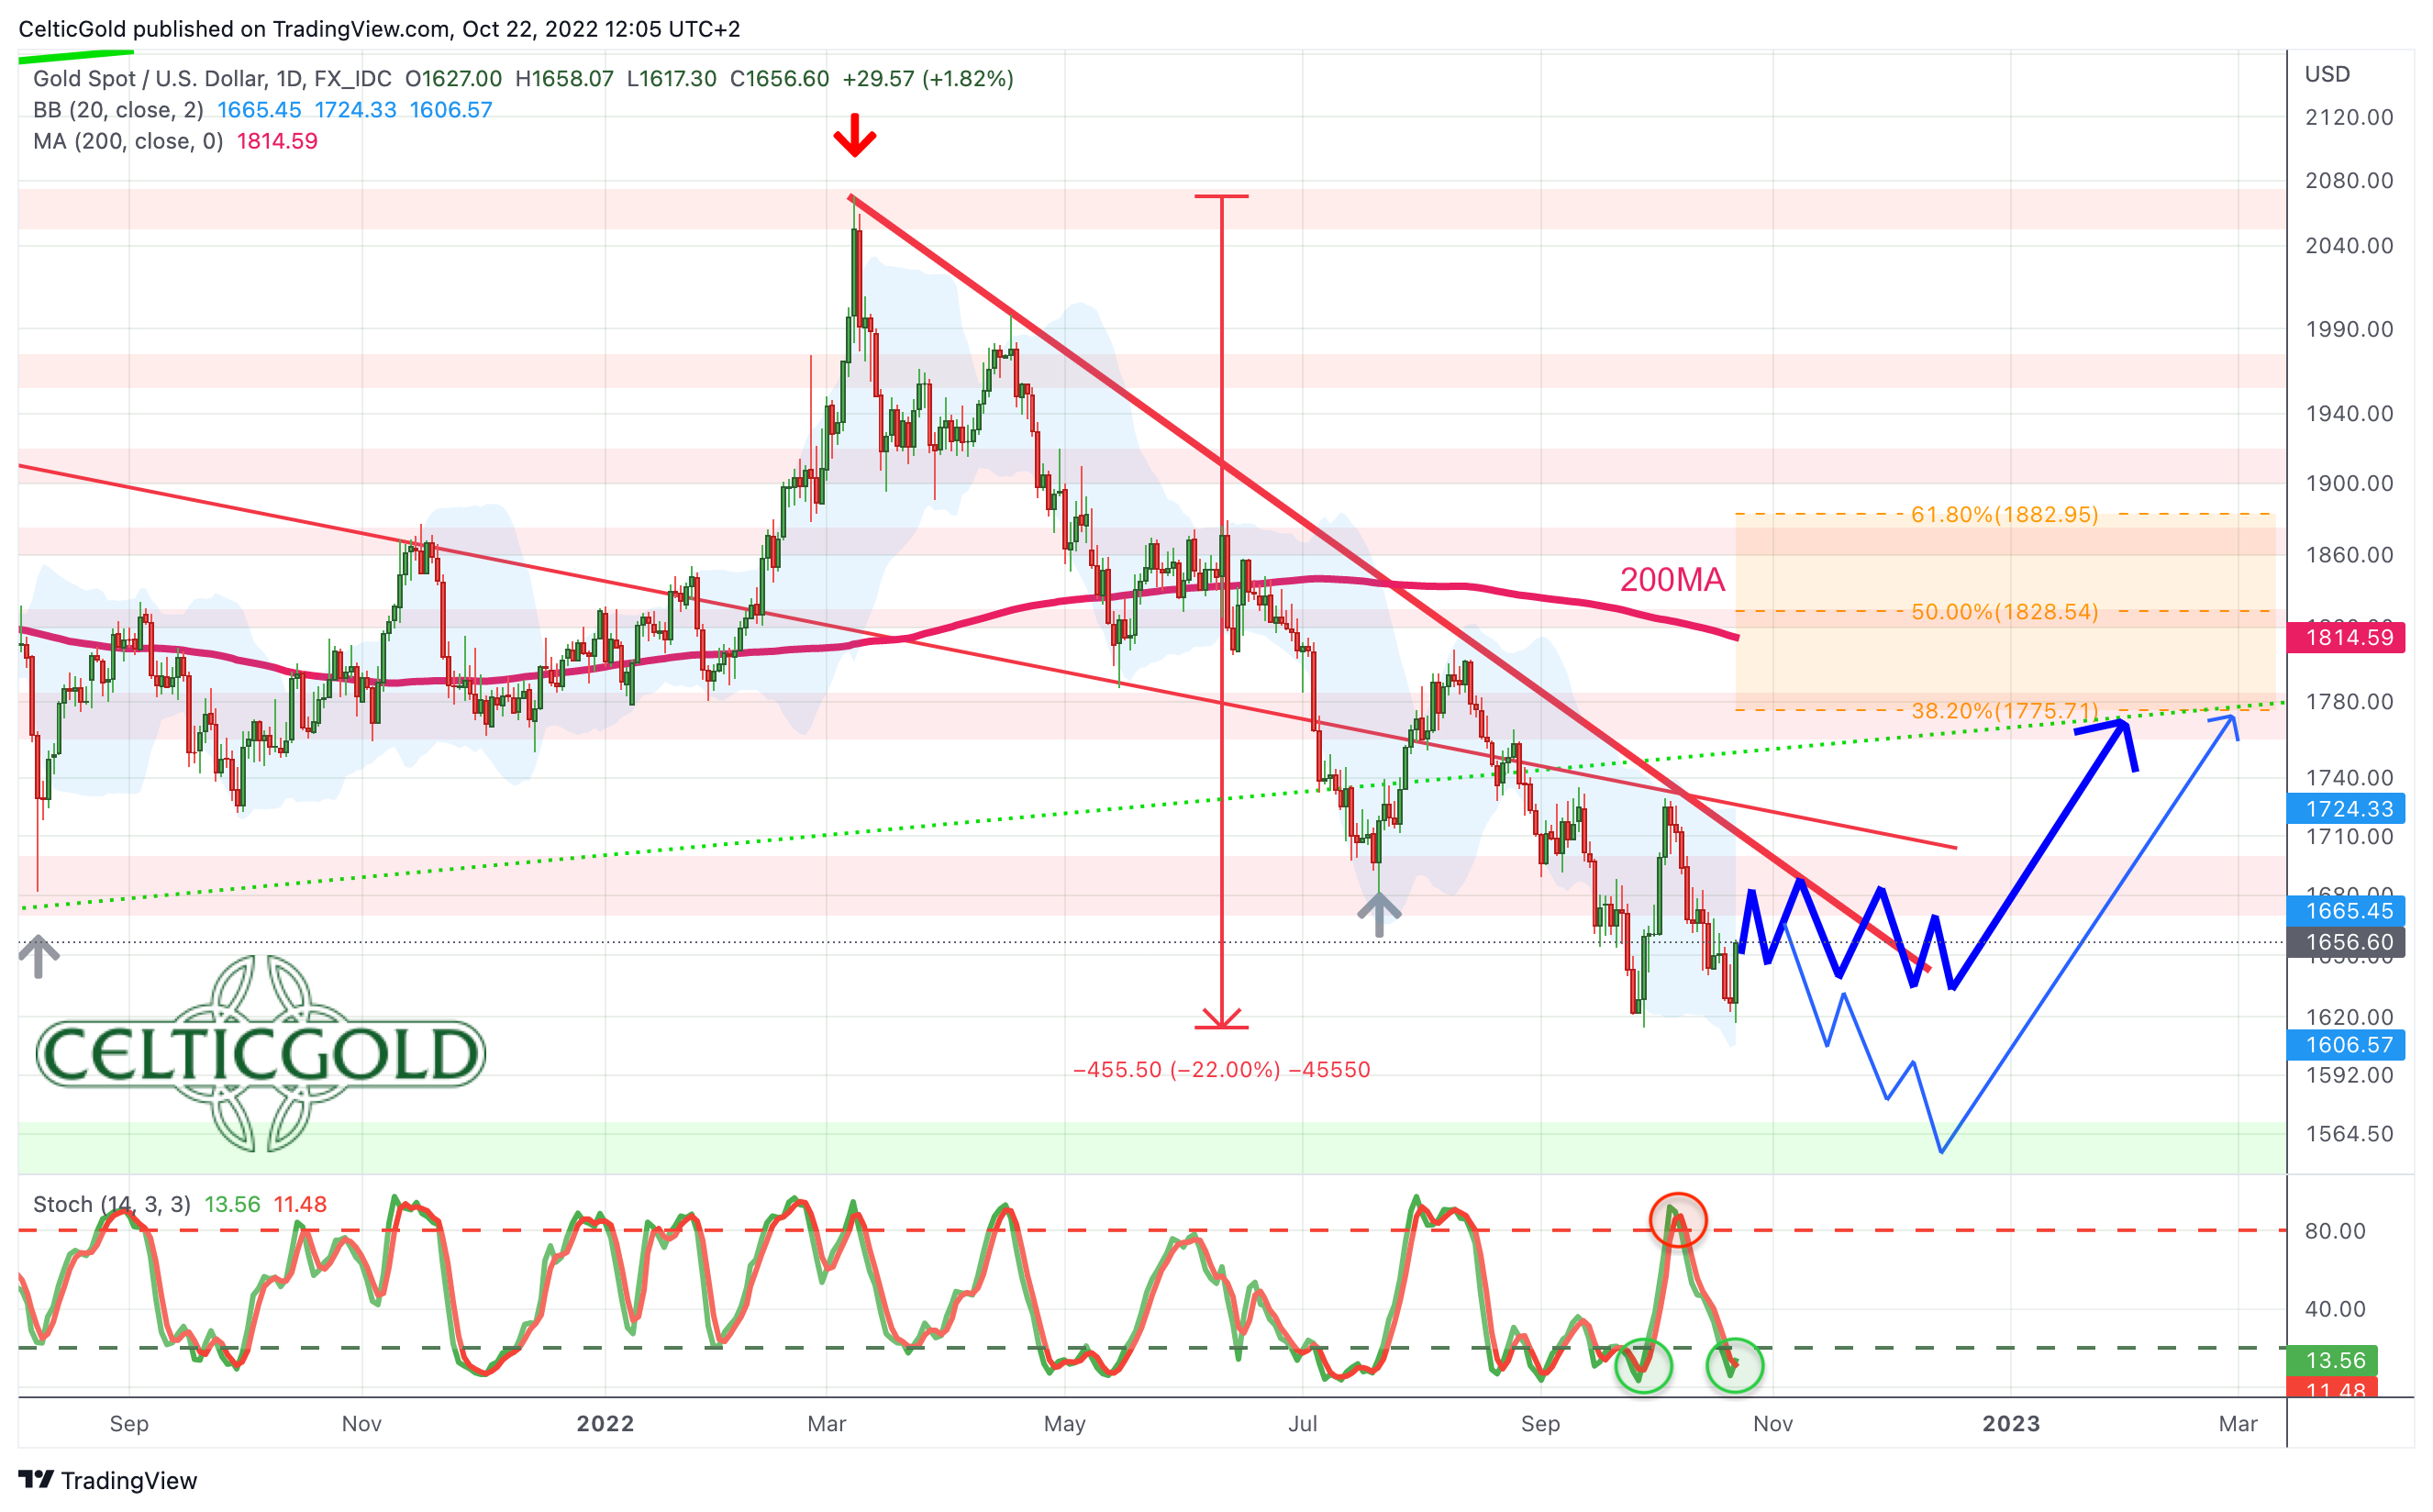 *Gold in US-Dollar, daily chart as of October 22nd, 2022. Source: Tradingview* On the daily chart, gold has been relentlessly sliding downwards since the high in March at 2,070 USD. Any countertrend-movement quickly fizzled out and gold faces a total loss of around 22%. At the same time, gold is trading around 180 USD below its falling 200-day line (1,815 USD). Hence, a short squeeze is possible at any time. However, this would also require a pullback in the heavily overbought US-Dollar. In view of the extremely one-sided “long dollar” positioning of most market participants, this is certainly only a matter of time. In any case, if gold can defend the September low at 1,615 USD, chances for a larger recovery would increase significantly. So far, however, this is wishful thinking but a decision will be made in the next few days. All in all, the daily chart is bearish, but oversold and therefore actually ripe for a renewed recovery. Nevertheless, gold would have to break out clearly above 1,680 USD and ideally also clear the last high at 1,730 USD to send a first bullish signal. More likely would be a tenacious and tricky bottom building process above 1,600 USD or even new lows somewhere between 1,530 and 1,570 USD. Be prepared that this bear spook could possibly even drag on until mid-December! ### Commitments of Traders for Gold – In search of a bottom 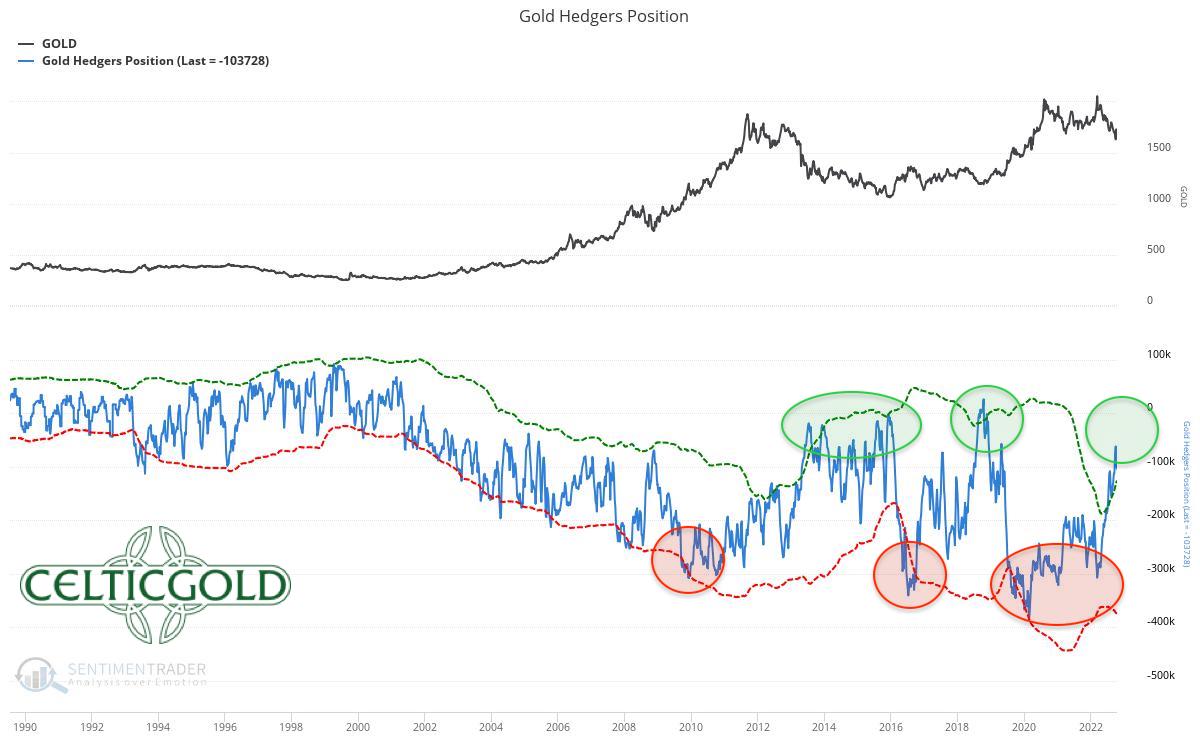 *Commitments of Traders (COT) for Gold as of October 19th, 2022. Source: Sentimentrader* At the end of September, the cumulated net short position of the commercial participants (62,138 contracts) had fallen to its lowest level since April 2019. The result was a sharp bounce of around 115 USD. According to the latest COT report, this short position amounts to 103,728 short-sold contracts and is therefore just above the threshold of 100,000 short contracts, at which one can speak of a sustainably bullish COT report. As gold is trading again around its September lows, the situation surely has improved further from contrarian point of view. In summary, the COT report can be classified as increasingly bullish. ### Sentiment for Gold – In search of a bottom 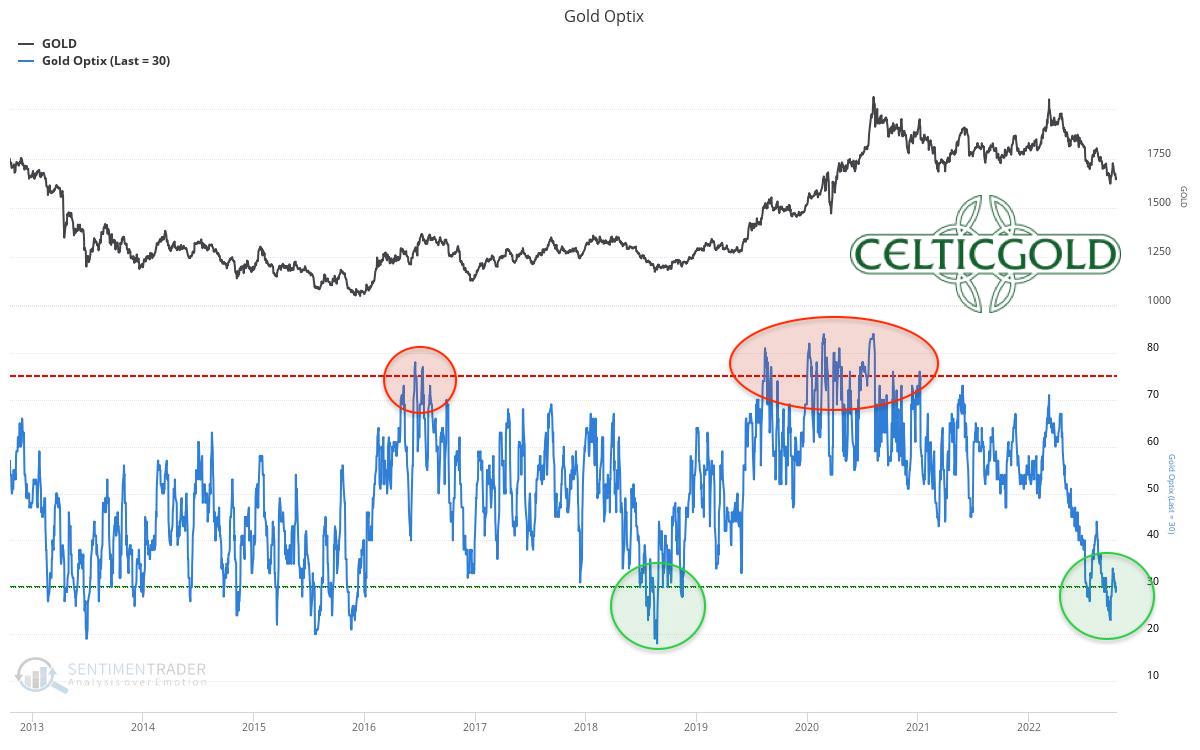 *Sentiment Optix for Gold as of October 19, 2022. Source: Sentimentrader* After seven months of almost non-stop falling prices, the sentiment in gold market has once again entered “excessively bearish” territory. However, when the vast majority of market participants is extremely pessimistic, the opposite often tends to happen. Although a bottoming process might drag on for months, the remaining downside risk seems rather limited given the current sentiment. In the medium and above all in the long term, this bombed out sentiment is currently laying the foundation for the next fulminant rise in the price of gold. Overall, the sentiment traffic light is green and provides a strong contrarian buy signal! ### Seasonality for Gold 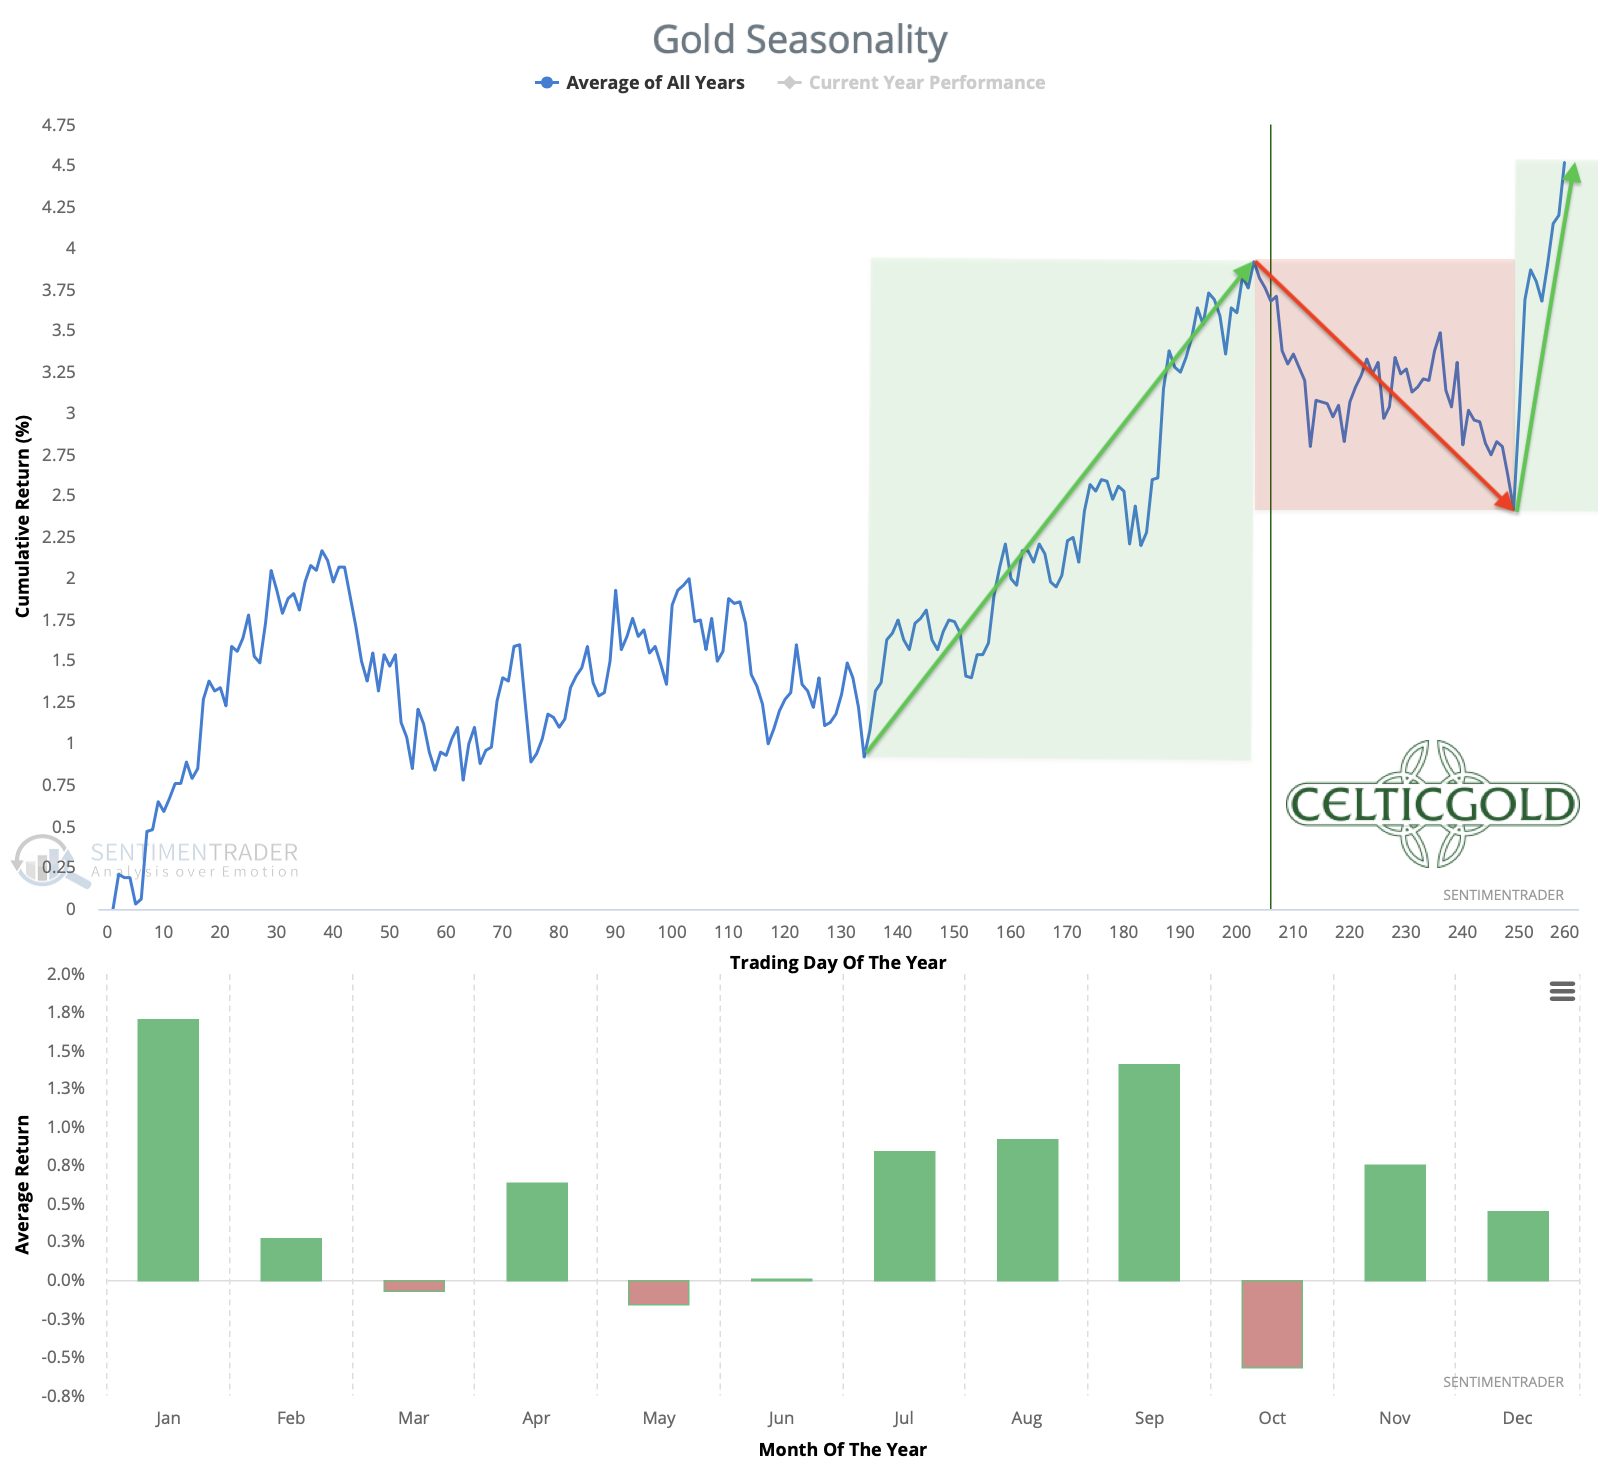 *Seasonality for Gold over the last 54-years as of October 19th, 2022. Source: Sentimentrader* From a seasonal perspective, the gold market still faces two difficult months ahead. Only with the US interest rate decision on December 14th will the worst of the season be over. Until then, the gold price should, statistically speaking, trade sideways to lower. In summary, seasonality for the gold and silver is clearly bearish until mid-December. ### Macro update – Miserable stock market year causes exaggerated pessimism Historically, September and October are the two worst months of the year for financial markets. The current year has so far confirmed these statistics quite well. Since September 1st, stock markets (Nasdaq -10.9%, DAX -1.2%), gold (-4.27%) and Bitcoin (-4.28%) show a negative result. Overall, the important asset classes have continued their sell-off and stock indices in particular fell to new lows. 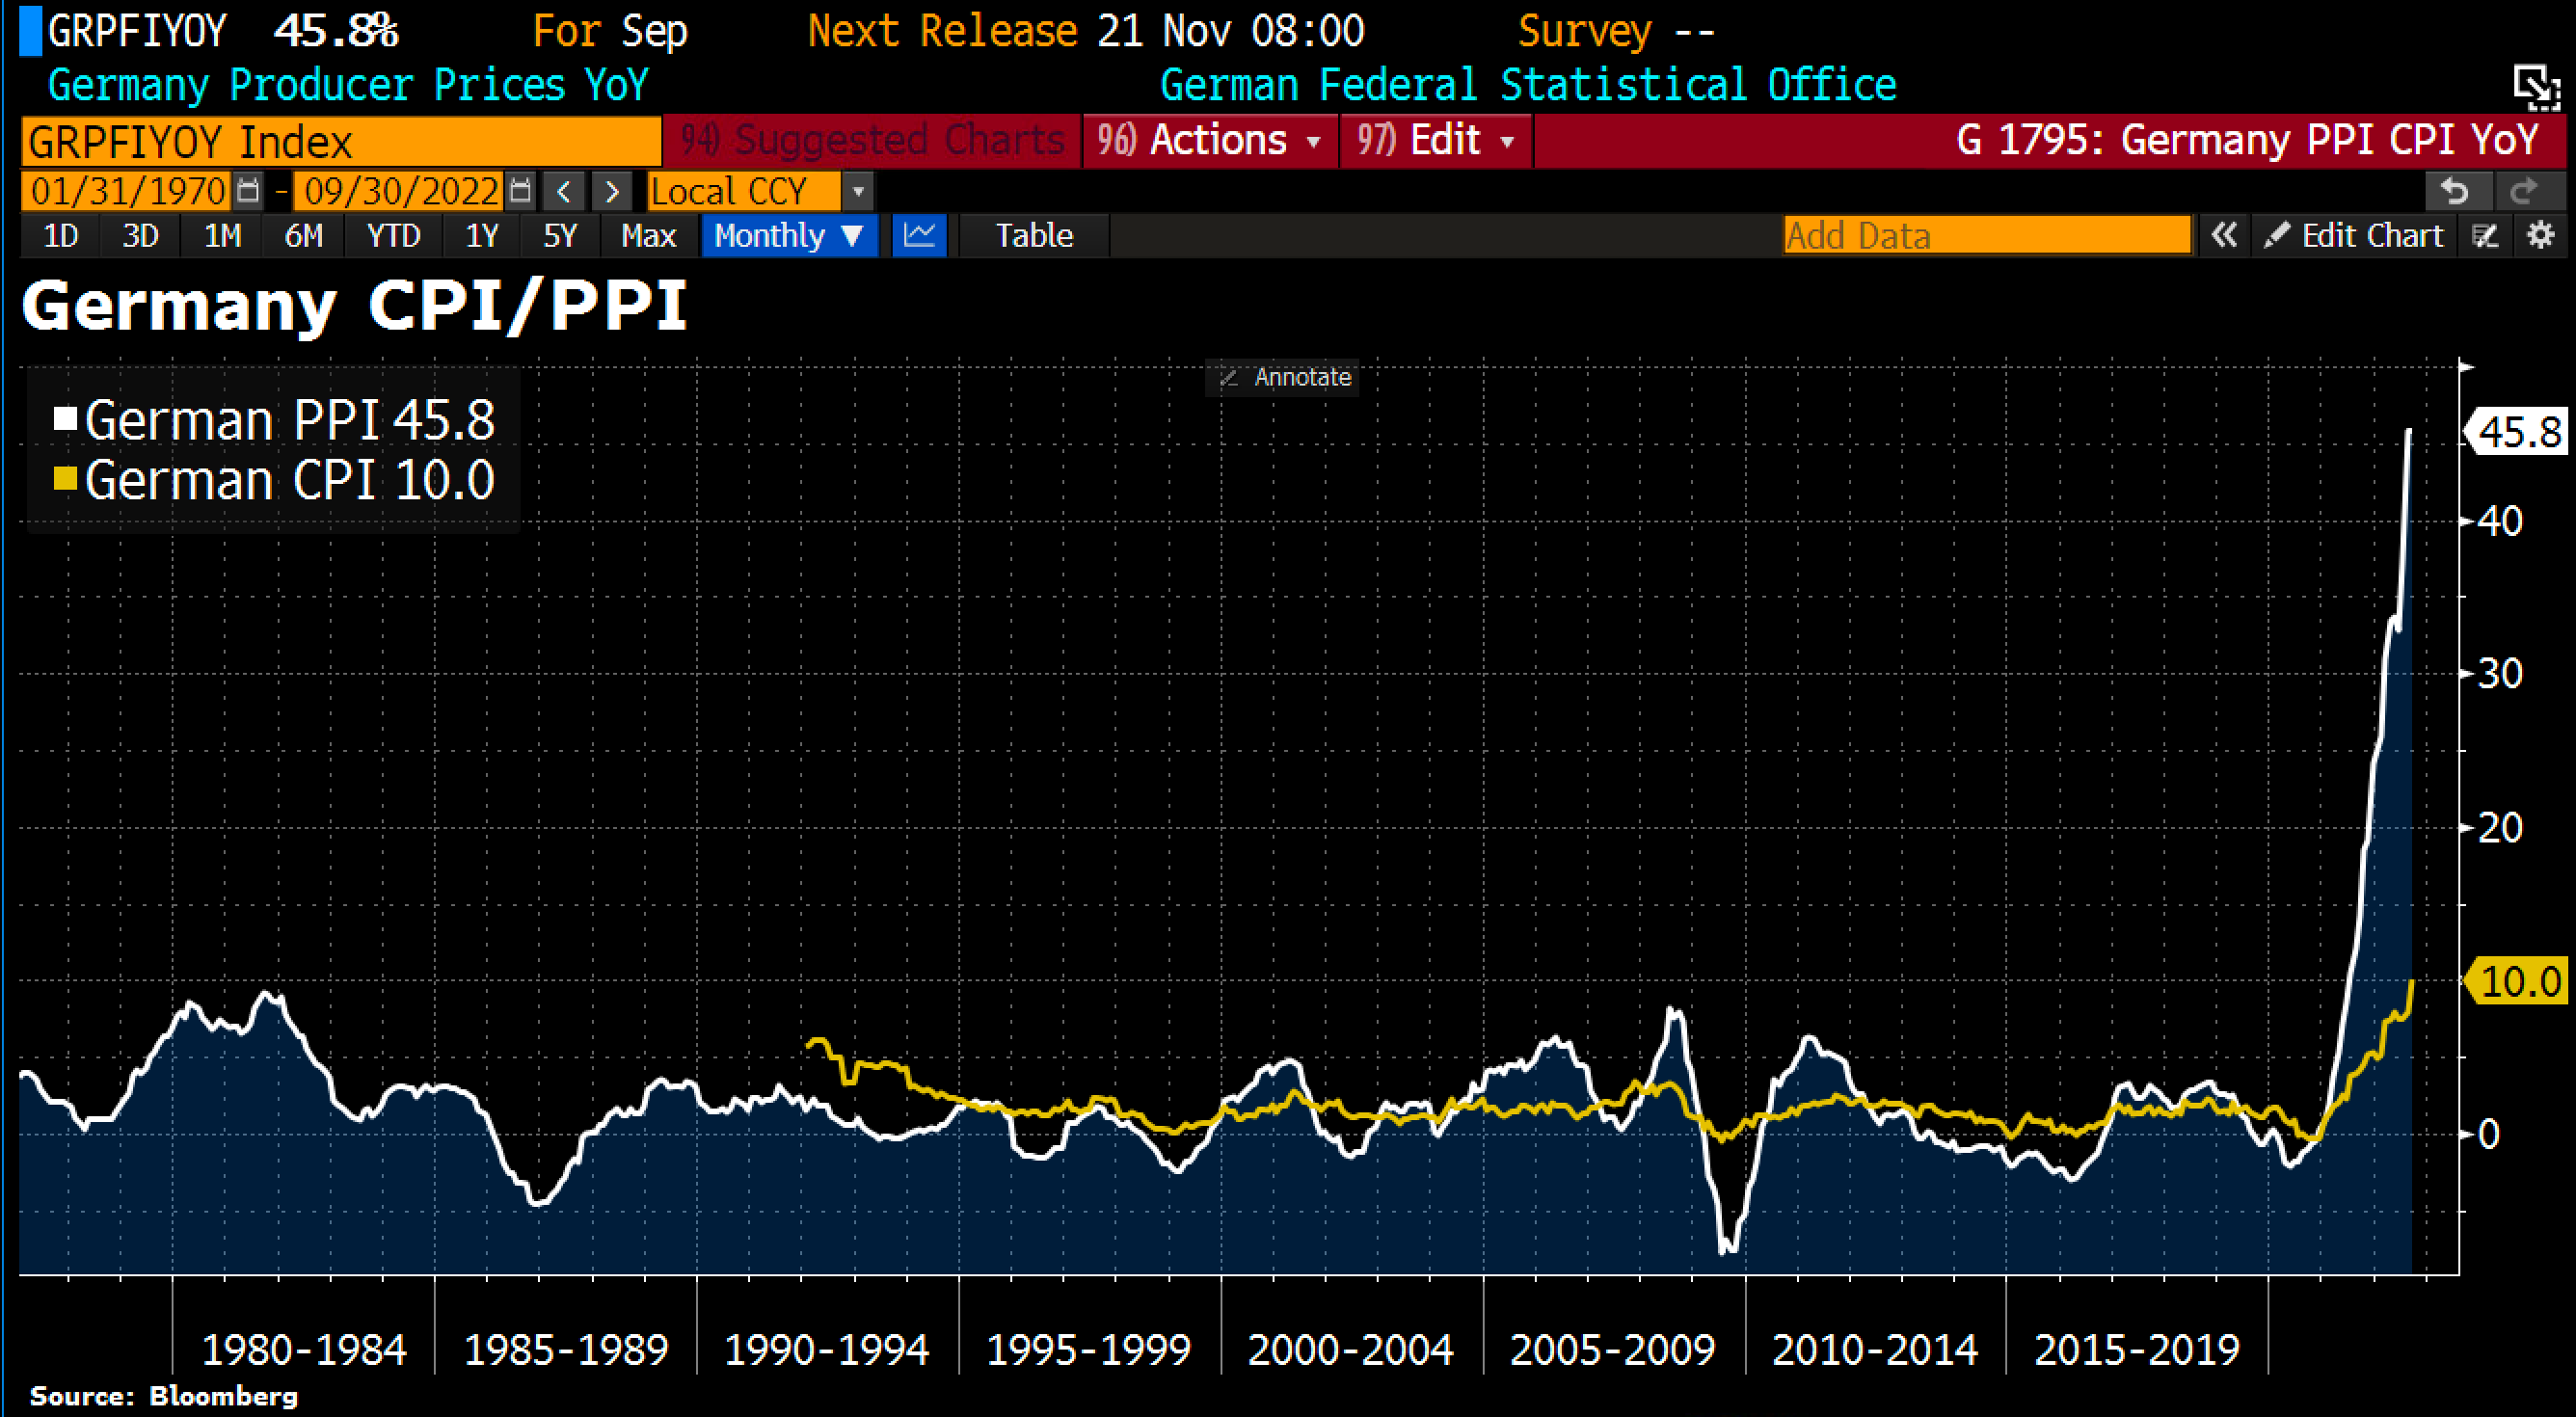 *Consumer prices vs. producer prices in Germany as of September 30th, 2022. Source: Holger Zschaepitz* The high inflation numbers have not given the markets any breather and are forcing central bankers in the major economies to raise interest rates further. While the US central bankers are trying to get inflation under control with “quantitative tightening” and interest rate hikes on an unprecedented scale, consumer prices in Germany are still rising. Most recently, German producer prices rose by 45.8% in September, the highest year-over-year rate since 1949. Hence, the fight against inflation is not showing any success (yet), especially in the euro zone. On the contrary, the European Central Bank (ECB) continues to pour fuel into the fire while the balance sheet total has recently increased by 6.1 billion EUR to 8,778.1 billion EUR as a result of “quantitative easing”. Since the record high in June, the ECB’s total assets have decreased by only 57 billion EUR and currently still represent around 81% of eurozone´s GDP. Hence, the EUR remains under heavy pressure against the US dollar and continues to fuel inflation due to rising import prices. No one knows how long this monetary experiment in the eurozone and Japan as well as the restrictive monetary policy in the USA can continue. An end to the geopolitical tensions between the USA/NATO/Eurozone on the one hand and Russia/China on the other is also not in sight. As a result, there is neither an end to the energy crisis in Europe in sight. 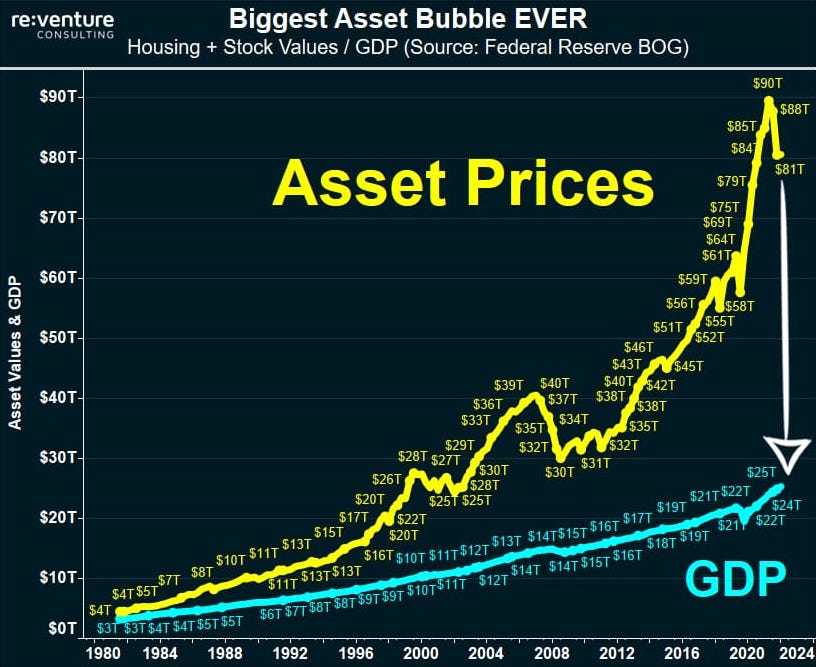 *Biggest Bubble Ever, October 8th, 2022. Source: Reventure Consulting* Therefore, nothing has changed in the negative big picture assessment for international financial markets. The hot air is slowly and painfully escaping from the biggest bubble of all time. In this process, the strong U.S. dollar combined with rising U.S. interest rates is ensuring that liquidity in the global financial system continues to dwindle, causing additional stress and further margin calls. Unfortunately, this vicious circle will continue until the U.S. Federal Reserve will be forced to radically change direction due to imploding credit markets and a dramatic increase in U.S. unemployment rates by then. We suspect that there will be jolting interest rate cuts and massive liquidity measurements before the end of the first half of 2023. 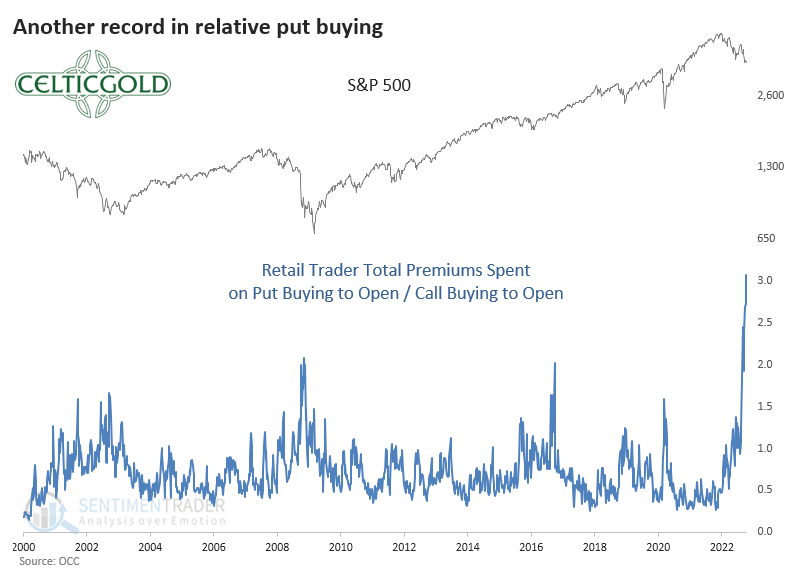 *Put/Call-Ratio as of October 17th, 2022. Source: Sentimentrader* At the same time, however, options traders have now amassed over 20 billion USD worth of put options to hedge against an equity market crash. Never in the history of U.S. financial markets has the put/call-ratio been at 3:1. Fear and panic are therefore extremely high and market participants are probably too bearishly positioned at present. Hence, a temporary yet sharp recovery (bear market rally) is quite possible by the end of the year. ### Conclusion: Gold – In search of a bottom Even if many gold investors are currently dissatisfied with the weak gold price development in USD, there is no way around gold in these crazy times given the turbulence in financial markets, historically high inflation rates, numerous hot spots, and an unbelievable number of (geo)political risks as well as the impending equalization of burdens / load balancing. Logically, the physical demand for precious metals remains very robust and has led to sometimes enormously high premiums, especially for silver. #### Within the 8-year cycle the final low is due in the next 12 months 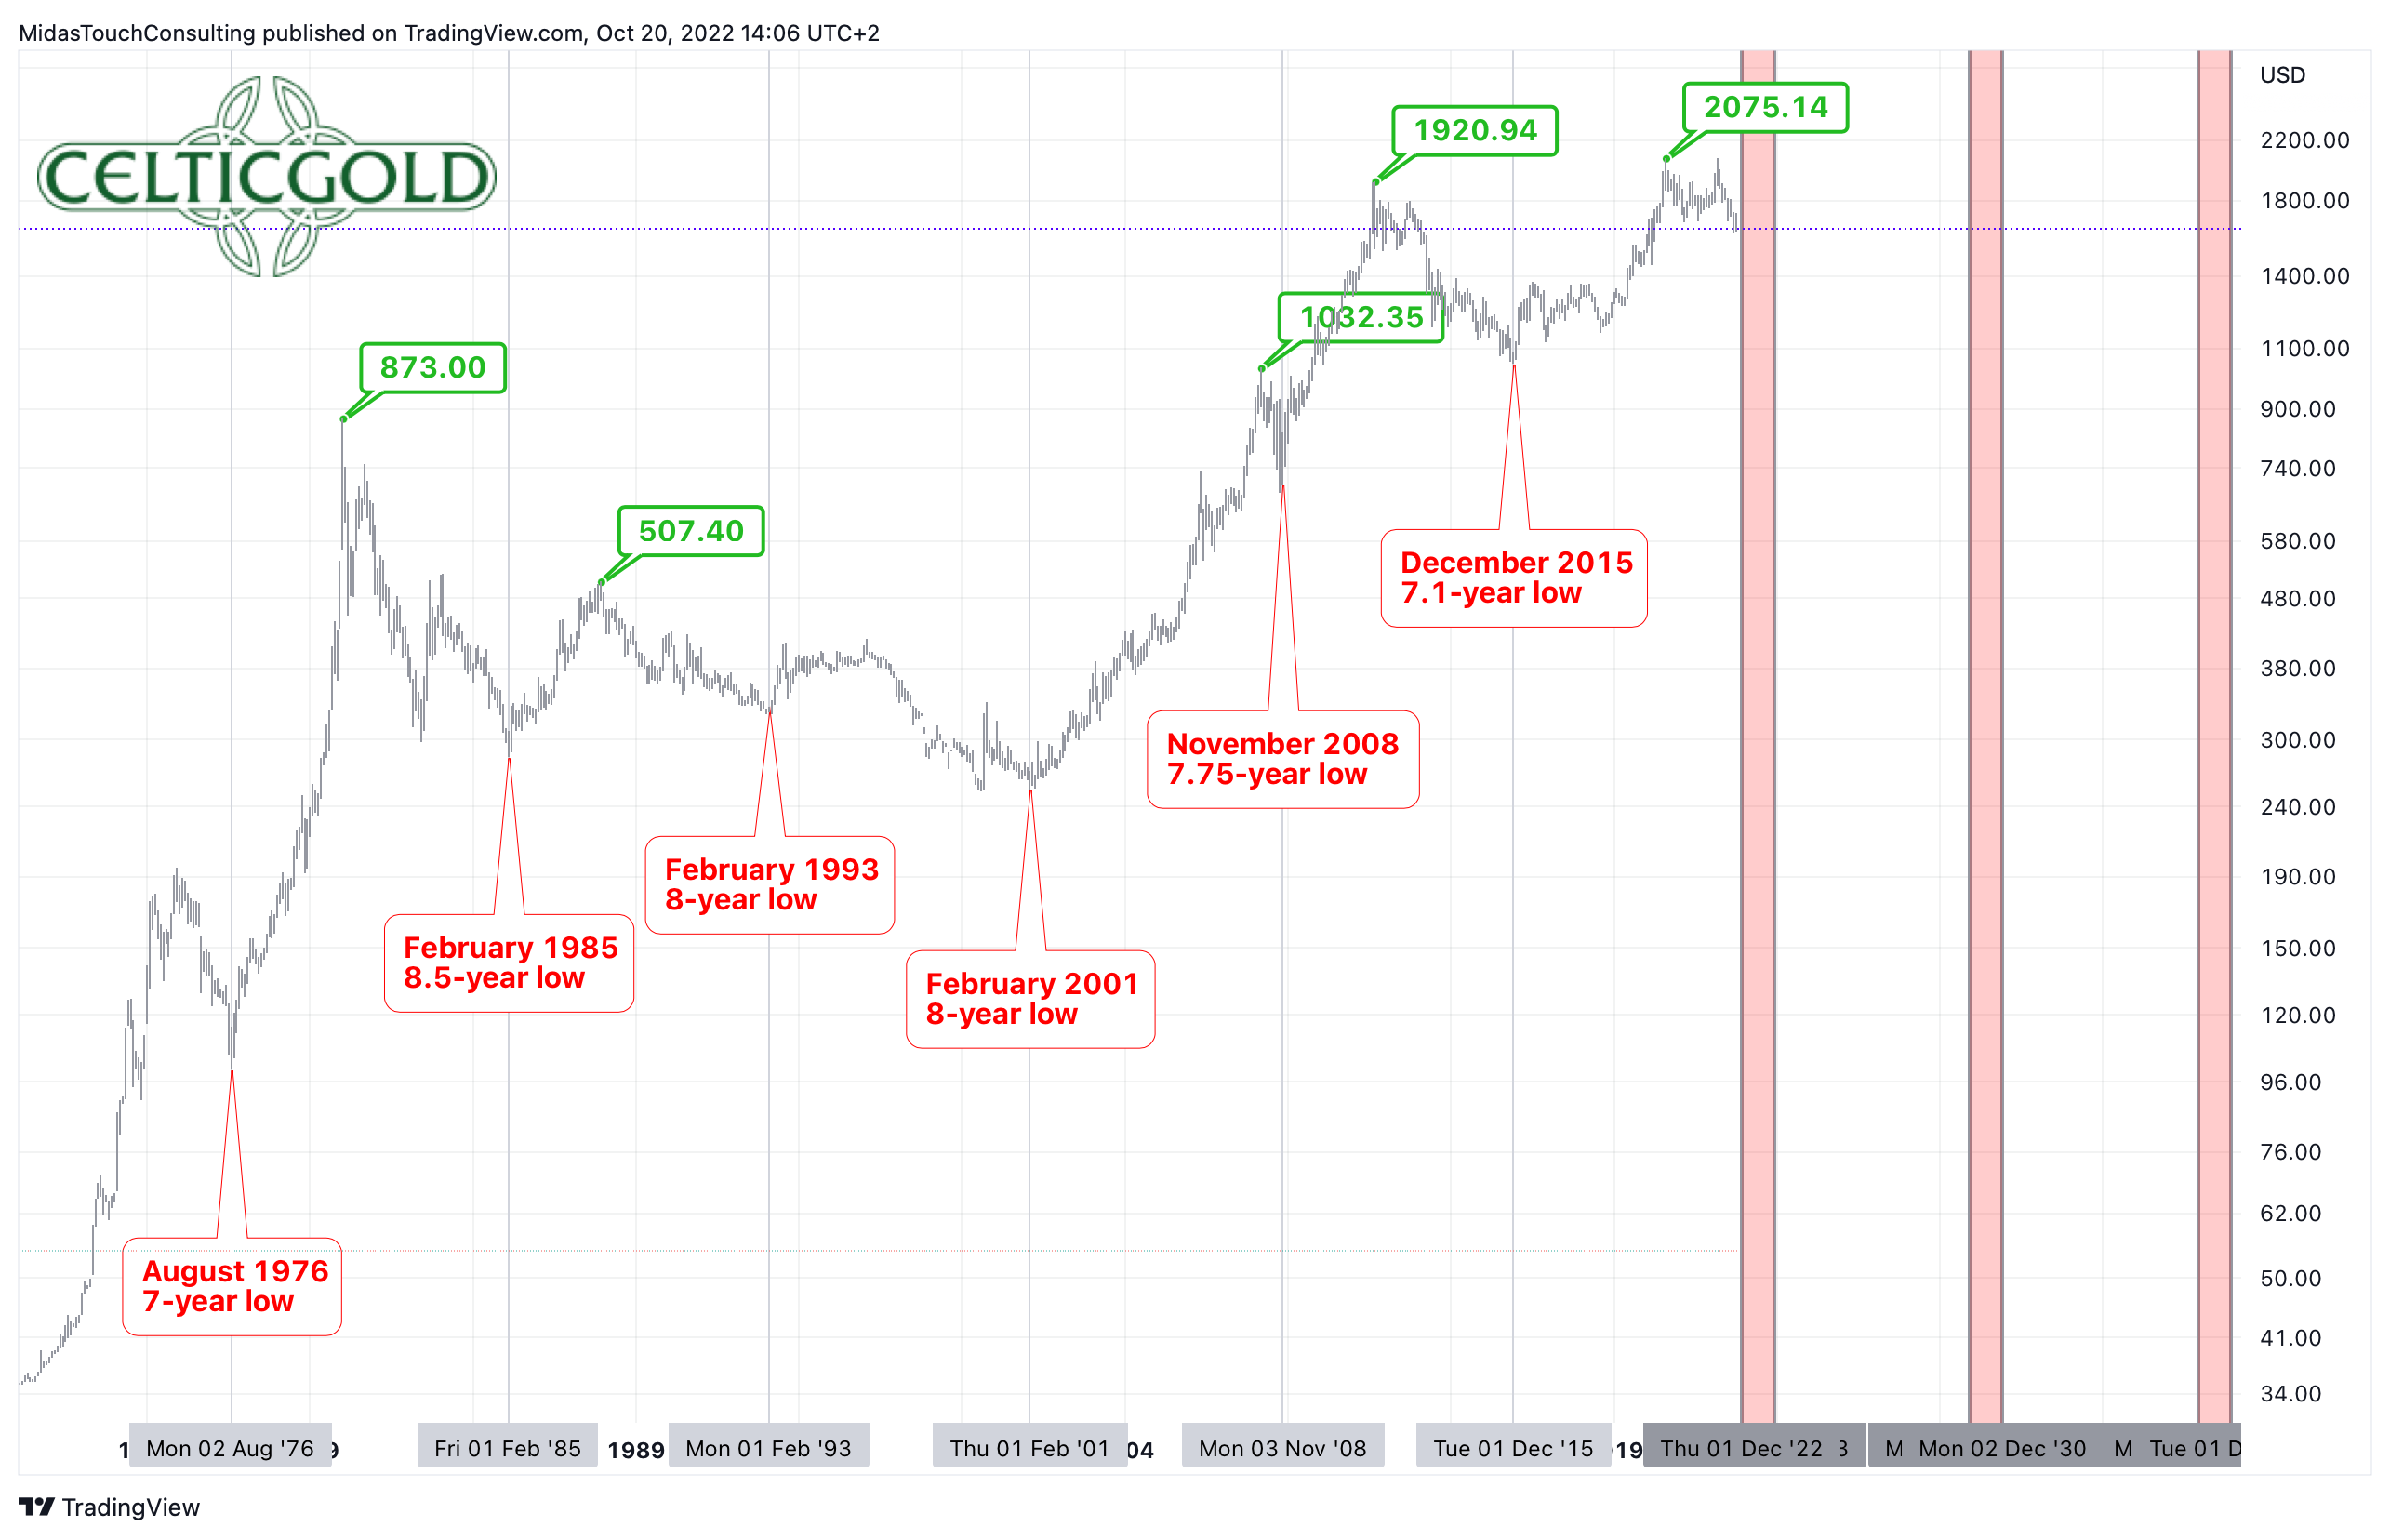 *Gold in US-Dollar, monthly chart as of October 20th, 2022. Source: Tradingview* In the bigger picture, gold is on its way to its typical 8-year low, due sometime between December 2022 and December 2023. With any luck, the U.S. interest rate decision on December 14th could already bring the reversal of the downtrend and the beginning of the next big upward wave in the gold market. But even if the final low does not materialize until later next year, the long-term outlook for gold remains very promising. We suspect that in the next bull market wave, price increases of between 100% and 600% are very possible. However, all this is still pie in the sky, because in the short term, all markets remain under enormous selling pressure. Gold is currently looking for a bottom just above 1,600 USD. Should the zone between 1,600 and 1,625 USD be able to fend off the ongoing bearish attacks, a double low should initiate a larger recovery towards 1,680 USD and possibly even 1,800 USD. Both sentiment and COT data, as well as the oversold market conditions, argue in favor of this. Alternatively, there will be a slide below 1,600 until mid-December. Yet, gold prices are then unlikely to fall significantly below 1,550 USD. In the long term, a remaining downside risk of maybe USD 100 is currently standing against a potential reward of at least 1,000 USD and more. --------- _Analysis sponsored and initially published on October 20th, 2022, by [www.celticgold.eu](https://celticgold.de/blog/gold-und-bitcoin-analysen-von-florian-grummes-32/gold-auf-der-suche-nach-einem-boden-192). Translated into English and partially updated on October 22nd._ _Feel free to join us in our free [Telegram channel](https://t.me/MidasTouchConsulting) for daily real time data and a great community._ _If you like to get regular updates on our gold model, precious metals, commodities, and cryptocurrencies you can subscribe to our [free newsletter](http://bit.ly/1EUdt2K)._ _Disclosure: This article and the content are for informational purposes only and do not contain investment advice or recommendations. Every investment and trading move involves risk, and readers should conduct their own research when making a decision. The views, thoughts and opinions expressed here are the author’s alone. They do not necessarily reflect or represent the views and opinions of Midas Touch Consulting._ |
| json metadata | {"tags":["leofinance","silvergoldstackers","gold","deepdives","finance","money","investing","inflation"],"image":["https://cdn.steemitimages.com/DQmTuxCfYepzkx31kFWAo7aRRsbSBP7cZCcrjdyL4jq2zxW/blog-header-gold-celticgold.jpg","https://cdn.steemitimages.com/DQmdaYnZZDfycBvN7LKjKjemGRE37gvSzxJRorB8MbnD4Sa/Chart%2001%20Gold%20in%20USD%204-hour%20chart%2022102022.png","https://cdn.steemitimages.com/DQmYXnbV7qj5Jn3Sormdc2gSNk76sf1mPogBstQqBjsUHDU/Chart%2002%20Gold%20in%20USD%20weekly%20chart%2022102022.png","https://cdn.steemitimages.com/DQmdrAuKeruBvRmcUivSypFxyGyt6umRvyv4CXCdknBGpZn/Chart%2003%20Gold%20in%20USD%20daily%20chart%2022102022.png","https://cdn.steemitimages.com/DQmb2TXDy4SxnHjqBFPpQgX4TzzBeAgiWE5RHxYub4WPT45/Chart%2004%20Gold%20Hedgers%20Position%2019102022.jpeg","https://cdn.steemitimages.com/DQmesWUeJfWHZYDCKcbqk4mjAzzsbKpmaDgdYYXeUoEATez/Chart%2005%20Gold%20Optix%20Sentiment%2019102022.jpeg","https://cdn.steemitimages.com/DQmVSwwKx7frDWfjJirrpLD4EtSjY6Urpeu4s71PePEZYqA/Chart%2006%20Gold%20seasonality%2019102022.png","https://cdn.steemitimages.com/DQmPpVF1LpQBUxH1mTpH86MRDmEgaxvD123yaezH3pGSrBt/Chart%2007%20German%20CPI%20vs%20PPI%2020102022.png","https://cdn.steemitimages.com/DQmeTRtc9uveDpjKjkHfPPs6ku8quP43SoKpviV6jA227he/Chart%2009%20Biggest%20Asset%20Buggle%20Ever%2008102022.jpeg","https://cdn.steemitimages.com/DQmeLB813YWZuikpQ8nqRPrjtZS1LrpLt54RdczE2hP1Ff1/Chart%2010%20Put:Call-Ratio%2017102022.png","https://cdn.steemitimages.com/DQmSremDeYpeTdPBZUBhfKyoXJ2mwSh4mpVjVjjBL6vvG1o/Chart%2011%20Gold%20in%20USD%20monthly%20chart%2020102022.png"],"links":["https://www.midastouch-consulting.com/22102022-gold-in-search-of-a-bottom","https://celticgold.de/blog/gold-und-bitcoin-analysen-von-florian-grummes-32/gold-auf-der-suche-nach-einem-boden-192","https://t.me/MidasTouchConsulting","http://bit.ly/1EUdt2K"],"app":"steemit/0.2","format":"markdown"} |
| parent author | |
| parent permlink | leofinance |
| permlink | october-22nd-2022-gold-in-search-of-a-bottom |
| title | October 22nd, 2022: Gold – In search of a bottom |
| Transaction Info | Block #68794590/Trx 214718727d930266325c1462ec5b9680df45e7cf |
View Raw JSON Data
{
"block": 68794590,
"op": [
"comment",
{
"author": "midastouch",
"body": " \n# [October 22nd, 2022: Gold – In search of a bottom](https://www.midastouch-consulting.com/22102022-gold-in-search-of-a-bottom)\n\nIn our last in-depth gold analysis we saw gold on the brink of the abyss and feared that the support around 1,680 USD would not hold. Indeed, two weeks later gold broke through this support and the following sell-off only stopped at 1,615 USD. Gold – In search of a bottom.\n\n### Review\n\nWith the early failure of the summer rally at 1,807 USD, the outlook for the gold market quickly deteriorated again since mid-August. As a result, the bears were able to push gold prices without much resistance below the important support at 1,680 USD. This mark had withstood all attacks for the past two and a half years. In a miserable overall market environment, gold bulls were no longer able to defend this zone, hence gold prices sold off to 1,615 USD at the end of September, reaching their lowest level since April 2020. From the March high at 2,070 USD, gold has lost around 455 USD or almost 22% in just under seven months!\n\nIn Euro, however, the picture looks much better. The weak Euro ensured that the price of gold in Euros can still show a small plus of 3.75% year-to-date. In a desolate 2022 for European equity and bond investors, gold brought at least some stabilization into a diversified portfolio.\n\n\n*Gold in US-Dollar, 4-hour chart as of October 22nd, 2022. Source: Tradingview*\n\nWith the emergency intervention by the British central bank to support the imploding bond market, gold violently turned around on September 28th, and was able to recover significantly to 1,729 USD within just five trading days. However, this recovery didn’t last long, as bears have pushed gold prices lower again over the past three weeks. Trading very close to the September low, a renewed recovery attempt could start any time. Given the heavily oversold situation and the beaten down sentiment, the chances of a larger recovery are not that bad.\n\n#### All sectors remain in a severe bear market\n\nNevertheless, nothing has changed in the bigger picture as all sectors remain in a severe bear market. The continued strength of the US-Dollar, combined with rising US interest rates, is putting all asset classes under enormous pressure and further withdraws liquidity from the markets. It’s a vicious circle that is likely to continue until credit markets freeze, at which point the Federal Reserve will be forced to make a radical change in their money policy.\n\n### Chart Analysis Gold in US Dollars\n#### Weekly chart: The support at 1,680 USD has been clearly broken\n\n*Gold in US-Dollar, weekly chart as of October 22nd, 2022. Source: Tradingview*\n\nAs feared, the support at 1,680 USD no longer withstood the pressure from the bears on their fifth attempt. Although the breakthrough was not very quick, the situation is clear. Gold prices are trading at their lowest levels since March 2020 and bullish signals are in nowhere in sight.\n\nAt least, the stochastic oscillator on the weekly chart is heavily oversold. But apart from the already broken lower edge of the long-term uptrend, there are no significant supports down to the area around 1,530 to USD 1,570. The absolute “worst case” scenario remains a pullback towards around 1,350 USD.\n\nOn the way up, the bulls must first clear the former support around 1,680 USD to provide an initial signal of a trend reversal. So far, this has not been successful and the resistance zone around 1,680 USD is now being additionally strengthened with two crossing trend lines.\n\nOverall, the weekly chart is bearish. From a trend follower perspective, lower prices below the round number of 1,600 USD would therefore be the next logical step. At the same time, however, the technical situation is extremely oversold and a bet on lower prices no longer has a good risk/reward-ratio.\n\n#### Daily chart: Clearly oversold again\n\n*Gold in US-Dollar, daily chart as of October 22nd, 2022. Source: Tradingview*\n\nOn the daily chart, gold has been relentlessly sliding downwards since the high in March at 2,070 USD. Any countertrend-movement quickly fizzled out and gold faces a total loss of around 22%.\n\nAt the same time, gold is trading around 180 USD below its falling 200-day line (1,815 USD). Hence, a short squeeze is possible at any time. However, this would also require a pullback in the heavily overbought US-Dollar. In view of the extremely one-sided “long dollar” positioning of most market participants, this is certainly only a matter of time.\n\nIn any case, if gold can defend the September low at 1,615 USD, chances for a larger recovery would increase significantly. So far, however, this is wishful thinking but a decision will be made in the next few days.\n\nAll in all, the daily chart is bearish, but oversold and therefore actually ripe for a renewed recovery. Nevertheless, gold would have to break out clearly above 1,680 USD and ideally also clear the last high at 1,730 USD to send a first bullish signal. More likely would be a tenacious and tricky bottom building process above 1,600 USD or even new lows somewhere between 1,530 and 1,570 USD. Be prepared that this bear spook could possibly even drag on until mid-December!\n\n### Commitments of Traders for Gold – In search of a bottom\n\n*Commitments of Traders (COT) for Gold as of October 19th, 2022. Source: Sentimentrader*\n\nAt the end of September, the cumulated net short position of the commercial participants (62,138 contracts) had fallen to its lowest level since April 2019. The result was a sharp bounce of around 115 USD. According to the latest COT report, this short position amounts to 103,728 short-sold contracts and is therefore just above the threshold of 100,000 short contracts, at which one can speak of a sustainably bullish COT report. As gold is trading again around its September lows, the situation surely has improved further from contrarian point of view.\n\nIn summary, the COT report can be classified as increasingly bullish.\n\n### Sentiment for Gold – In search of a bottom\n\n*Sentiment Optix for Gold as of October 19, 2022. Source: Sentimentrader*\n\nAfter seven months of almost non-stop falling prices, the sentiment in gold market has once again entered “excessively bearish” territory. However, when the vast majority of market participants is extremely pessimistic, the opposite often tends to happen. Although a bottoming process might drag on for months, the remaining downside risk seems rather limited given the current sentiment. In the medium and above all in the long term, this bombed out sentiment is currently laying the foundation for the next fulminant rise in the price of gold.\n\nOverall, the sentiment traffic light is green and provides a strong contrarian buy signal!\n\n### Seasonality for Gold\n\n*Seasonality for Gold over the last 54-years as of October 19th, 2022. Source: Sentimentrader*\n\nFrom a seasonal perspective, the gold market still faces two difficult months ahead. Only with the US interest rate decision on December 14th will the worst of the season be over. Until then, the gold price should, statistically speaking, trade sideways to lower.\n\nIn summary, seasonality for the gold and silver is clearly bearish until mid-December.\n\n### Macro update – Miserable stock market year causes exaggerated pessimism\n\nHistorically, September and October are the two worst months of the year for financial markets. The current year has so far confirmed these statistics quite well. Since September 1st, stock markets (Nasdaq -10.9%, DAX -1.2%), gold (-4.27%) and Bitcoin (-4.28%) show a negative result. Overall, the important asset classes have continued their sell-off and stock indices in particular fell to new lows.\n\n\n*Consumer prices vs. producer prices in Germany as of September 30th, 2022. Source: Holger Zschaepitz*\n\nThe high inflation numbers have not given the markets any breather and are forcing central bankers in the major economies to raise interest rates further. While the US central bankers are trying to get inflation under control with “quantitative tightening” and interest rate hikes on an unprecedented scale, consumer prices in Germany are still rising. Most recently, German producer prices rose by 45.8% in September, the highest year-over-year rate since 1949.\n\nHence, the fight against inflation is not showing any success (yet), especially in the euro zone. On the contrary, the European Central Bank (ECB) continues to pour fuel into the fire while the balance sheet total has recently increased by 6.1 billion EUR to 8,778.1 billion EUR as a result of “quantitative easing”. Since the record high in June, the ECB’s total assets have decreased by only 57 billion EUR and currently still represent around 81% of eurozone´s GDP. Hence, the EUR remains under heavy pressure against the US dollar and continues to fuel inflation due to rising import prices. No one knows how long this monetary experiment in the eurozone and Japan as well as the restrictive monetary policy in the USA can continue.\n\nAn end to the geopolitical tensions between the USA/NATO/Eurozone on the one hand and Russia/China on the other is also not in sight. As a result, there is neither an end to the energy crisis in Europe in sight.\n\n\n*Biggest Bubble Ever, October 8th, 2022. Source: Reventure Consulting*\n\nTherefore, nothing has changed in the negative big picture assessment for international financial markets. The hot air is slowly and painfully escaping from the biggest bubble of all time. In this process, the strong U.S. dollar combined with rising U.S. interest rates is ensuring that liquidity in the global financial system continues to dwindle, causing additional stress and further margin calls. Unfortunately, this vicious circle will continue until the U.S. Federal Reserve will be forced to radically change direction due to imploding credit markets and a dramatic increase in U.S. unemployment rates by then. We suspect that there will be jolting interest rate cuts and massive liquidity measurements before the end of the first half of 2023.\n\n\n*Put/Call-Ratio as of October 17th, 2022. Source: Sentimentrader*\n\nAt the same time, however, options traders have now amassed over 20 billion USD worth of put options to hedge against an equity market crash. Never in the history of U.S. financial markets has the put/call-ratio been at 3:1. Fear and panic are therefore extremely high and market participants are probably too bearishly positioned at present. Hence, a temporary yet sharp recovery (bear market rally) is quite possible by the end of the year.\n\n### Conclusion: Gold – In search of a bottom\n\nEven if many gold investors are currently dissatisfied with the weak gold price development in USD, there is no way around gold in these crazy times given the turbulence in financial markets, historically high inflation rates, numerous hot spots, and an unbelievable number of (geo)political risks as well as the impending equalization of burdens / load balancing. Logically, the physical demand for precious metals remains very robust and has led to sometimes enormously high premiums, especially for silver.\n\n#### Within the 8-year cycle the final low is due in the next 12 months\n\n*Gold in US-Dollar, monthly chart as of October 20th, 2022. Source: Tradingview*\n\nIn the bigger picture, gold is on its way to its typical 8-year low, due sometime between December 2022 and December 2023. With any luck, the U.S. interest rate decision on December 14th could already bring the reversal of the downtrend and the beginning of the next big upward wave in the gold market. But even if the final low does not materialize until later next year, the long-term outlook for gold remains very promising. We suspect that in the next bull market wave, price increases of between 100% and 600% are very possible.\n\nHowever, all this is still pie in the sky, because in the short term, all markets remain under enormous selling pressure. Gold is currently looking for a bottom just above 1,600 USD. Should the zone between 1,600 and 1,625 USD be able to fend off the ongoing bearish attacks, a double low should initiate a larger recovery towards 1,680 USD and possibly even 1,800 USD. Both sentiment and COT data, as well as the oversold market conditions, argue in favor of this. Alternatively, there will be a slide below 1,600 until mid-December. Yet, gold prices are then unlikely to fall significantly below 1,550 USD.\n\nIn the long term, a remaining downside risk of maybe USD 100 is currently standing against a potential reward of at least 1,000 USD and more.\n---------\n_Analysis sponsored and initially published on October 20th, 2022, by [www.celticgold.eu](https://celticgold.de/blog/gold-und-bitcoin-analysen-von-florian-grummes-32/gold-auf-der-suche-nach-einem-boden-192). Translated into English and partially updated on October 22nd._\n\n_Feel free to join us in our free [Telegram channel](https://t.me/MidasTouchConsulting) for daily real time data and a great community._\n\n_If you like to get regular updates on our gold model, precious metals, commodities, and cryptocurrencies you can subscribe to our [free newsletter](http://bit.ly/1EUdt2K)._\n\n_Disclosure: This article and the content are for informational purposes only and do not contain investment advice or recommendations. Every investment and trading move involves risk, and readers should conduct their own research when making a decision. The views, thoughts and opinions expressed here are the author’s alone. They do not necessarily reflect or represent the views and opinions of Midas Touch Consulting._",
"json_metadata": "{\"tags\":[\"leofinance\",\"silvergoldstackers\",\"gold\",\"deepdives\",\"finance\",\"money\",\"investing\",\"inflation\"],\"image\":[\"https://cdn.steemitimages.com/DQmTuxCfYepzkx31kFWAo7aRRsbSBP7cZCcrjdyL4jq2zxW/blog-header-gold-celticgold.jpg\",\"https://cdn.steemitimages.com/DQmdaYnZZDfycBvN7LKjKjemGRE37gvSzxJRorB8MbnD4Sa/Chart%2001%20Gold%20in%20USD%204-hour%20chart%2022102022.png\",\"https://cdn.steemitimages.com/DQmYXnbV7qj5Jn3Sormdc2gSNk76sf1mPogBstQqBjsUHDU/Chart%2002%20Gold%20in%20USD%20weekly%20chart%2022102022.png\",\"https://cdn.steemitimages.com/DQmdrAuKeruBvRmcUivSypFxyGyt6umRvyv4CXCdknBGpZn/Chart%2003%20Gold%20in%20USD%20daily%20chart%2022102022.png\",\"https://cdn.steemitimages.com/DQmb2TXDy4SxnHjqBFPpQgX4TzzBeAgiWE5RHxYub4WPT45/Chart%2004%20Gold%20Hedgers%20Position%2019102022.jpeg\",\"https://cdn.steemitimages.com/DQmesWUeJfWHZYDCKcbqk4mjAzzsbKpmaDgdYYXeUoEATez/Chart%2005%20Gold%20Optix%20Sentiment%2019102022.jpeg\",\"https://cdn.steemitimages.com/DQmVSwwKx7frDWfjJirrpLD4EtSjY6Urpeu4s71PePEZYqA/Chart%2006%20Gold%20seasonality%2019102022.png\",\"https://cdn.steemitimages.com/DQmPpVF1LpQBUxH1mTpH86MRDmEgaxvD123yaezH3pGSrBt/Chart%2007%20German%20CPI%20vs%20PPI%2020102022.png\",\"https://cdn.steemitimages.com/DQmeTRtc9uveDpjKjkHfPPs6ku8quP43SoKpviV6jA227he/Chart%2009%20Biggest%20Asset%20Buggle%20Ever%2008102022.jpeg\",\"https://cdn.steemitimages.com/DQmeLB813YWZuikpQ8nqRPrjtZS1LrpLt54RdczE2hP1Ff1/Chart%2010%20Put:Call-Ratio%2017102022.png\",\"https://cdn.steemitimages.com/DQmSremDeYpeTdPBZUBhfKyoXJ2mwSh4mpVjVjjBL6vvG1o/Chart%2011%20Gold%20in%20USD%20monthly%20chart%2020102022.png\"],\"links\":[\"https://www.midastouch-consulting.com/22102022-gold-in-search-of-a-bottom\",\"https://celticgold.de/blog/gold-und-bitcoin-analysen-von-florian-grummes-32/gold-auf-der-suche-nach-einem-boden-192\",\"https://t.me/MidasTouchConsulting\",\"http://bit.ly/1EUdt2K\"],\"app\":\"steemit/0.2\",\"format\":\"markdown\"}",
"parent_author": "",
"parent_permlink": "leofinance",
"permlink": "october-22nd-2022-gold-in-search-of-a-bottom",
"title": "October 22nd, 2022: Gold – In search of a bottom"
}
],
"op_in_trx": 0,
"timestamp": "2022-10-23T08:49:54",
"trx_id": "214718727d930266325c1462ec5b9680df45e7cf",
"trx_in_block": 1,
"virtual_op": 0
}midastouchfollowed @marketreport2022/10/23 08:48:27
midastouchfollowed @marketreport
2022/10/23 08:48:27
| id | follow |
| json | ["follow",{"follower":"midastouch","following":"marketreport","what":["blog",""]}] |
| required auths | [] |
| required posting auths | ["midastouch"] |
| Transaction Info | Block #68794561/Trx 6d7ea7ea008cb6685cf5a430e1f886448e5fdc92 |
View Raw JSON Data
{
  "block": 68794561,
  "op": [
    "custom_json",
    {
      "id": "follow",
      "json": "[\"follow\",{\"follower\":\"midastouch\",\"following\":\"marketreport\",\"what\":[\"blog\",\"\"]}]",
      "required_auths": [],
      "required_posting_auths": [
        "midastouch"
      ]
    }
  ],
  "op_in_trx": 0,
  "timestamp": "2022-10-23T08:48:27",
  "trx_id": "6d7ea7ea008cb6685cf5a430e1f886448e5fdc92",
  "trx_in_block": 2,
  "virtual_op": 0
}msdbitcoupvoted (100.00%) @midastouch / september-1st-2022-gold-close-to-the-edge2022/09/04 13:18:57
msdbitcoupvoted (100.00%) @midastouch / september-1st-2022-gold-close-to-the-edge
2022/09/04 13:18:57
| author | midastouch |
| permlink | september-1st-2022-gold-close-to-the-edge |
| voter | msdbitco |
| weight | 10000 (100.00%) |
| Transaction Info | Block #67396115/Trx 711e466711ab952377d5497cb42d8aa783aeaa15 |
View Raw JSON Data
{
  "block": 67396115,
  "op": [
    "vote",
    {
      "author": "midastouch",
      "permlink": "september-1st-2022-gold-close-to-the-edge",
      "voter": "msdbitco",
      "weight": 10000
    }
  ],
  "op_in_trx": 0,
  "timestamp": "2022-09-04T13:18:57",
  "trx_id": "711e466711ab952377d5497cb42d8aa783aeaa15",
  "trx_in_block": 7,
  "virtual_op": 0
}midastouchupvoted (100.00%) @midastouch / september-1st-2022-gold-close-to-the-edge2022/09/04 12:54:48
midastouchupvoted (100.00%) @midastouch / september-1st-2022-gold-close-to-the-edge
2022/09/04 12:54:48
| author | midastouch |
| permlink | september-1st-2022-gold-close-to-the-edge |
| voter | midastouch |
| weight | 10000 (100.00%) |
| Transaction Info | Block #67395639/Trx 068834057f3a3cdfd1587d99937b91658d877a74 |
View Raw JSON Data
{
  "block": 67395639,
  "op": [
    "vote",
    {
      "author": "midastouch",
      "permlink": "september-1st-2022-gold-close-to-the-edge",
      "voter": "midastouch",
      "weight": 10000
    }
  ],
  "op_in_trx": 0,
  "timestamp": "2022-09-04T12:54:48",
  "trx_id": "068834057f3a3cdfd1587d99937b91658d877a74",
  "trx_in_block": 40,
  "virtual_op": 0
}midastouchpublished a new post: september-1st-2022-gold-close-to-the-edge2022/09/04 12:54:24
midastouchpublished a new post: september-1st-2022-gold-close-to-the-edge
2022/09/04 12:54:24
| author | midastouch |
| body |  # [September 1st, 2022: Gold – Close to the edge](https://www.midastouch-consulting.com/01092022-gold-close-to-the-edge) In our last in-depth gold analysis we had been optimistically forecasting a recovery and summer rally for the gold price. And indeed, from its low at 1,680 USD gold rallied to 1,808 USD within less than three weeks. However, since mid of August gold came down hard again and is now training just slightly above 1,700 USD. Gold – Close to the edge. ### Review Although gold prices have held up much better against the US-Dollar (-6.74%) and especially against the Euro (+5.83%) than almost all other asset classes so far this year, investors’ nerves have also been strained here. While official inflation rates shot up to record highs, the gold market has instead seen first euphoria, then sheer panic and finally a disappointing summer rally over the past eight months. The first three months, however, brought an attack on the all-time high with a top at 2,070 USD. From mid-March, though, gold bears gradually took control again and pushed prices down mercilessly in the wake of the crashing financial markets. Only at a low of 1,680 USD on July 21st (= a discount of almost 400 USD from the high on March 8th) the gold bear temporarily disappeared after a four and a half months assault. 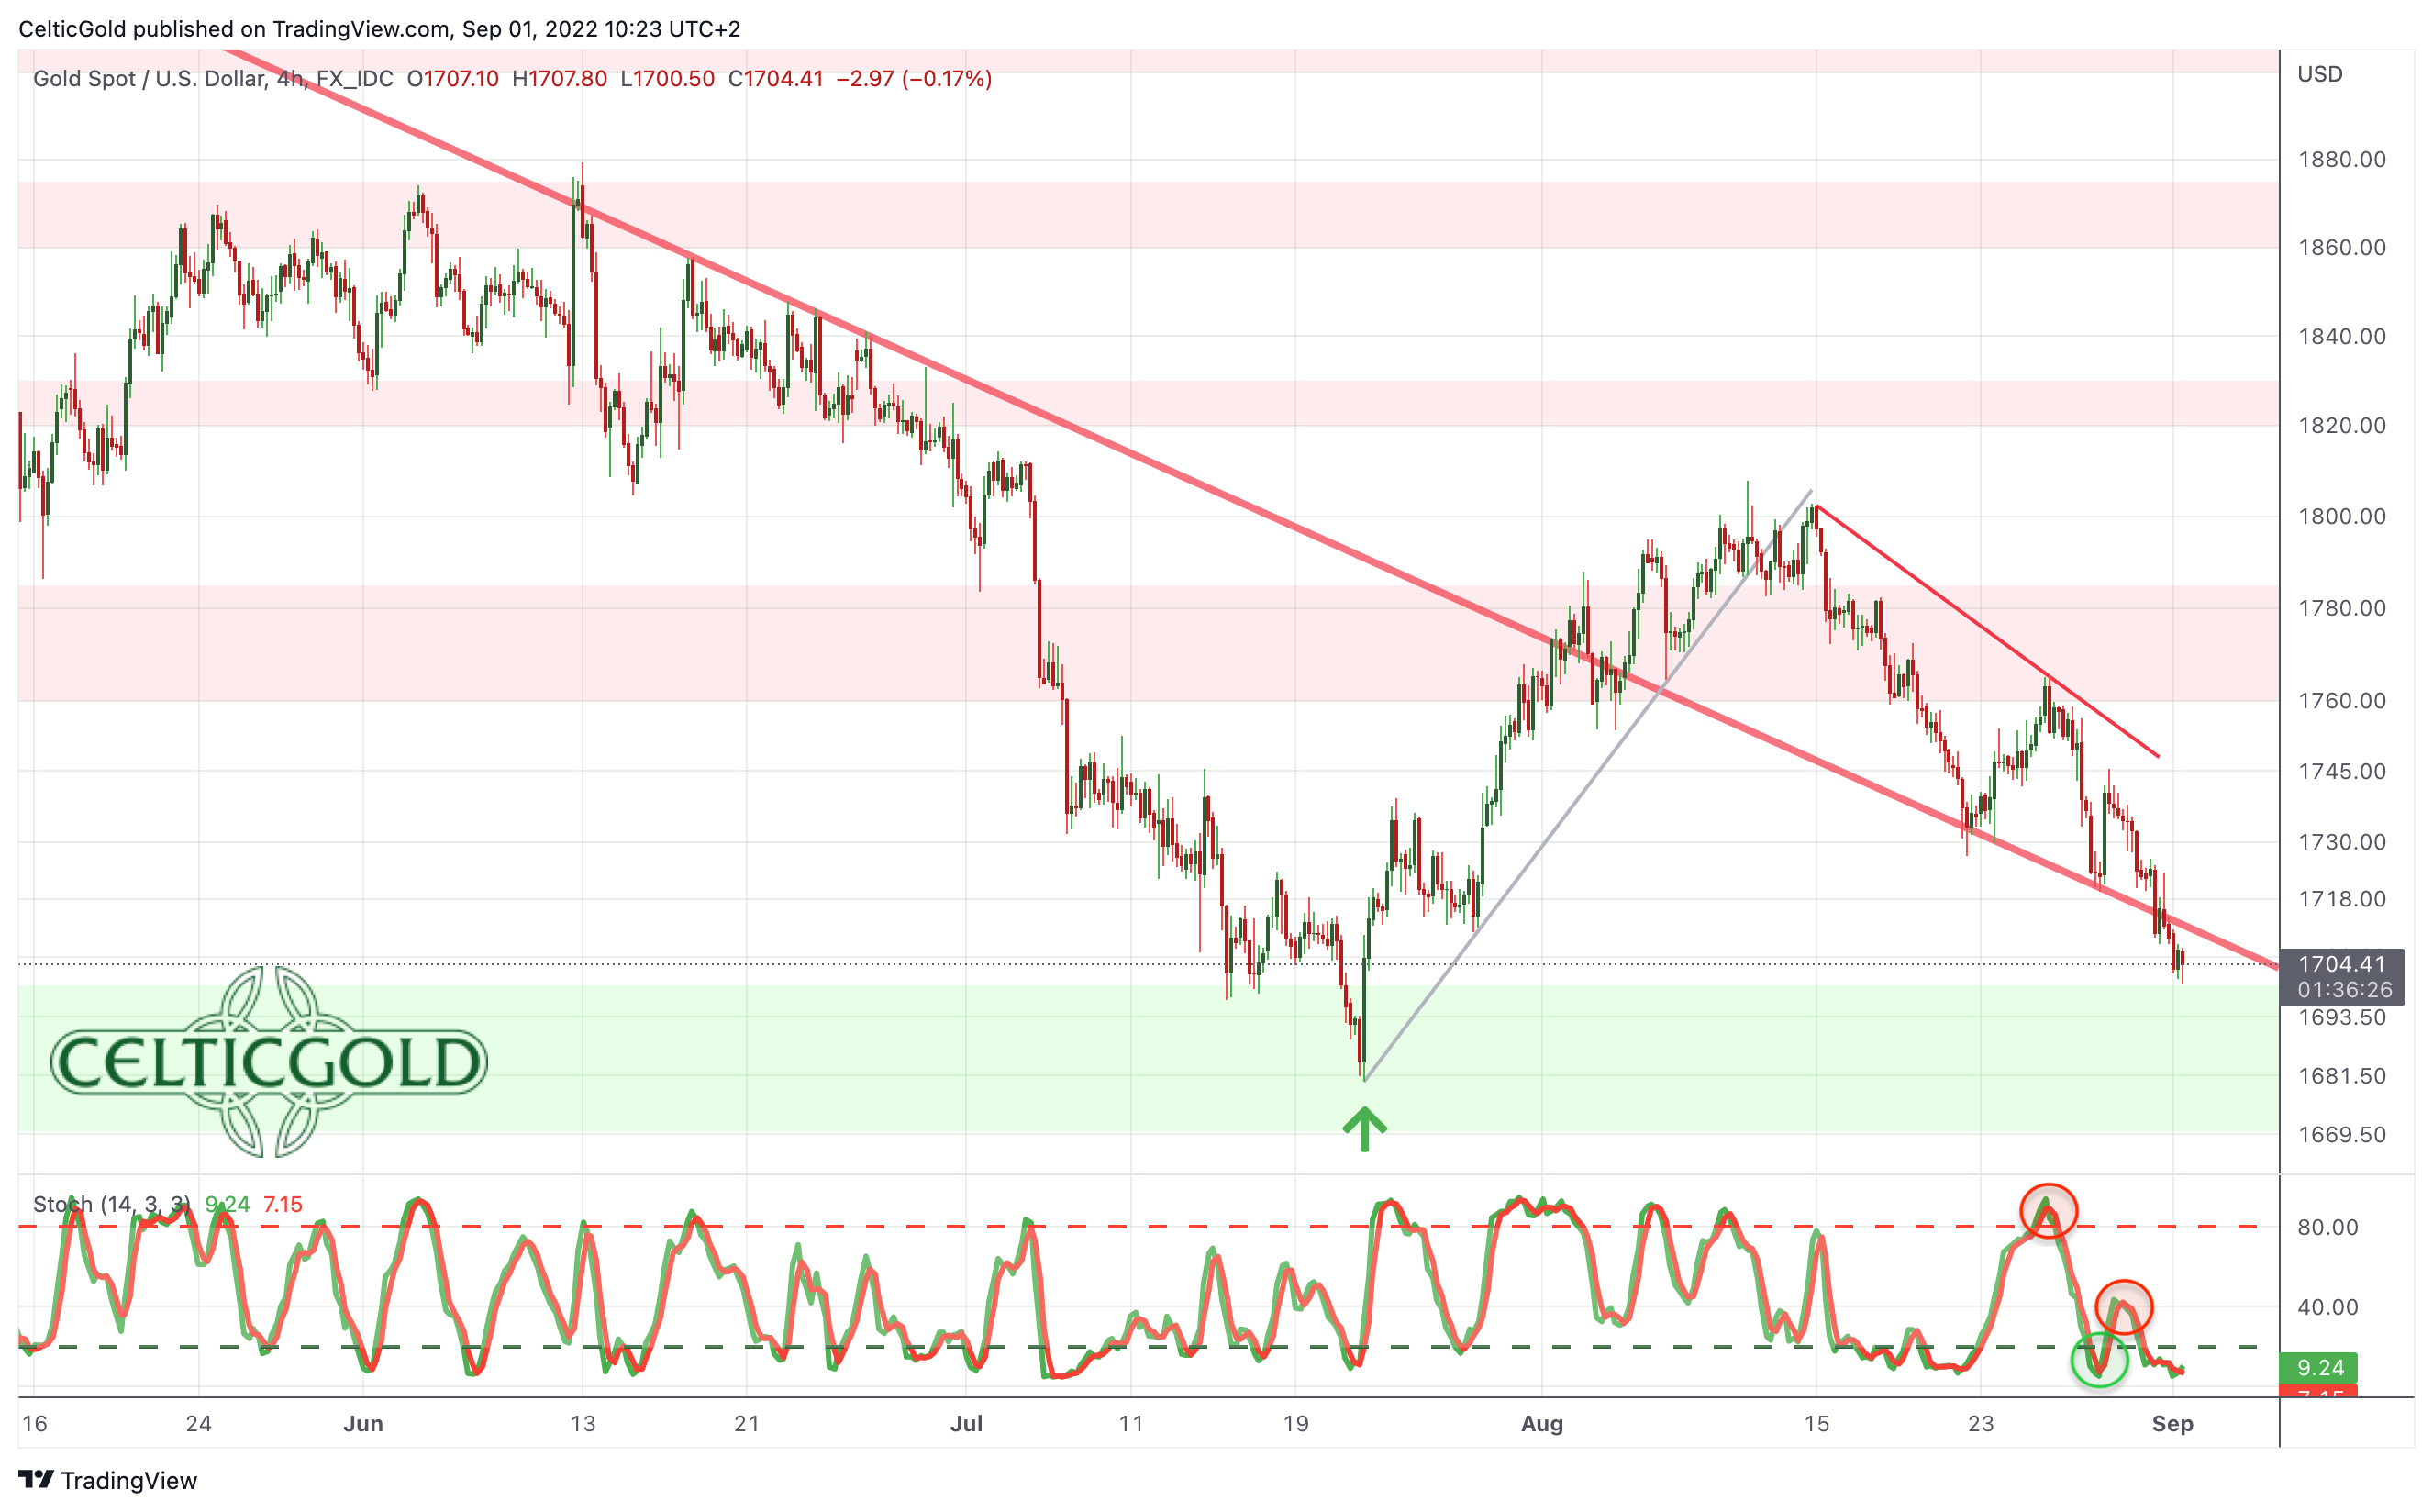 *Gold in US-Dollars, 4-hour chart from September 1st, 2022. Source: Tradingview* Since then, a brisk recovery initially made its way back to 1,808 USD. However, this summer rally is seriously called into question with a deep pullback towards 1,702 USD as of today. In the wake of Fed President Jerome Powell’s speech last Friday in Jackson Hole, all markets came under such significant pressure. Hence, the end of the bear-market rally in financial markets is likely in place. Gold prices also had to let go again and trading at a five-week low. Thus, the threat of dropping below the extremely important support at 1,680 USD is growing by the hour. ### Technical Analysis: Gold in US-Dollar #### Weekly Chart – Back below the upper edge of the 2-year up-trend channel 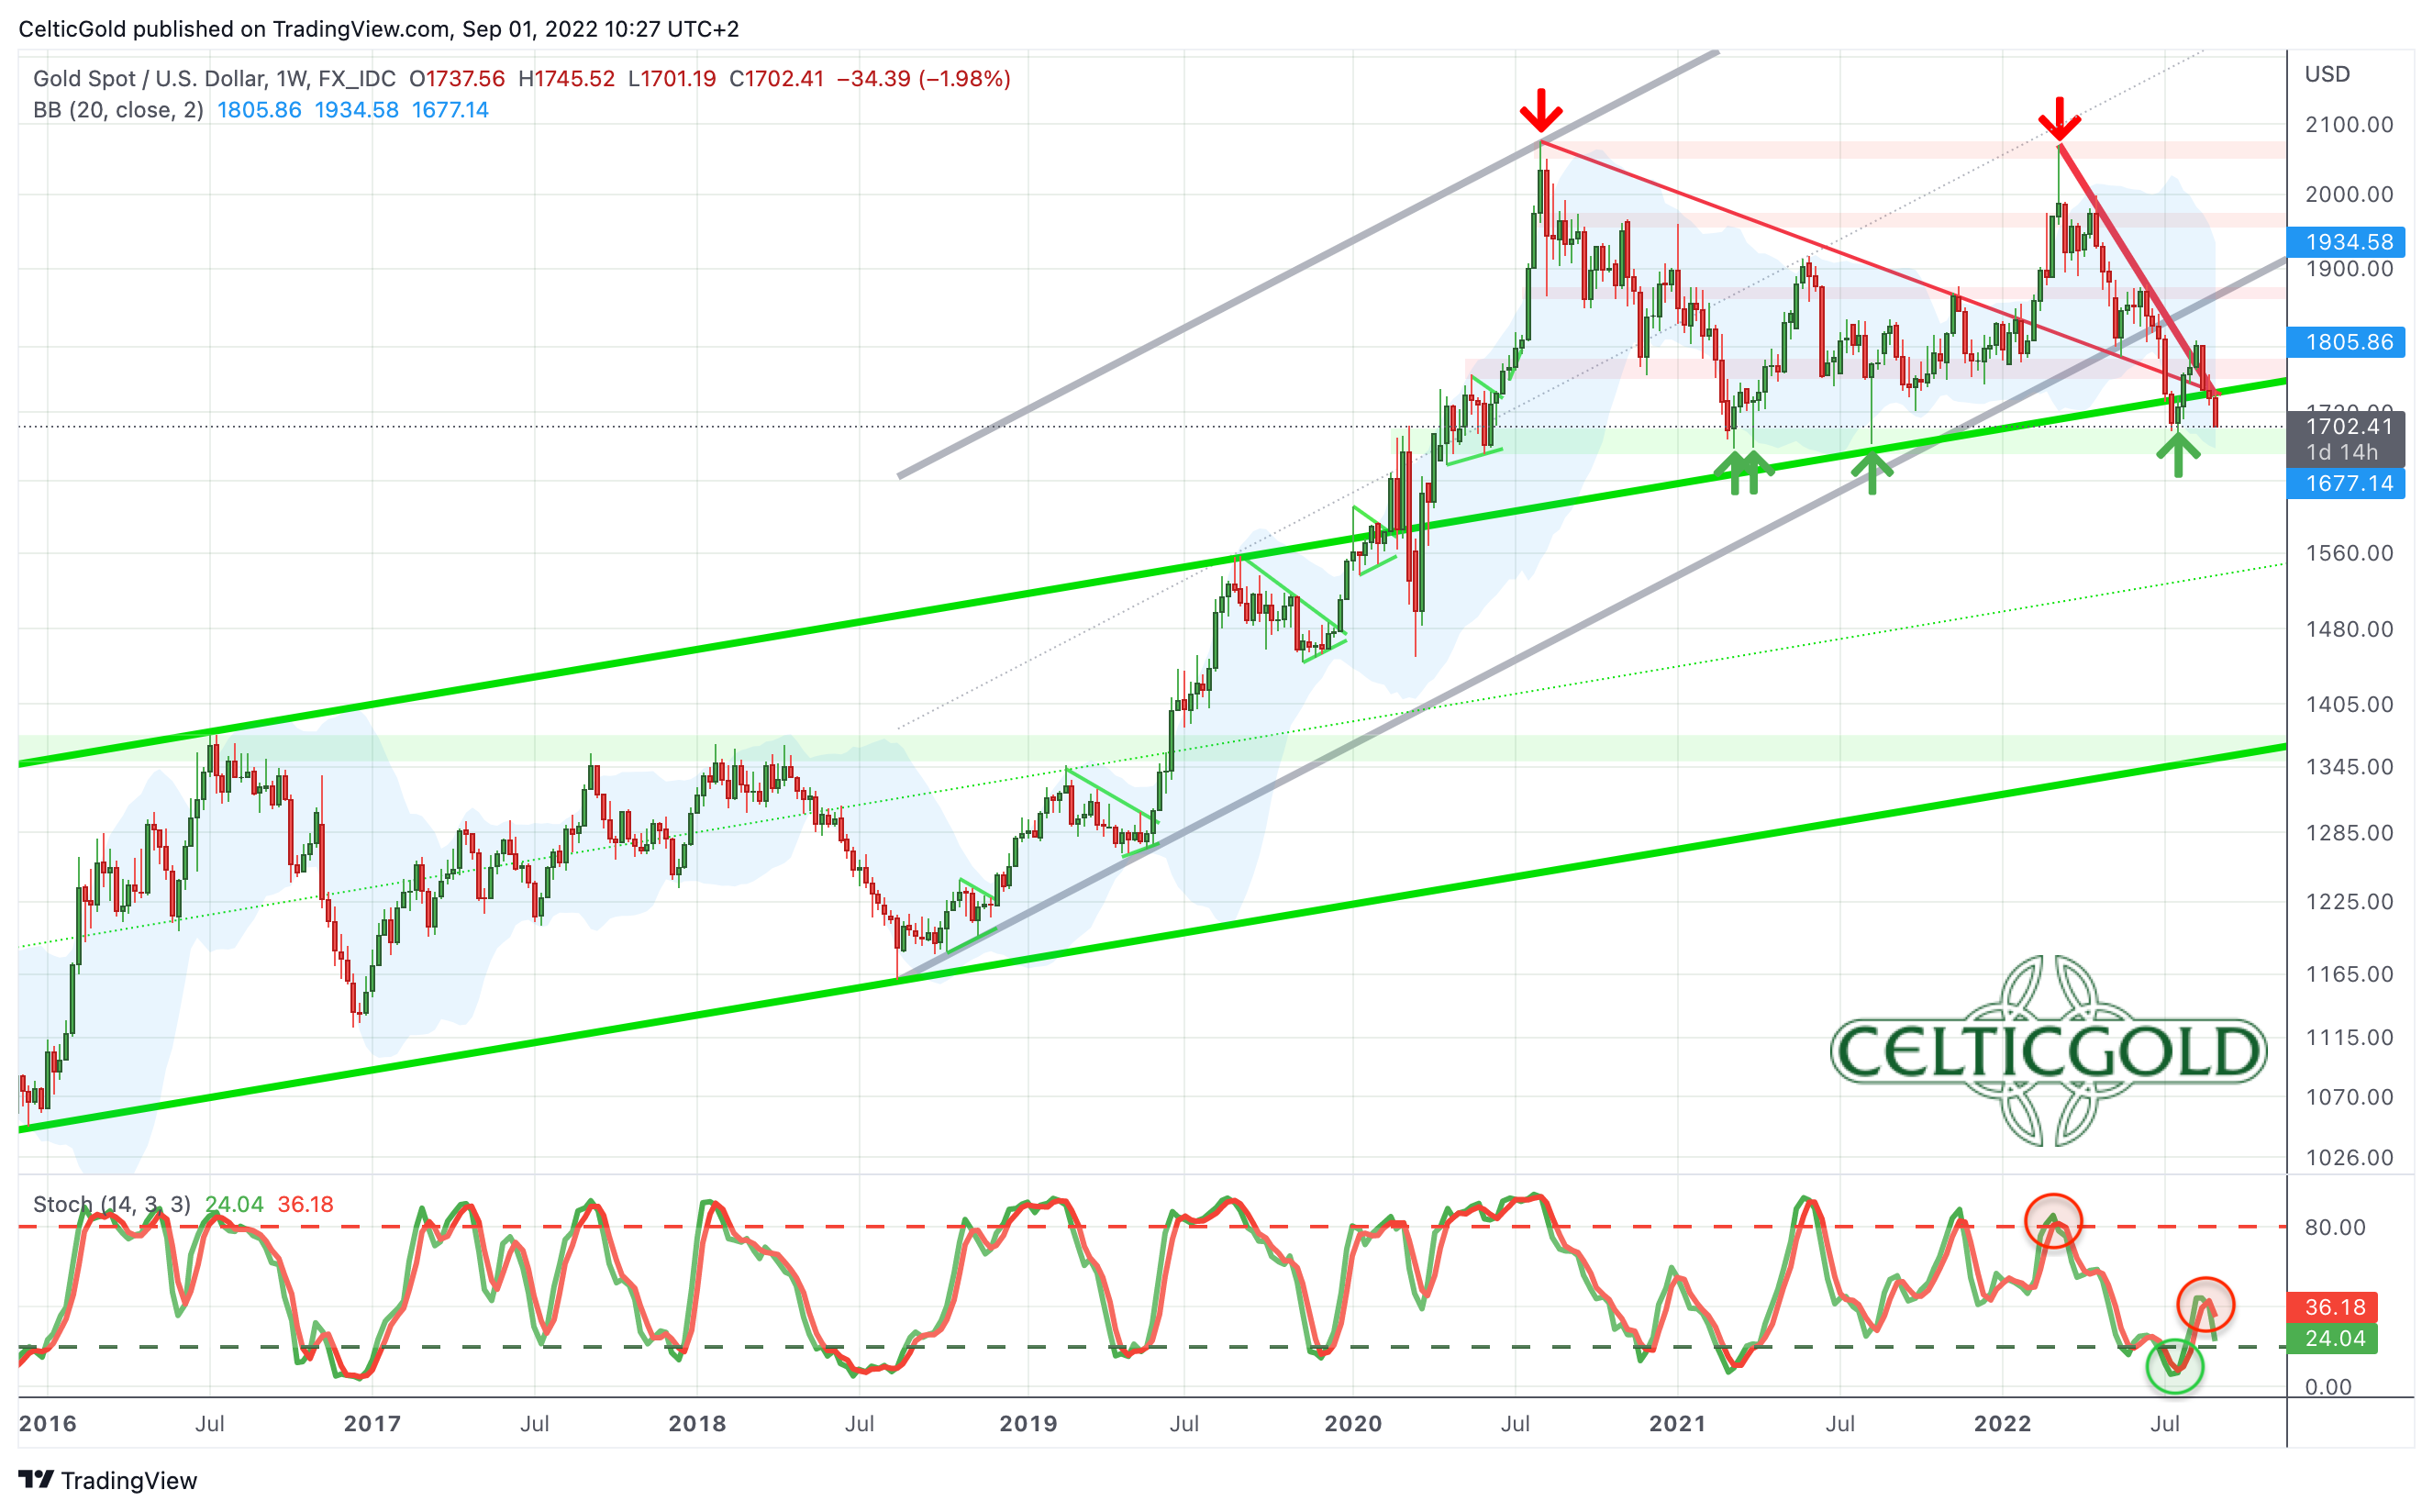 *Gold in US-Dollars, weekly chart as of September 1st, 2022. Source: Tradingview* On the weekly chart, gold managed to catch a bid just below the upper edge of the light green uptrend channel five and a half weeks ago. This fourth low around 1,680 USD, in conjunction with a strongly oversold condition, provided a quick bounce in the order of +7.55%. However, at a high of 1,808 USD the summer rally did not run very far and did not even reach the 38.2% retracement (1,820 USD) of the entire correction wave down since March 7th. The promising buy signal from the stochastic oscillator was quickly lost again due to the weak price performance since August 10th. Thus, the situation on the weekly chart has deteriorated significantly. If gold bulls could stabilize price action around the upper edge of the light green up-trend channel once again, a second recovery wave towards the middle Bollinger Band (1,819 USD) and higher is still a possibility. But as prices are already flirting with the round psychological number of 1,700 USD, a fifth test of 1,680 USD seems to be rather imminent and would further soften this support. Hence, a breakdown below this extremely important support is very likely after all. In this case, gold could quickly plunge lower and prices around 1,625 USD would be the minimum target. However, since a break below 1,680 USD would also mean a clear dive back into the old uptrend channel, a test of the bottom of the channel (currently around 1,350 USD) would be the “worst case” scenario. Overall, the weekly chart is neutral, but a directional decision should crystallize over the coming weeks. As long as gold can defend the zone between 1,700 and 1,720 USD, there is a chance of a continuation of the summer rally. However, below 1,700 USD at the latest, the path is clearly pointing to the downside and gold is likely to sail further south in the fall together with the presumably collapsing financial markets. #### Daily Chart – 130 USD below the 200-day moving average 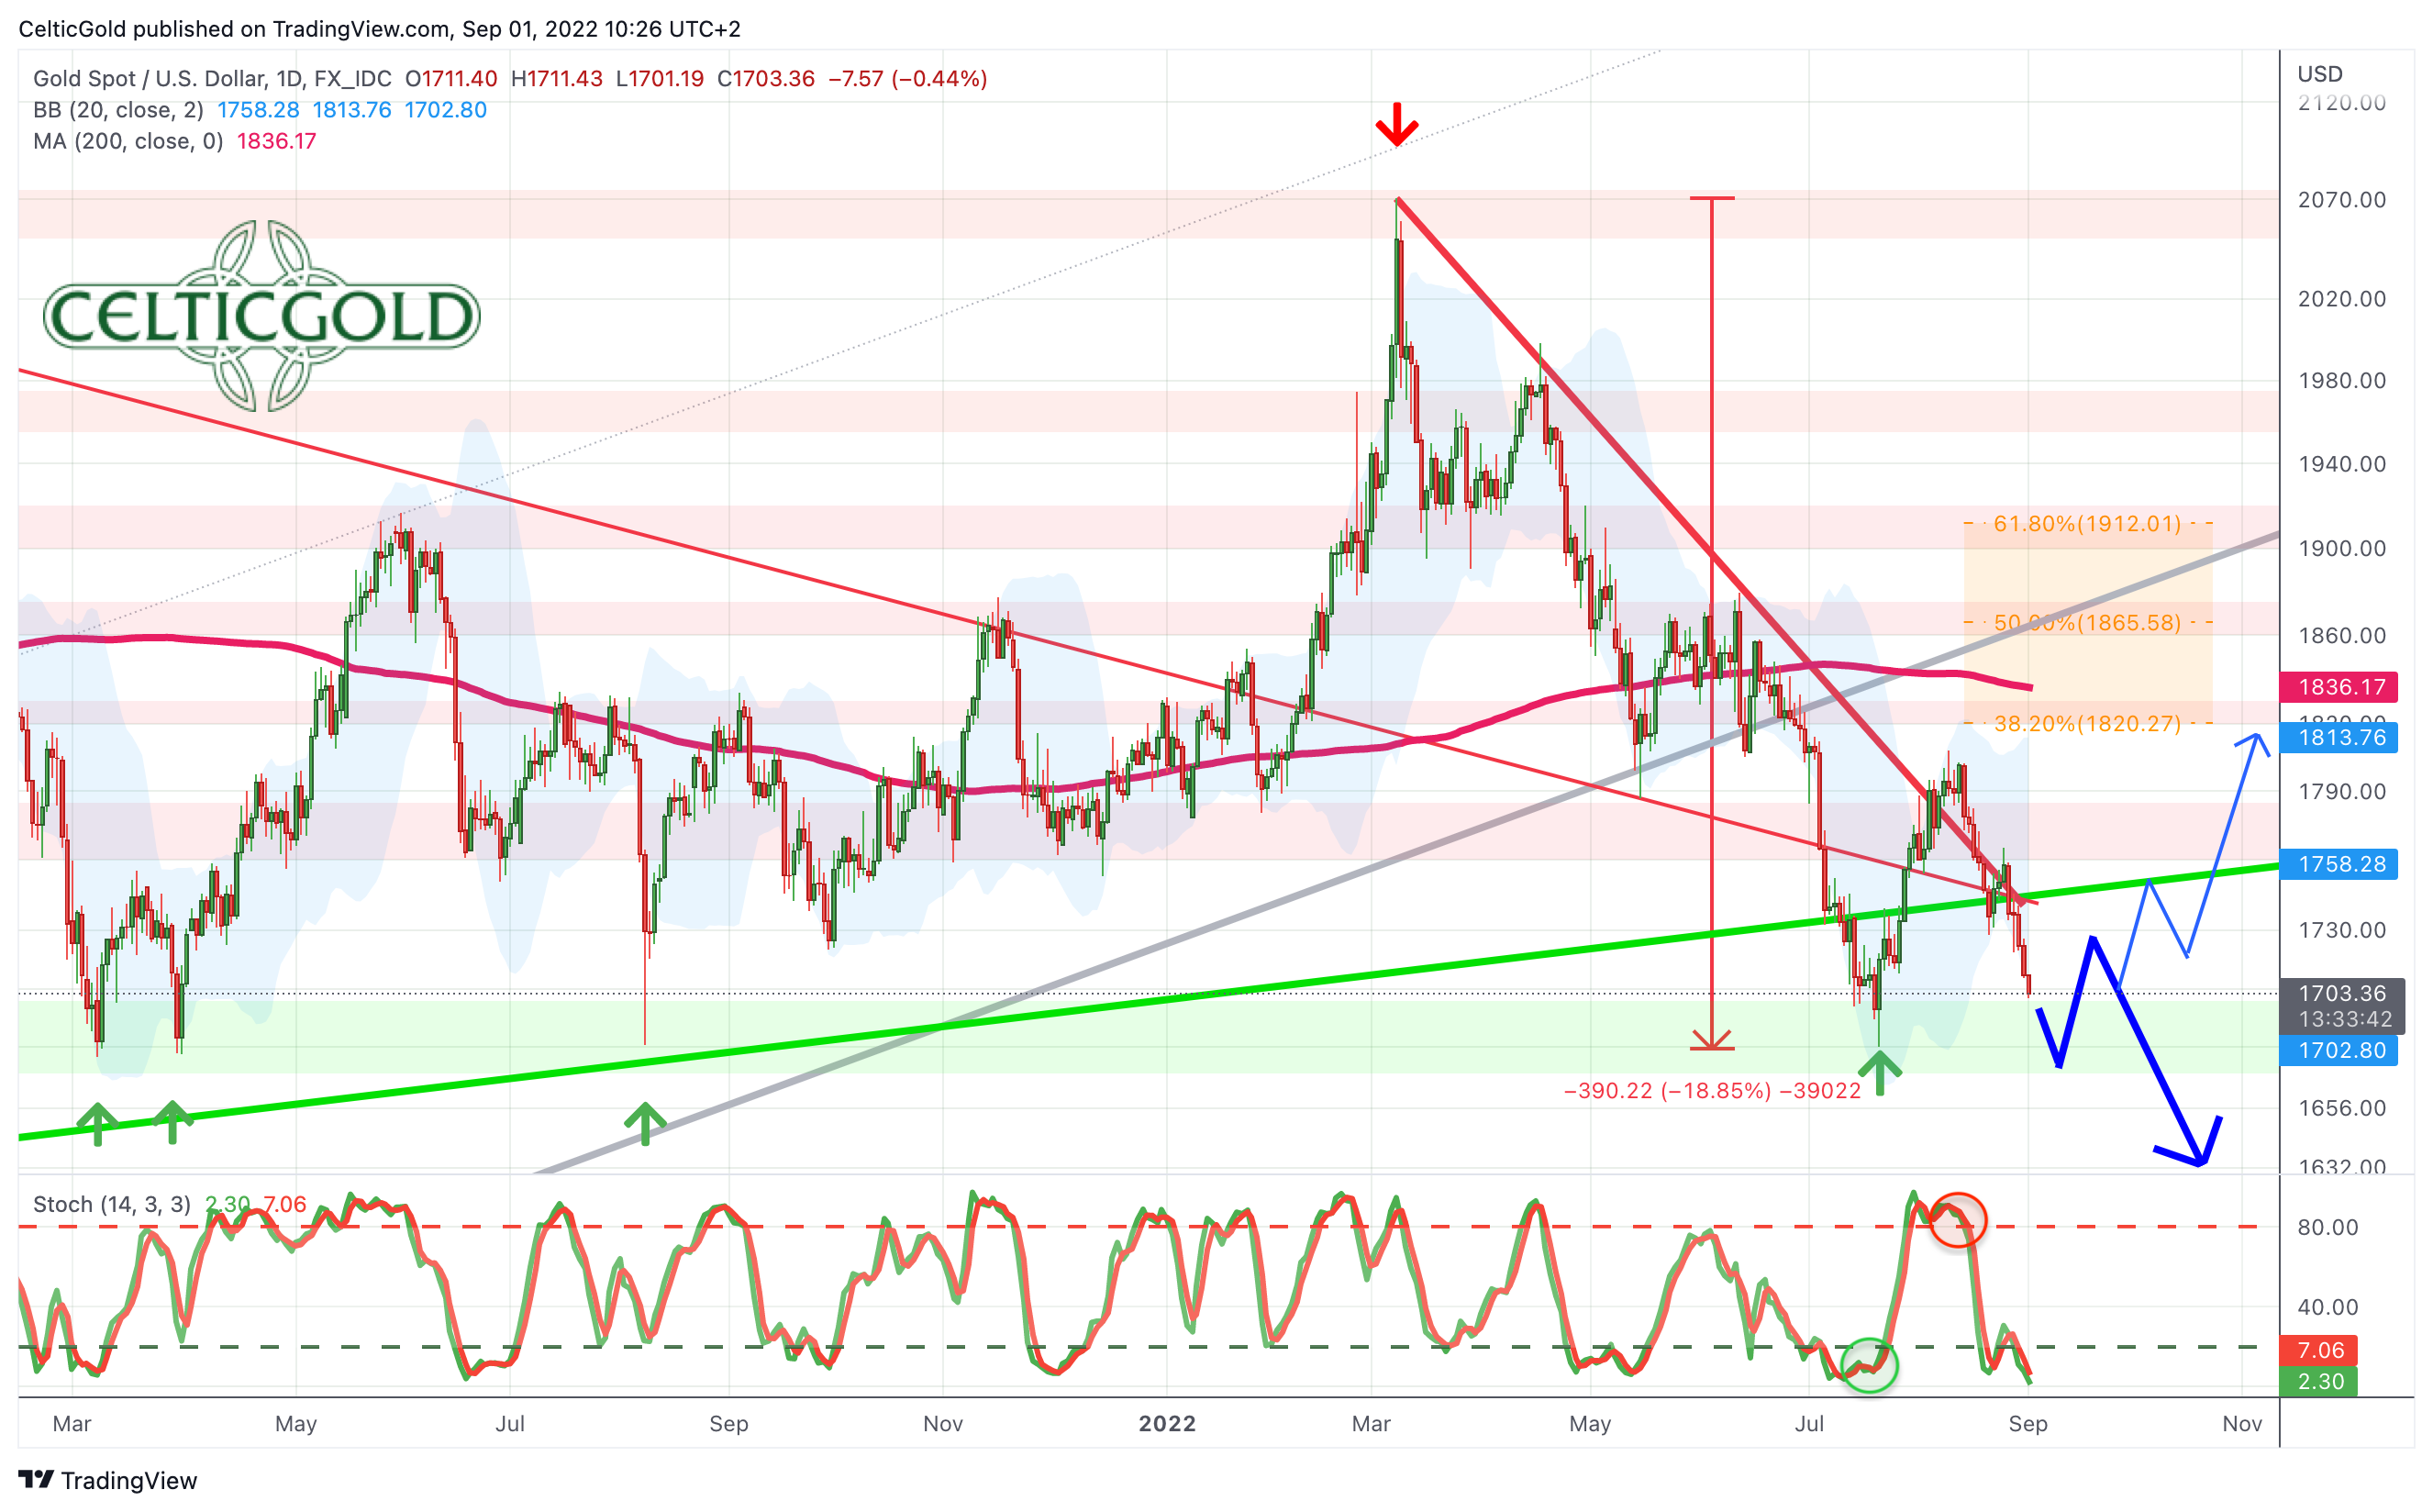 *Gold in US-Dollars, daily chart as of September 1st, 2022. Source: Tradingview* On its daily chart, gold is currently trading 130 USD below its slightly falling 200-day line (USD 1,835). This classic moving average would have been predestined as the minimum target of the summer rally. So far, gold has not made it back to that line in the sand. Instead, bulls already ran out of steam at 1,808 USD and the deep pullback towards 1,713 USD rather confirms the bearish setup. At least, the daily stochastic oscillator is extremely oversold. But markets can remain oversold for much longer than most investors can imagine! At the moment, the lower Bollinger Band (USD 1,705) is bending to the downside and hence not offering good support. All in all, the daily chart is bearish and gold looks very weak. Given the oversold stochastic and the numerous support between USD 1,680 and USD 1,700, a continuation of the recovery towards USD 1,835 plus X still has a chance for now. Nevertheless, the dangers on the downside must be taken very seriously in view of the unstable overall situation in financial markets. ### Commitments of Traders for Gold – Close to the edge 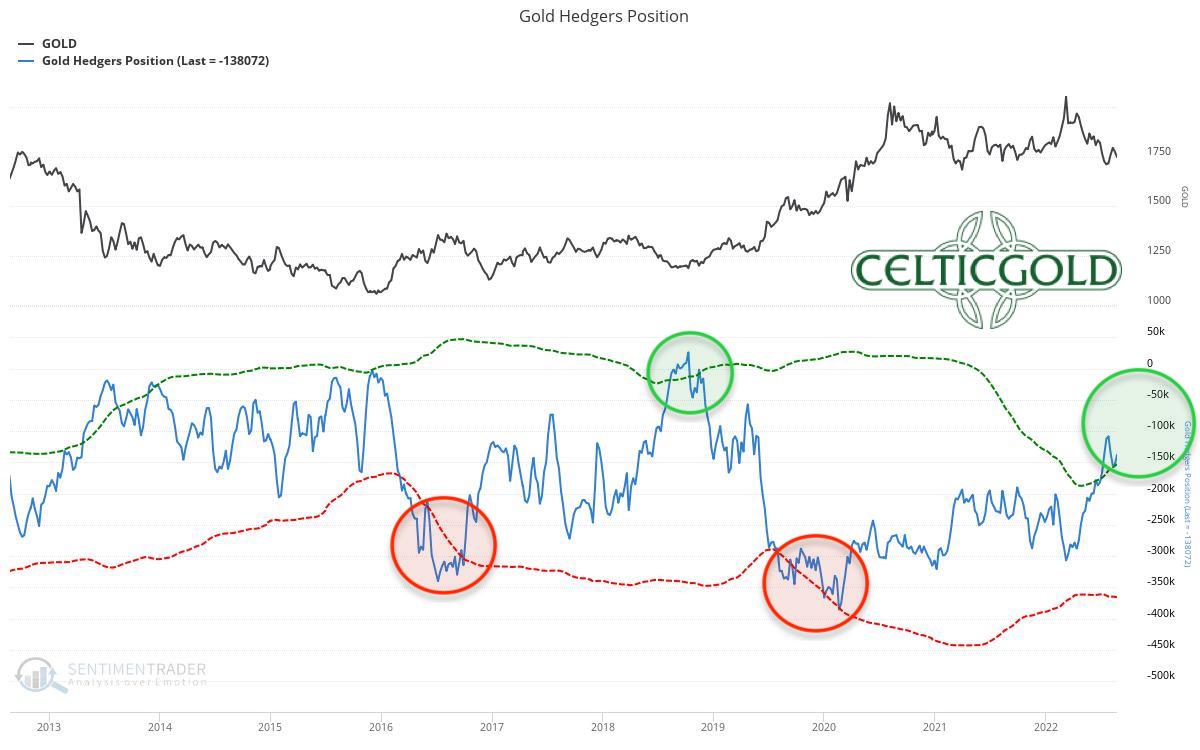 *Commitments of Traders for Gold as of August 27th, 2022. Source: Sentimentrader* The cumulative net short position of commercial market participants has recently reduced slightly again and stood at 138,072 short sold contracts as of Tuesday, August 27th. The commercial net short position is thus again close to the threshold of 100,000 short contracts, at which one can speak of a rather bullish CoT report for the gold market. In summary, the CoT report is to be classified as cautiously bullish. ### Sentiment for Gold – Close to the edge 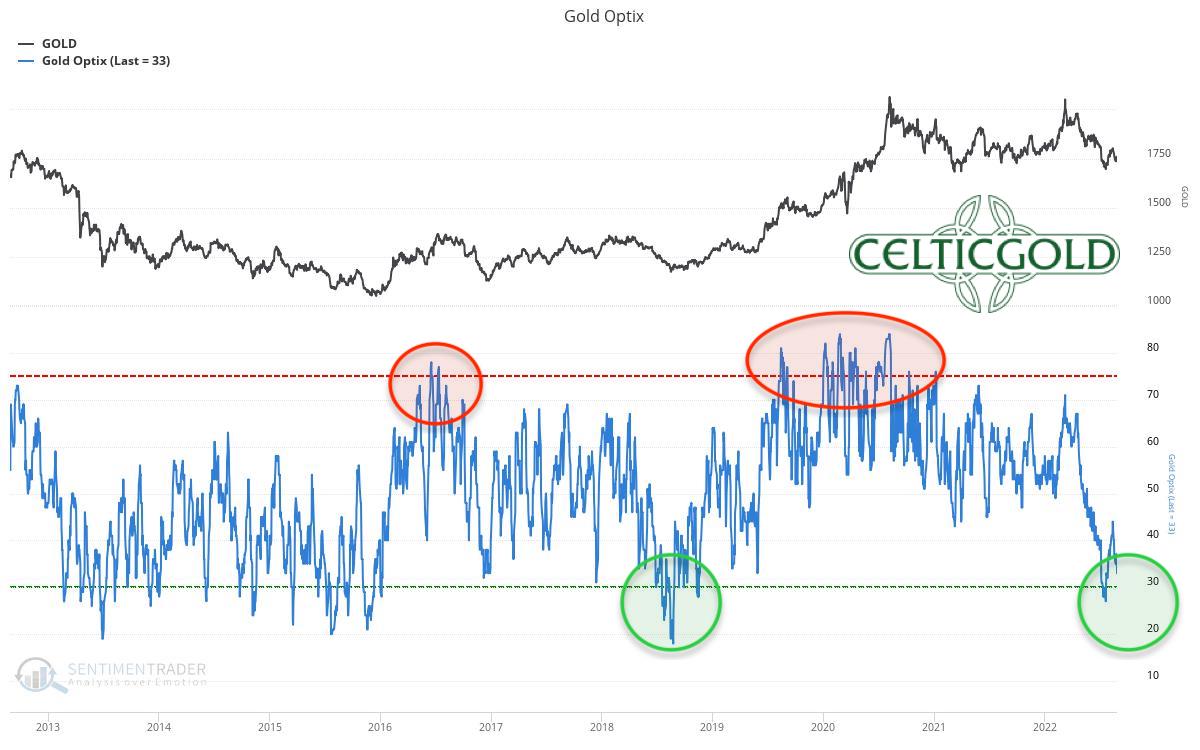 *Sentiment Optix for Gold as of August 27th, 2022. Source: Sentimentrader* In July, gold´s sentiment had fallen to its lowest level in four years. The interim recovery led to an initial relief. Now, sentiment analysis is again measuring relatively high levels of pessimism, pointing to a contrarian opportunity in the bigger picture. However, a bottoming process may well take some time, similar to the fall of 2018. Back then, high pessimism levels occurred repeatedly over a period of almost five and a half months. This bombed-out sentiment then laid the foundation for the fulminant rise from 1,160 USD to 2,070 USD within the following two years. Overall, the sentiment traffic light is green and continues to provide a contrarian buy signal! ### Seasonality for Gold – Close to the edge 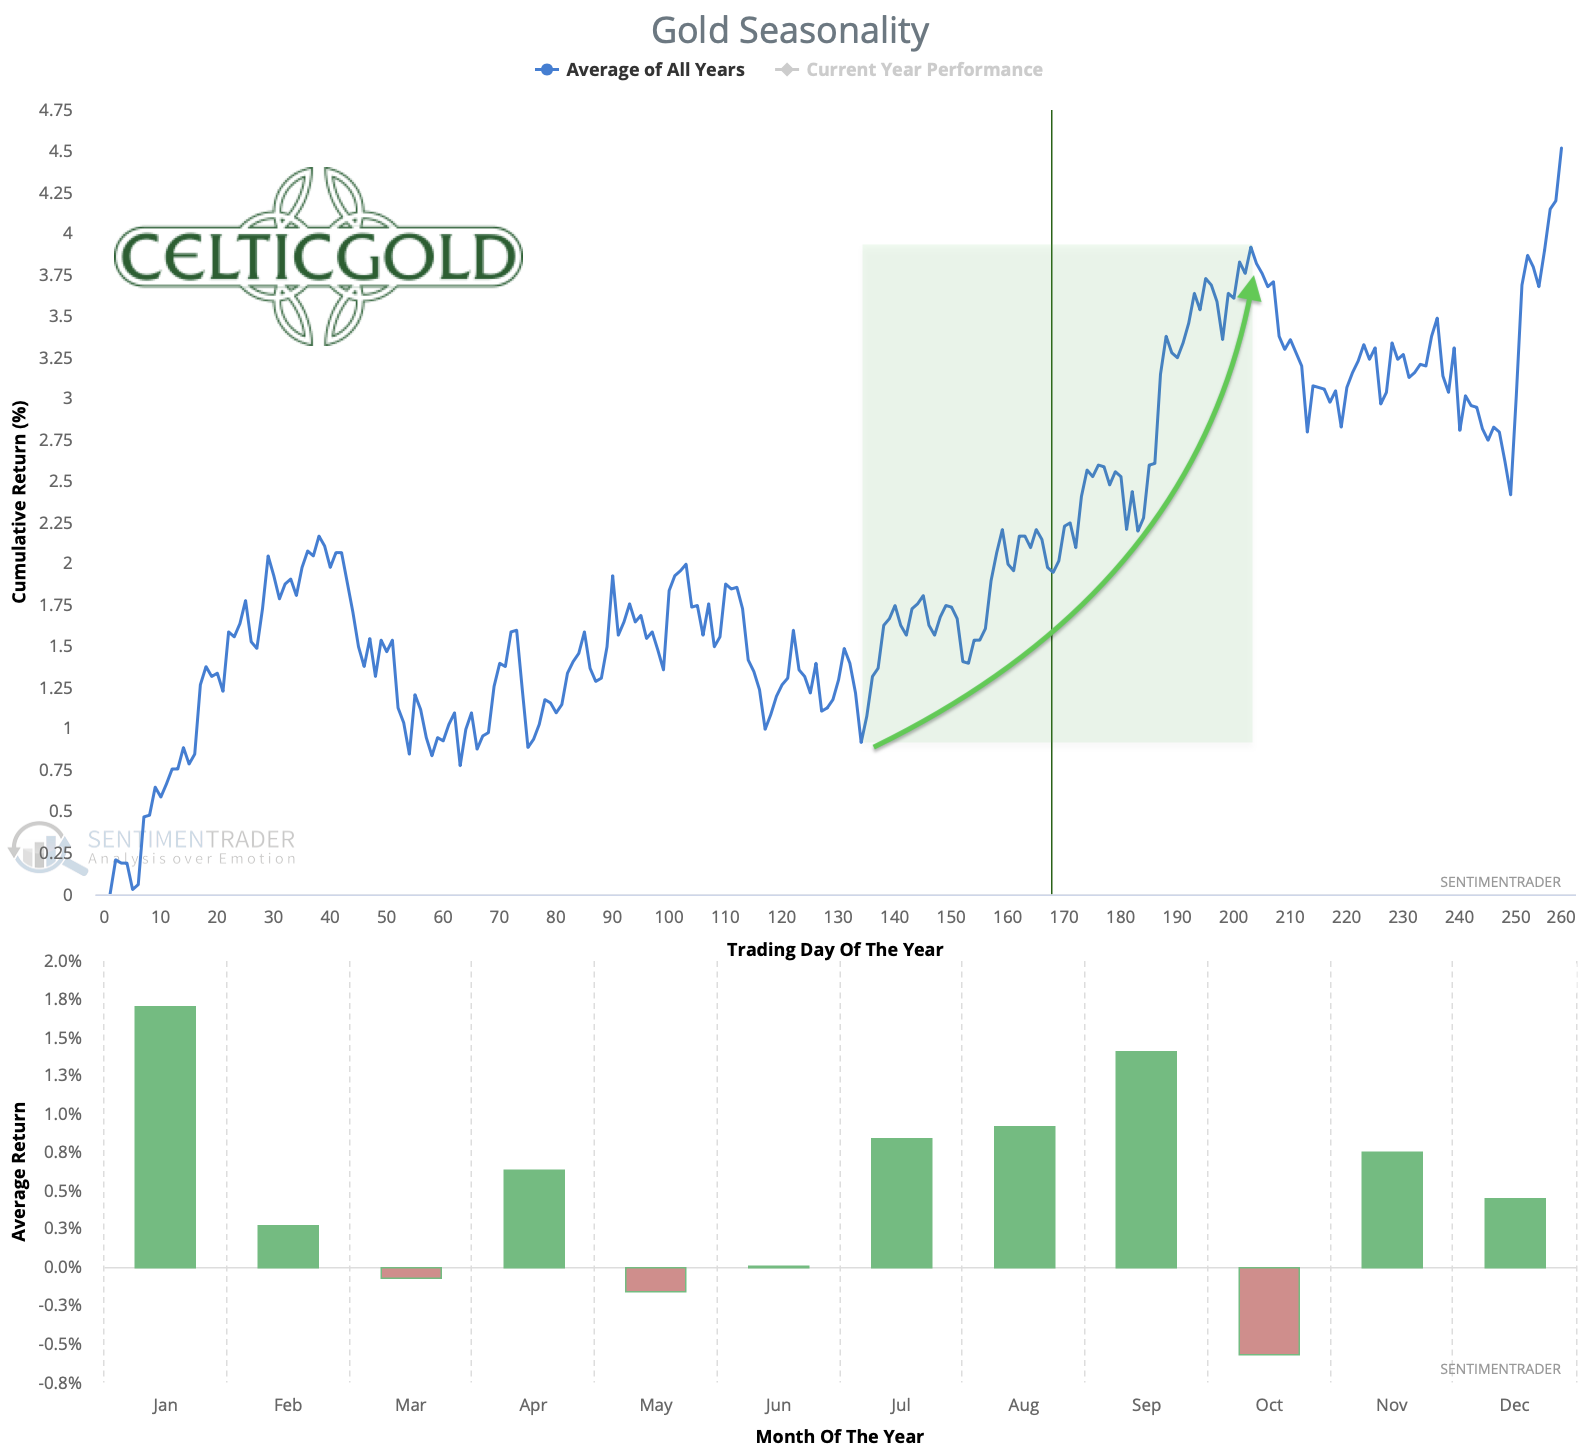 *Seasonality for Gold over the last 53-years as of August 27th, 2022. Source: Seasonax* From a seasonal perspective, gold is currently right in the middle of its best phase of the year. According to the statistics of the last 54 years, this favorable timeframe typically extends from the beginning of July to the beginning of October. Accordingly, the seasonal component would still be very supportive for the next four to six weeks. Seasonality for gold and silver is still strongly bullish until early October. ### Macro update: Recession and stagflation 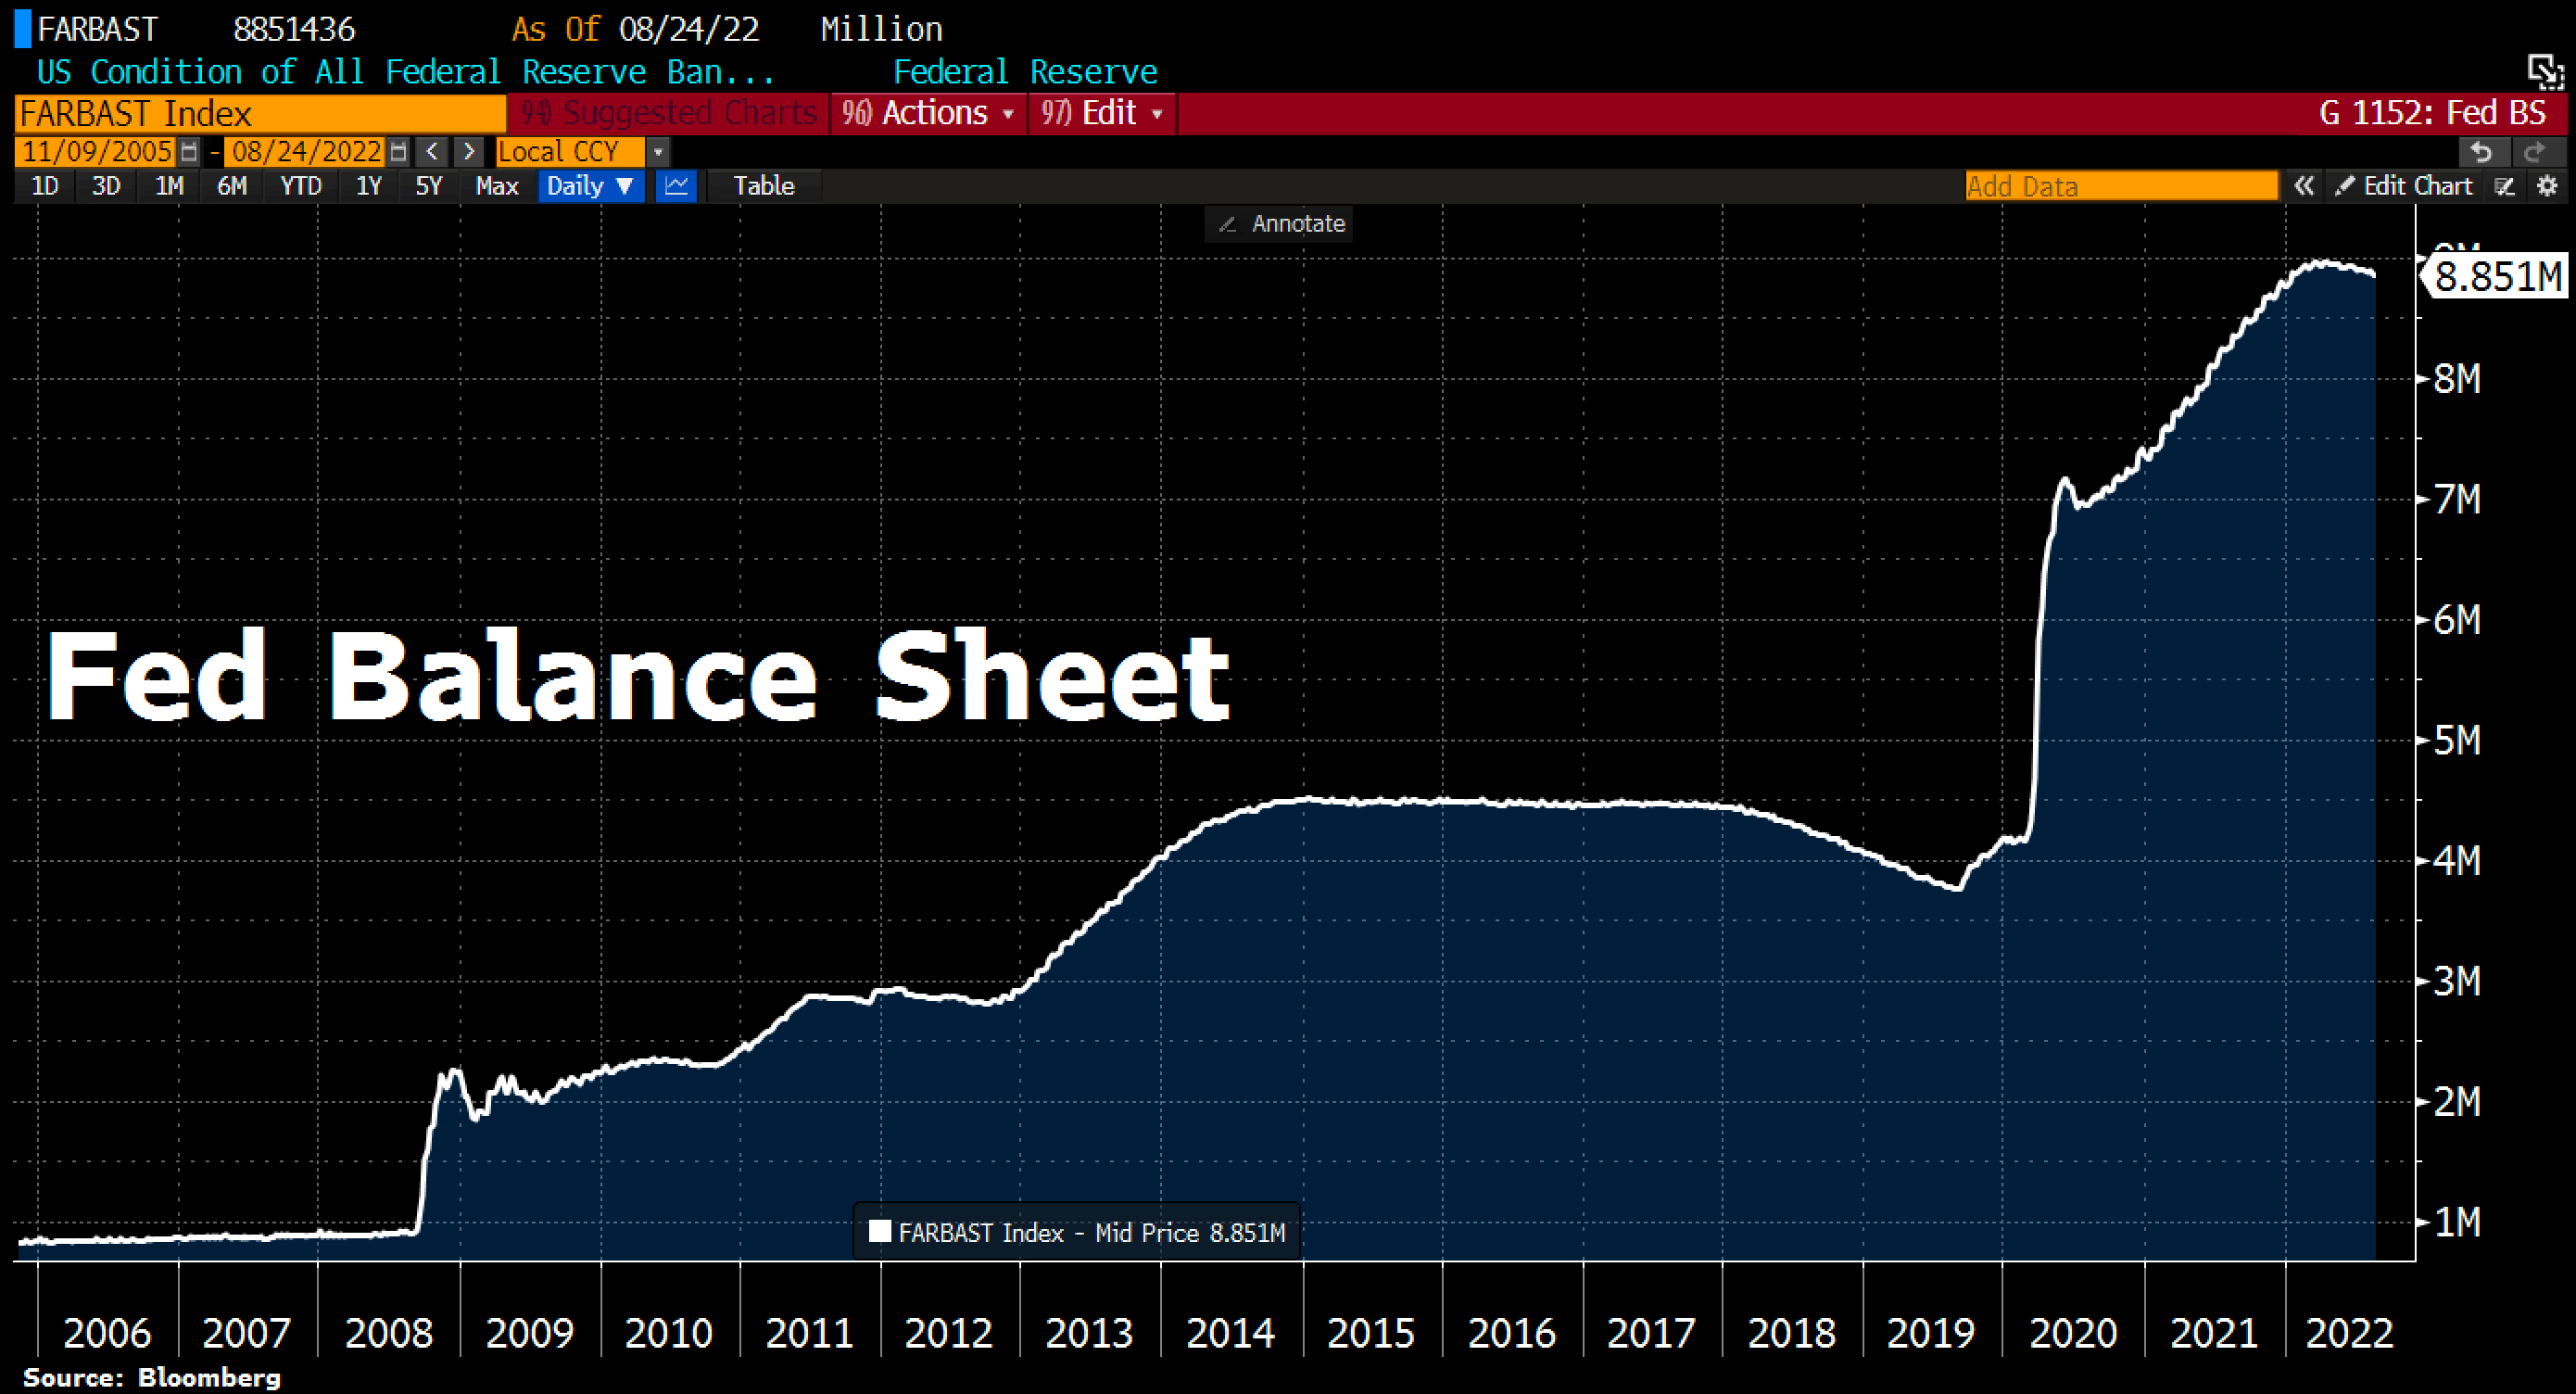 *FED Balance Sheet Total as of August 24th , 2022, ©Holger Zschaepitz* Last Friday, U.S. Federal Reserve Chairman Jerome Powell announced a tough stance on inflation in his speech at the key central bankers’ meeting in Jackson Hole. He signaled new rate hikes and prepared investors for a weaker economy. In reality, however, shrinking the Fed’s balance sheet does not appear to be that easy. Last week, for example, the Fed’s total assets rose by 1.7 billion USD to 8,851.4 billion USD. In retrospect, total assets have been reduced by just 114 billion USD, or 1.3%, since the start of quantitative tightening. 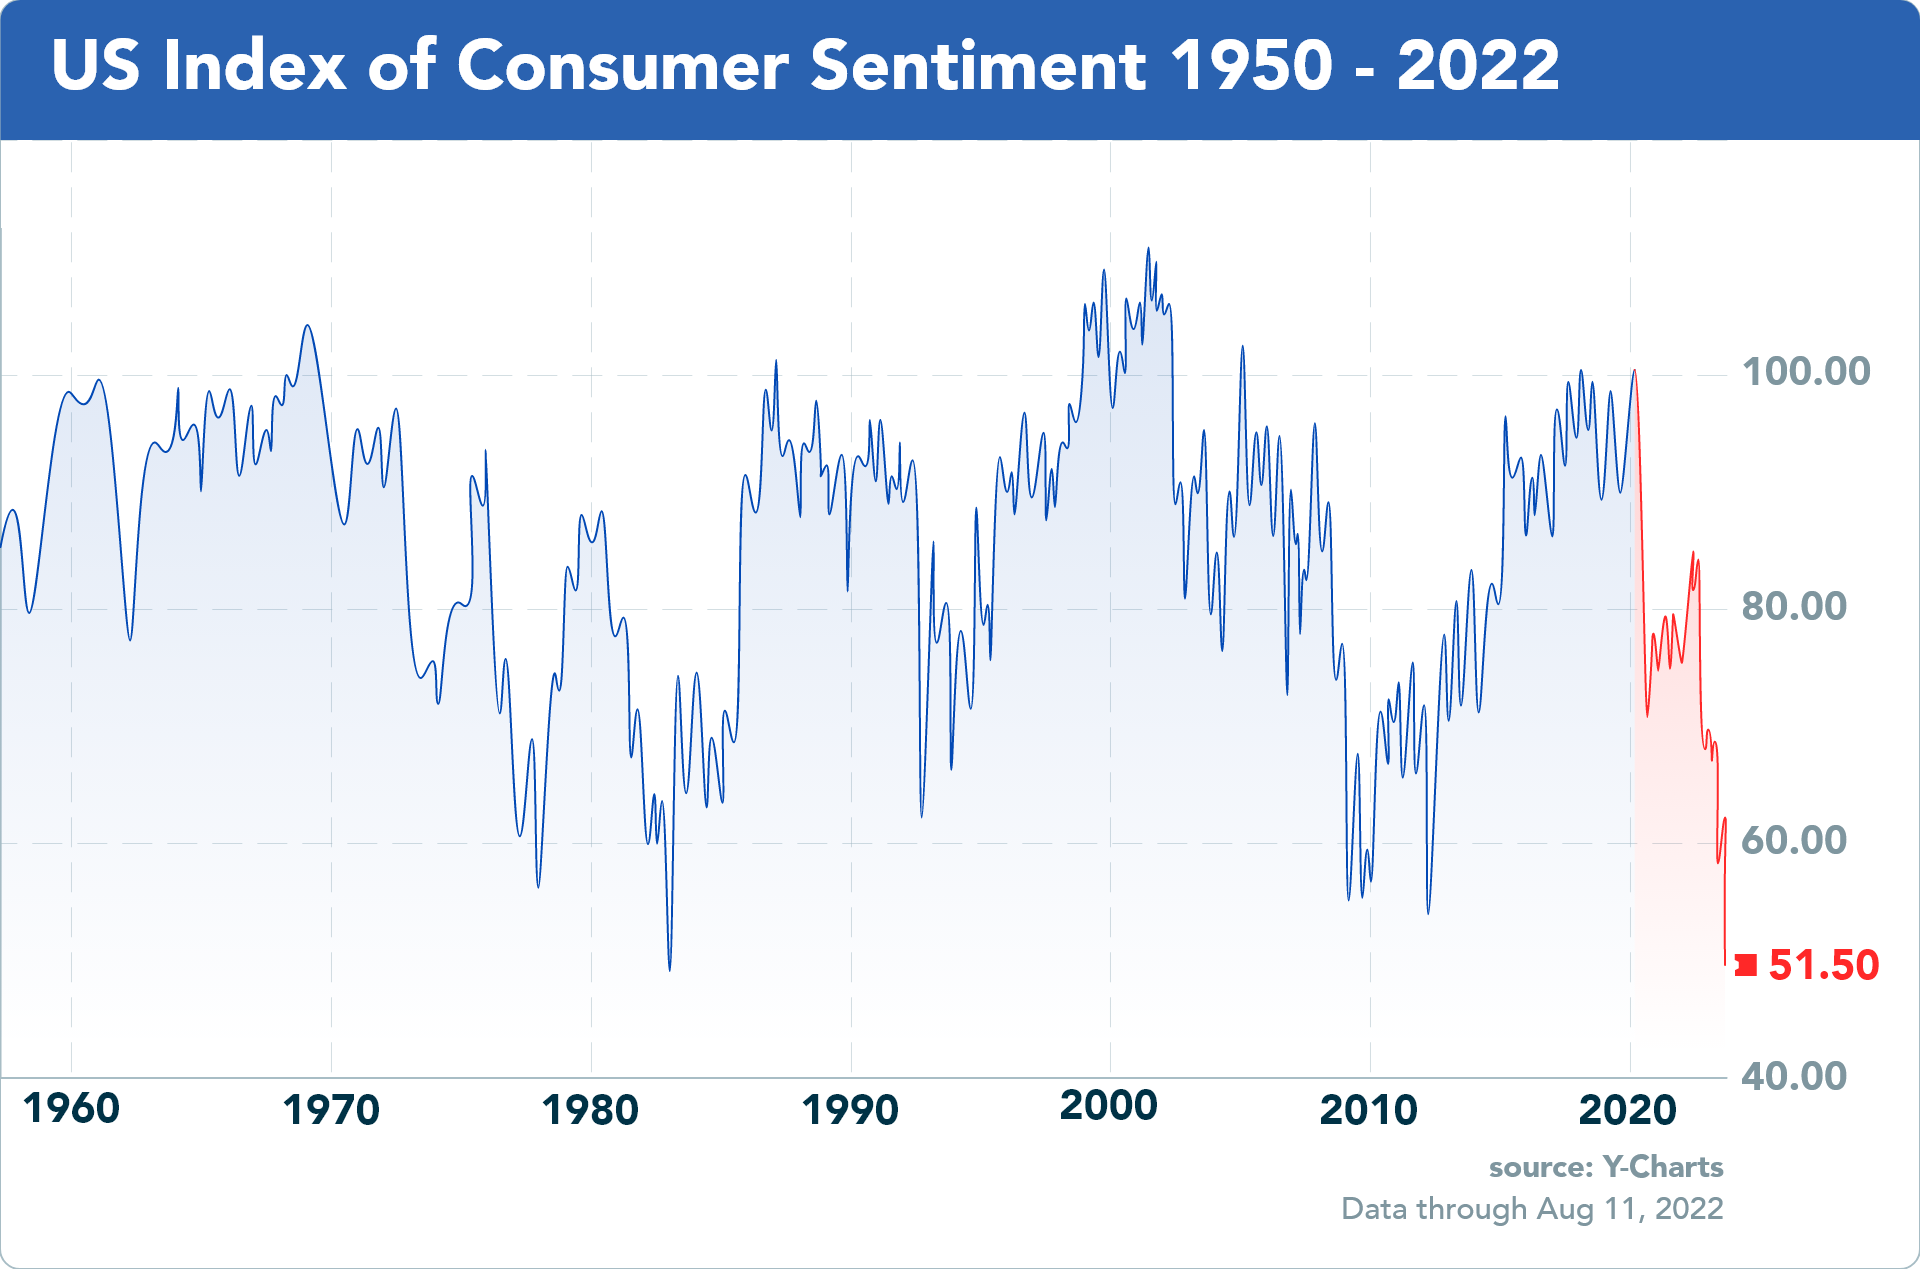 *US-Consumer Sentiment as of August 11th, 2022. ©Y-Charts* However, financial markets have responded to this minor reduction in the balance sheet total in recent months with a sharp correction and a bear market. Already, U.S. consumer confidence has fallen to its lowest level since the early 1980s! Likewise, CEO confidence in the U.S. has fallen to its lowest level in 14 years. Many other key data are on the verge of rolling over. A recession has already been confirmed. The only question now is how bad it will actually get. 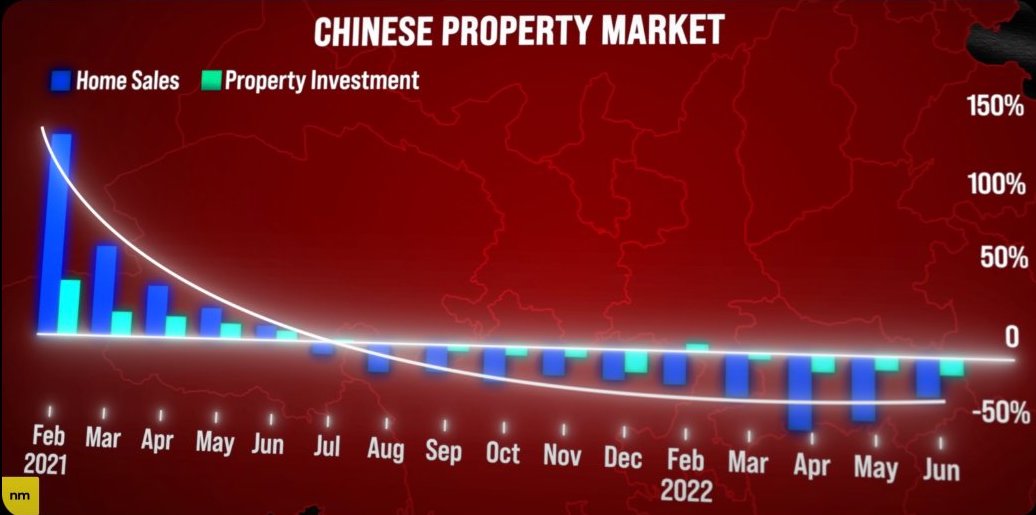 *Chinese property market as of August 22nd, 2022. ©Market Sentiment* The already dramatic situation is intensified by the collapsing Chinese real estate market. The world’s largest and thus most important sector has already been under tremendous pressure for over a year and is increasingly collapsing. The total value amounts to more than 60 trillion USD, i.e. more than the entire US stock market and more than twice the US real estate market. S&P recently predicted a further decline of about 30%, which would be about 1.5 times worse than the 2008 financial crash. We had warned in detail and in good time about those consequences in the fall of 2021. 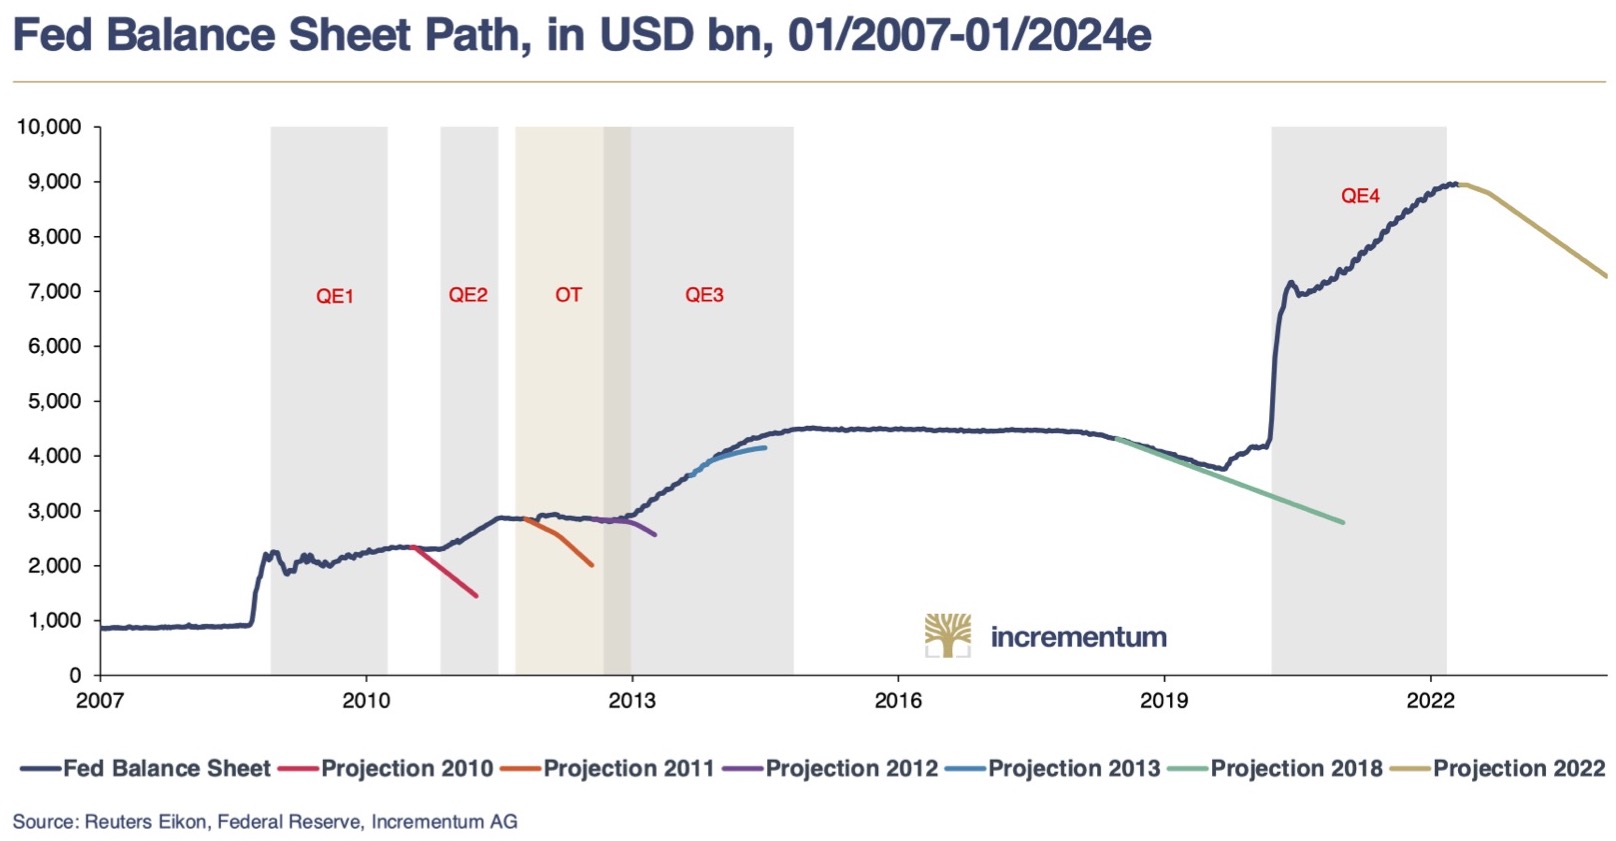 *FED balance sheet path, as of August 19, 2022. ©IGWT Gold Compass, August* As a result, the Fed will not be able to follow its announced course, as it has in the past (see 2010, 2011, 2012, 2013 and 2018). Instead, the Fed will have to cut interest rates next year at the latest to prevent a complete collapse. The amount of liquidity that will then be needed to stabilize the global economy will be absolutely overwhelming, dwarfing anything that has been seen until today. In the short term, however, the Fed will initially pursue its destructive course unflinchingly, thus further exacerbating the stagflationary environment. As a result, all market sectors will remain under considerable pressure in the coming weeks and months. We recommend absolute restraint and a consistent risk-off mentality, as well as a large portion of patience. However, as soon as the Fed will be forced to turn around due to the collapsing markets, gold will quickly bounce back and then also break out to new all-time highs. ### Conclusion: Gold – Close to the edge After a three-week summer rally of more than 125 USD, gold prices quickly fell back by more than 100 USD. Due to the restrictive U.S. Federal Reserve policy and the collapsing financial markets, the way towards south seems to be the most likely road ahead. Technically speaking, the picture is quickly deteriorating, too. Only if gold can defend the last support zone between 1,680 and 1,700 USD on a daily closing price basis, the second part of the summer rally could still start. But currently trading close to 1,705 USD, gold is practically right on the brink of the abyss as last year’s support at 1,680 USD is unlikely to hold for a fifth time! Hence, a further wave down is likely to be unleashed. The scope of a breakdown could quickly assume enormous dimensions due to a then collapsing market technique and the many stops waiting below 1,680 USD. Overall, gold doesn’t look good here. The chance for another bounce is still there and would be typical for the season. At the same time, however, trading so close to the edge, the danger of falling into the abyss increases with each day. Therefore, the highest caution and restraint are recommended. In this difficult market environment, risk-off is your only choice! Cash is king right now! But don’t sell your physical gold. In fact, if gold were to correct even more sharply lower, it would be a great buying opportunity. Eventually, the Fed will have to turn around and print incredible amounts of new fiat money. But we’re not there yet. Alternatively (probability decreasing by the hour), gold can continue its summer rally. But to do so, it must stage a turnaround rather immediately. _______ _Analysis sponsored and initially published on August 28th, 2022, by [www.celticgold.eu](https://celticgold.de/blog/gold-und-bitcoin-analysen-von-florian-grummes-32/gold-knapp-vor-dem-abgrund-188). Translated into English and partially updated on September 1st, 2022._ _Feel free to join us in our free [Telegram channel](https://t.me/MidasTouchConsulting) for daily real time data and a great community._ _If you like to get regular updates on our gold model, precious metals, commodities, and cryptocurrencies you can subscribe to our [free newsletter](http://bit.ly/1EUdt2K)._ _Disclosure: This article and the content are for informational purposes only and do not contain investment advice or recommendations. Every investment and trading move involves risk, and readers should conduct their own research when making a decision. The views, thoughts and opinions expressed here are the author’s alone. They do not necessarily reflect or represent the views and opinions of Midas Touch Consulting._ |
| json metadata | {"tags":["leofinance","gold","silver","investing","trading","stagflation","inflation","recession"],"image":["https://cdn.steemitimages.com/DQmTuxCfYepzkx31kFWAo7aRRsbSBP7cZCcrjdyL4jq2zxW/blog-header-gold-celticgold.jpg","https://cdn.steemitimages.com/DQmdh4FYqaZsZAV7U2dnXrXKEeZYaekXbFaJGNDu6VXiMKt/Chart%2001%20Gold%20in%20USD%204-hour%20chart%20010922.png","https://cdn.steemitimages.com/DQmW1BUEGUyZC7V6ZYDPiF37UPtMfkZJvQYxEA9qPZJgHTQ/Chart%2002%20Gold%20in%20USD%20weeklychart%20010922.png","https://cdn.steemitimages.com/DQmdwJojaerwrESdaoYRvX1kiNu8m67Z2qb8pSE66nE4XyS/Chart%2003%20Gold%20in%20USD%20daily%20chart%20010922.png","https://cdn.steemitimages.com/DQmWM4eCDmBa9De81TVbbwvZjZbynGHmUN4eqUmPoi5sJeb/Chart%2004%20Gold%20Hedgers%20Position%20270822.jpeg","https://cdn.steemitimages.com/DQmZ8q7XkLsMDp8BRmrnSRq49GbMTeC48Nx54D4DJeWWjrJ/Chart%2005%20Gold%20Optix%20Sentiment%20270822.jpeg","https://cdn.steemitimages.com/DQmaTNEfuFxMueTrt75haHydthpS464EJ5kAq2ozMV89y2a/Chart%2006%20Gold%20Seasonality%20260822.png","https://cdn.steemitimages.com/DQmfGfj5yF2q6bnDNr2Eb1ZGaGNvFzkiziQ4oircoaJwFyv/Chart%2007%20FED%20Balance%20Sheet%20260822.png","https://cdn.steemitimages.com/DQmdBty2fGreq1v4pzo4XBHdTKn35dtkE64JXfuuPHpvnvJ/Chart%2008%20US%20Consumer%20Sentiment%20110822.png","https://cdn.steemitimages.com/DQmbRXJam3e8o9XN5LMati6ZKsyTZRvpsfwS4Xy2Uanopir/Chart%2009%20Chinese%20Property%20Market%20220822.jpeg","https://cdn.steemitimages.com/DQmYbjBQD9RwY5VvqntqGfMcUqgA7VteSzuz8JgRYQAeP7L/Chart%2010%20Fed%20Balance%20Sheet%20Path,%20in%20USD%20bn,%2001:2007-01:2024e%20190822.jpg"],"links":["https://www.midastouch-consulting.com/01092022-gold-close-to-the-edge","https://celticgold.de/blog/gold-und-bitcoin-analysen-von-florian-grummes-32/gold-knapp-vor-dem-abgrund-188","https://t.me/MidasTouchConsulting","http://bit.ly/1EUdt2K"],"app":"steemit/0.2","format":"markdown"} |
| parent author | |
| parent permlink | leofinance |
| permlink | september-1st-2022-gold-close-to-the-edge |
| title | September 1st, 2022: Gold – Close to the edge |
| Transaction Info | Block #67395631/Trx 21893b9e7246db175c24d485f9ef71ff2f86e15d |
View Raw JSON Data
{
"block": 67395631,
"op": [
"comment",
{
"author": "midastouch",
"body": " \n\n# [September 1st, 2022: Gold – Close to the edge](https://www.midastouch-consulting.com/01092022-gold-close-to-the-edge) \n\nIn our last in-depth gold analysis we had been optimistically forecasting a recovery and summer rally for the gold price. And indeed, from its low at 1,680 USD gold rallied to 1,808 USD within less than three weeks. However, since mid of August gold came down hard again and is now training just slightly above 1,700 USD. Gold – Close to the edge.\n\n### Review\n\nAlthough gold prices have held up much better against the US-Dollar (-6.74%) and especially against the Euro (+5.83%) than almost all other asset classes so far this year, investors’ nerves have also been strained here. While official inflation rates shot up to record highs, the gold market has instead seen first euphoria, then sheer panic and finally a disappointing summer rally over the past eight months.\n\nThe first three months, however, brought an attack on the all-time high with a top at 2,070 USD. From mid-March, though, gold bears gradually took control again and pushed prices down mercilessly in the wake of the crashing financial markets. Only at a low of 1,680 USD on July 21st (= a discount of almost 400 USD from the high on March 8th) the gold bear temporarily disappeared after a four and a half months assault.\n\n\n*Gold in US-Dollars, 4-hour chart from September 1st, 2022. Source: Tradingview*\n\nSince then, a brisk recovery initially made its way back to 1,808 USD. However, this summer rally is seriously called into question with a deep pullback towards 1,702 USD as of today.\n\nIn the wake of Fed President Jerome Powell’s speech last Friday in Jackson Hole, all markets came under such significant pressure. Hence, the end of the bear-market rally in financial markets is likely in place.\n\nGold prices also had to let go again and trading at a five-week low. Thus, the threat of dropping below the extremely important support at 1,680 USD is growing by the hour.\n\n### Technical Analysis: Gold in US-Dollar\n#### Weekly Chart – Back below the upper edge of the 2-year up-trend channel\n\n*Gold in US-Dollars, weekly chart as of September 1st, 2022. Source: Tradingview*\n\nOn the weekly chart, gold managed to catch a bid just below the upper edge of the light green uptrend channel five and a half weeks ago. This fourth low around 1,680 USD, in conjunction with a strongly oversold condition, provided a quick bounce in the order of +7.55%. However, at a high of 1,808 USD the summer rally did not run very far and did not even reach the 38.2% retracement (1,820 USD) of the entire correction wave down since March 7th. The promising buy signal from the stochastic oscillator was quickly lost again due to the weak price performance since August 10th.\n\nThus, the situation on the weekly chart has deteriorated significantly. If gold bulls could stabilize price action around the upper edge of the light green up-trend channel once again, a second recovery wave towards the middle Bollinger Band (1,819 USD) and higher is still a possibility. But as prices are already flirting with the round psychological number of 1,700 USD, a fifth test of 1,680 USD seems to be rather imminent and would further soften this support.\n\nHence, a breakdown below this extremely important support is very likely after all. In this case, gold could quickly plunge lower and prices around 1,625 USD would be the minimum target. However, since a break below 1,680 USD would also mean a clear dive back into the old uptrend channel, a test of the bottom of the channel (currently around 1,350 USD) would be the “worst case” scenario.\n\nOverall, the weekly chart is neutral, but a directional decision should crystallize over the coming weeks. As long as gold can defend the zone between 1,700 and 1,720 USD, there is a chance of a continuation of the summer rally. However, below 1,700 USD at the latest, the path is clearly pointing to the downside and gold is likely to sail further south in the fall together with the presumably collapsing financial markets.\n\n#### Daily Chart – 130 USD below the 200-day moving average\n\n*Gold in US-Dollars, daily chart as of September 1st, 2022. Source: Tradingview*\n\nOn its daily chart, gold is currently trading 130 USD below its slightly falling 200-day line (USD 1,835). This classic moving average would have been predestined as the minimum target of the summer rally. So far, gold has not made it back to that line in the sand. Instead, bulls already ran out of steam at 1,808 USD and the deep pullback towards 1,713 USD rather confirms the bearish setup.\n\nAt least, the daily stochastic oscillator is extremely oversold. But markets can remain oversold for much longer than most investors can imagine! At the moment, the lower Bollinger Band (USD 1,705) is bending to the downside and hence not offering good support.\n\nAll in all, the daily chart is bearish and gold looks very weak. Given the oversold stochastic and the numerous support between USD 1,680 and USD 1,700, a continuation of the recovery towards USD 1,835 plus X still has a chance for now. Nevertheless, the dangers on the downside must be taken very seriously in view of the unstable overall situation in financial markets.\n\n### Commitments of Traders for Gold – Close to the edge\n\n*Commitments of Traders for Gold as of August 27th, 2022. Source: Sentimentrader*\n\nThe cumulative net short position of commercial market participants has recently reduced slightly again and stood at 138,072 short sold contracts as of Tuesday, August 27th. The commercial net short position is thus again close to the threshold of 100,000 short contracts, at which one can speak of a rather bullish CoT report for the gold market.\n\nIn summary, the CoT report is to be classified as cautiously bullish.\n\n### Sentiment for Gold – Close to the edge\n\n*Sentiment Optix for Gold as of August 27th, 2022. Source: Sentimentrader*\n\nIn July, gold´s sentiment had fallen to its lowest level in four years. The interim recovery led to an initial relief. Now, sentiment analysis is again measuring relatively high levels of pessimism, pointing to a contrarian opportunity in the bigger picture. However, a bottoming process may well take some time, similar to the fall of 2018. Back then, high pessimism levels occurred repeatedly over a period of almost five and a half months. This bombed-out sentiment then laid the foundation for the fulminant rise from 1,160 USD to 2,070 USD within the following two years.\n\nOverall, the sentiment traffic light is green and continues to provide a contrarian buy signal!\n\n### Seasonality for Gold – Close to the edge\n\n*Seasonality for Gold over the last 53-years as of August 27th, 2022. Source: Seasonax*\n\nFrom a seasonal perspective, gold is currently right in the middle of its best phase of the year. According to the statistics of the last 54 years, this favorable timeframe typically extends from the beginning of July to the beginning of October. Accordingly, the seasonal component would still be very supportive for the next four to six weeks.\n\nSeasonality for gold and silver is still strongly bullish until early October.\n\n### Macro update: Recession and stagflation\n\n\n*FED Balance Sheet Total as of August 24th , 2022, ©Holger Zschaepitz*\n\nLast Friday, U.S. Federal Reserve Chairman Jerome Powell announced a tough stance on inflation in his speech at the key central bankers’ meeting in Jackson Hole. He signaled new rate hikes and prepared investors for a weaker economy. In reality, however, shrinking the Fed’s balance sheet does not appear to be that easy. Last week, for example, the Fed’s total assets rose by 1.7 billion USD to 8,851.4 billion USD. In retrospect, total assets have been reduced by just 114 billion USD, or 1.3%, since the start of quantitative tightening.\n\n\n*US-Consumer Sentiment as of August 11th, 2022. ©Y-Charts*\n\nHowever, financial markets have responded to this minor reduction in the balance sheet total in recent months with a sharp correction and a bear market. Already, U.S. consumer confidence has fallen to its lowest level since the early 1980s! Likewise, CEO confidence in the U.S. has fallen to its lowest level in 14 years. Many other key data are on the verge of rolling over. A recession has already been confirmed. The only question now is how bad it will actually get.\n\n\n*Chinese property market as of August 22nd, 2022. ©Market Sentiment*\n\nThe already dramatic situation is intensified by the collapsing Chinese real estate market. The world’s largest and thus most important sector has already been under tremendous pressure for over a year and is increasingly collapsing. The total value amounts to more than 60 trillion USD, i.e. more than the entire US stock market and more than twice the US real estate market. S&P recently predicted a further decline of about 30%, which would be about 1.5 times worse than the 2008 financial crash. We had warned in detail and in good time about those consequences in the fall of 2021.\n\n\n*FED balance sheet path, as of August 19, 2022. ©IGWT Gold Compass, August*\n\nAs a result, the Fed will not be able to follow its announced course, as it has in the past (see 2010, 2011, 2012, 2013 and 2018). Instead, the Fed will have to cut interest rates next year at the latest to prevent a complete collapse. The amount of liquidity that will then be needed to stabilize the global economy will be absolutely overwhelming, dwarfing anything that has been seen until today.\n\nIn the short term, however, the Fed will initially pursue its destructive course unflinchingly, thus further exacerbating the stagflationary environment. As a result, all market sectors will remain under considerable pressure in the coming weeks and months. We recommend absolute restraint and a consistent risk-off mentality, as well as a large portion of patience. However, as soon as the Fed will be forced to turn around due to the collapsing markets, gold will quickly bounce back and then also break out to new all-time highs.\n\n### Conclusion: Gold – Close to the edge\n\nAfter a three-week summer rally of more than 125 USD, gold prices quickly fell back by more than 100 USD. Due to the restrictive U.S. Federal Reserve policy and the collapsing financial markets, the way towards south seems to be the most likely road ahead. Technically speaking, the picture is quickly deteriorating, too. Only if gold can defend the last support zone between 1,680 and 1,700 USD on a daily closing price basis, the second part of the summer rally could still start. But currently trading close to 1,705 USD, gold is practically right on the brink of the abyss as last year’s support at 1,680 USD is unlikely to hold for a fifth time! Hence, a further wave down is likely to be unleashed. The scope of a breakdown could quickly assume enormous dimensions due to a then collapsing market technique and the many stops waiting below 1,680 USD.\n\nOverall, gold doesn’t look good here. The chance for another bounce is still there and would be typical for the season. At the same time, however, trading so close to the edge, the danger of falling into the abyss increases with each day. Therefore, the highest caution and restraint are recommended. In this difficult market environment, risk-off is your only choice! Cash is king right now! But don’t sell your physical gold. In fact, if gold were to correct even more sharply lower, it would be a great buying opportunity. Eventually, the Fed will have to turn around and print incredible amounts of new fiat money. But we’re not there yet. Alternatively (probability decreasing by the hour), gold can continue its summer rally. But to do so, it must stage a turnaround rather immediately.\n_______\n_Analysis sponsored and initially published on August 28th, 2022, by [www.celticgold.eu](https://celticgold.de/blog/gold-und-bitcoin-analysen-von-florian-grummes-32/gold-knapp-vor-dem-abgrund-188). Translated into English and partially updated on September 1st, 2022._ \n\n_Feel free to join us in our free [Telegram channel](https://t.me/MidasTouchConsulting) for daily real time data and a great community._ \n\n_If you like to get regular updates on our gold model, precious metals, commodities, and cryptocurrencies you can subscribe to our [free newsletter](http://bit.ly/1EUdt2K)._ \n\n_Disclosure: This article and the content are for informational purposes only and do not contain investment advice or recommendations. Every investment and trading move involves risk, and readers should conduct their own research when making a decision. The views, thoughts and opinions expressed here are the author’s alone. They do not necessarily reflect or represent the views and opinions of Midas Touch Consulting._",
"json_metadata": "{\"tags\":[\"leofinance\",\"gold\",\"silver\",\"investing\",\"trading\",\"stagflation\",\"inflation\",\"recession\"],\"image\":[\"https://cdn.steemitimages.com/DQmTuxCfYepzkx31kFWAo7aRRsbSBP7cZCcrjdyL4jq2zxW/blog-header-gold-celticgold.jpg\",\"https://cdn.steemitimages.com/DQmdh4FYqaZsZAV7U2dnXrXKEeZYaekXbFaJGNDu6VXiMKt/Chart%2001%20Gold%20in%20USD%204-hour%20chart%20010922.png\",\"https://cdn.steemitimages.com/DQmW1BUEGUyZC7V6ZYDPiF37UPtMfkZJvQYxEA9qPZJgHTQ/Chart%2002%20Gold%20in%20USD%20weeklychart%20010922.png\",\"https://cdn.steemitimages.com/DQmdwJojaerwrESdaoYRvX1kiNu8m67Z2qb8pSE66nE4XyS/Chart%2003%20Gold%20in%20USD%20daily%20chart%20010922.png\",\"https://cdn.steemitimages.com/DQmWM4eCDmBa9De81TVbbwvZjZbynGHmUN4eqUmPoi5sJeb/Chart%2004%20Gold%20Hedgers%20Position%20270822.jpeg\",\"https://cdn.steemitimages.com/DQmZ8q7XkLsMDp8BRmrnSRq49GbMTeC48Nx54D4DJeWWjrJ/Chart%2005%20Gold%20Optix%20Sentiment%20270822.jpeg\",\"https://cdn.steemitimages.com/DQmaTNEfuFxMueTrt75haHydthpS464EJ5kAq2ozMV89y2a/Chart%2006%20Gold%20Seasonality%20260822.png\",\"https://cdn.steemitimages.com/DQmfGfj5yF2q6bnDNr2Eb1ZGaGNvFzkiziQ4oircoaJwFyv/Chart%2007%20FED%20Balance%20Sheet%20260822.png\",\"https://cdn.steemitimages.com/DQmdBty2fGreq1v4pzo4XBHdTKn35dtkE64JXfuuPHpvnvJ/Chart%2008%20US%20Consumer%20Sentiment%20110822.png\",\"https://cdn.steemitimages.com/DQmbRXJam3e8o9XN5LMati6ZKsyTZRvpsfwS4Xy2Uanopir/Chart%2009%20Chinese%20Property%20Market%20220822.jpeg\",\"https://cdn.steemitimages.com/DQmYbjBQD9RwY5VvqntqGfMcUqgA7VteSzuz8JgRYQAeP7L/Chart%2010%20Fed%20Balance%20Sheet%20Path,%20in%20USD%20bn,%2001:2007-01:2024e%20190822.jpg\"],\"links\":[\"https://www.midastouch-consulting.com/01092022-gold-close-to-the-edge\",\"https://celticgold.de/blog/gold-und-bitcoin-analysen-von-florian-grummes-32/gold-knapp-vor-dem-abgrund-188\",\"https://t.me/MidasTouchConsulting\",\"http://bit.ly/1EUdt2K\"],\"app\":\"steemit/0.2\",\"format\":\"markdown\"}",
"parent_author": "",
"parent_permlink": "leofinance",
"permlink": "september-1st-2022-gold-close-to-the-edge",
"title": "September 1st, 2022: Gold – Close to the edge"
}
],
"op_in_trx": 0,
"timestamp": "2022-09-04T12:54:24",
"trx_id": "21893b9e7246db175c24d485f9ef71ff2f86e15d",
"trx_in_block": 13,
"virtual_op": 0
}crypto.defragreplied to @midastouch / 20220816t110732853z2022/08/16 11:07:33
crypto.defragreplied to @midastouch / 20220816t110732853z
2022/08/16 11:07:33
| author | crypto.defrag |
| body | Yay more Crypto! So much more than money. <br> Upvoted👍 Reshared🔁 |
| json metadata | {"app":"repv0.1x"} |
| parent author | midastouch |
| parent permlink | august-15th-2022-bitcoin-recovery-reaches-first-price-target |
| permlink | 20220816t110732853z |
| title | |
| Transaction Info | Block #66851498/Trx df5a7ca52d9c6ba59af62e37d5928b98178a0b6f |
View Raw JSON Data
{
  "block": 66851498,
  "op": [
    "comment",
    {
      "author": "crypto.defrag",
      "body": "Yay more Crypto! So much more than money. <br> Upvoted👍 Reshared🔁 ",
      "json_metadata": "{\"app\":\"repv0.1x\"}",
      "parent_author": "midastouch",
      "parent_permlink": "august-15th-2022-bitcoin-recovery-reaches-first-price-target",
      "permlink": "20220816t110732853z",
      "title": ""
    }
  ],
  "op_in_trx": 0,
  "timestamp": "2022-08-16T11:07:33",
  "trx_id": "df5a7ca52d9c6ba59af62e37d5928b98178a0b6f",
  "trx_in_block": 7,
  "virtual_op": 0
}2022/08/16 10:57:54
2022/08/16 10:57:54
| author | midastouch |
| permlink | august-15th-2022-bitcoin-recovery-reaches-first-price-target |
| voter | crypto.defrag |
| weight | 111 (1.11%) |
| Transaction Info | Block #66851306/Trx cf4e3b8f439533c3f2833c45c3c57001fc6b78dc |
View Raw JSON Data
{
  "block": 66851306,
  "op": [
    "vote",
    {
      "author": "midastouch",
      "permlink": "august-15th-2022-bitcoin-recovery-reaches-first-price-target",
      "voter": "crypto.defrag",
      "weight": 111
    }
  ],
  "op_in_trx": 0,
  "timestamp": "2022-08-16T10:57:54",
  "trx_id": "cf4e3b8f439533c3f2833c45c3c57001fc6b78dc",
  "trx_in_block": 4,
  "virtual_op": 0
}midastouchupvoted (100.00%) @midastouch / july-28th-2022-gold-summer-rally-has-started2022/08/16 10:55:09
midastouchupvoted (100.00%) @midastouch / july-28th-2022-gold-summer-rally-has-started
2022/08/16 10:55:09
| author | midastouch |
| permlink | july-28th-2022-gold-summer-rally-has-started |
| voter | midastouch |
| weight | 10000 (100.00%) |
| Transaction Info | Block #66851251/Trx e4aa1fbb62cc6ac423cd14228980db18b660d9a2 |
View Raw JSON Data
{
  "block": 66851251,
  "op": [
    "vote",
    {
      "author": "midastouch",
      "permlink": "july-28th-2022-gold-summer-rally-has-started",
      "voter": "midastouch",
      "weight": 10000
    }
  ],
  "op_in_trx": 0,
  "timestamp": "2022-08-16T10:55:09",
  "trx_id": "e4aa1fbb62cc6ac423cd14228980db18b660d9a2",
  "trx_in_block": 14,
  "virtual_op": 0
}midastouchupvoted (100.00%) @midastouch / august-15th-2022-bitcoin-recovery-reaches-first-price-target2022/08/16 10:54:51
midastouchupvoted (100.00%) @midastouch / august-15th-2022-bitcoin-recovery-reaches-first-price-target
2022/08/16 10:54:51
| author | midastouch |
| permlink | august-15th-2022-bitcoin-recovery-reaches-first-price-target |
| voter | midastouch |
| weight | 10000 (100.00%) |
| Transaction Info | Block #66851245/Trx a0c4e649543faf74cbff20bbac279a6a17fe9efe |
View Raw JSON Data
{
  "block": 66851245,
  "op": [
    "vote",
    {
      "author": "midastouch",
      "permlink": "august-15th-2022-bitcoin-recovery-reaches-first-price-target",
      "voter": "midastouch",
      "weight": 10000
    }
  ],
  "op_in_trx": 0,
  "timestamp": "2022-08-16T10:54:51",
  "trx_id": "a0c4e649543faf74cbff20bbac279a6a17fe9efe",
  "trx_in_block": 2,
  "virtual_op": 0
}midastouchpublished a new post: august-15th-2022-bitcoin-recovery-reaches-first-price-target2022/08/16 10:54:30
midastouchpublished a new post: august-15th-2022-bitcoin-recovery-reaches-first-price-target
2022/08/16 10:54:30
| author | midastouch |
| body |  # [August 15th, 2022, Bitcoin – Recovery reaches first price target](https://www.midastouch-consulting.com/15082022-bitcoin-recovery-reaches-first-price-target) Over the last few weeks, bitcoin was able to stage a recovery. Just two days ago, bitcoin prices reclaimed the 25,000 USD level for the first time since June 13th. Bitcoin – Recovery reaches first price target. ### Review Since our analysis on July 13th (Relief rally in summer?), bitcoin has recovered significantly, as expected. At the peak, bitcoin prices gained almost 33% in the last four weeks and reached the highest level since the crash in mid-June with prices around 25,212 USD. Ethereum performed even stronger, rallying nearly 102% over the same timeframe. Over the last two weeks, however, bitcoin has been rather calmly running sideways between 22,500 USD and 24,500 USD. At the same time, stock markets as well as most commodity prices were able to recover a good bit in recent weeks, too. Hence, financial markets in general are experiencing the expected summer rally. Since sentiment had reached an extreme panic mood in mid of June due to the month-long and severe correction in the financial markets, the perception among participants has now improved significantly in the course of the recent recovery. In itself, this is a classic pattern within an established bear market. Yet, whether and how the bears will return, will likely not get clearer until mid of September. ### Technical Analysis For Bitcoin in US-Dollar #### Bitcoin Weekly Chart – Stochastic oscillator with a buy signal. 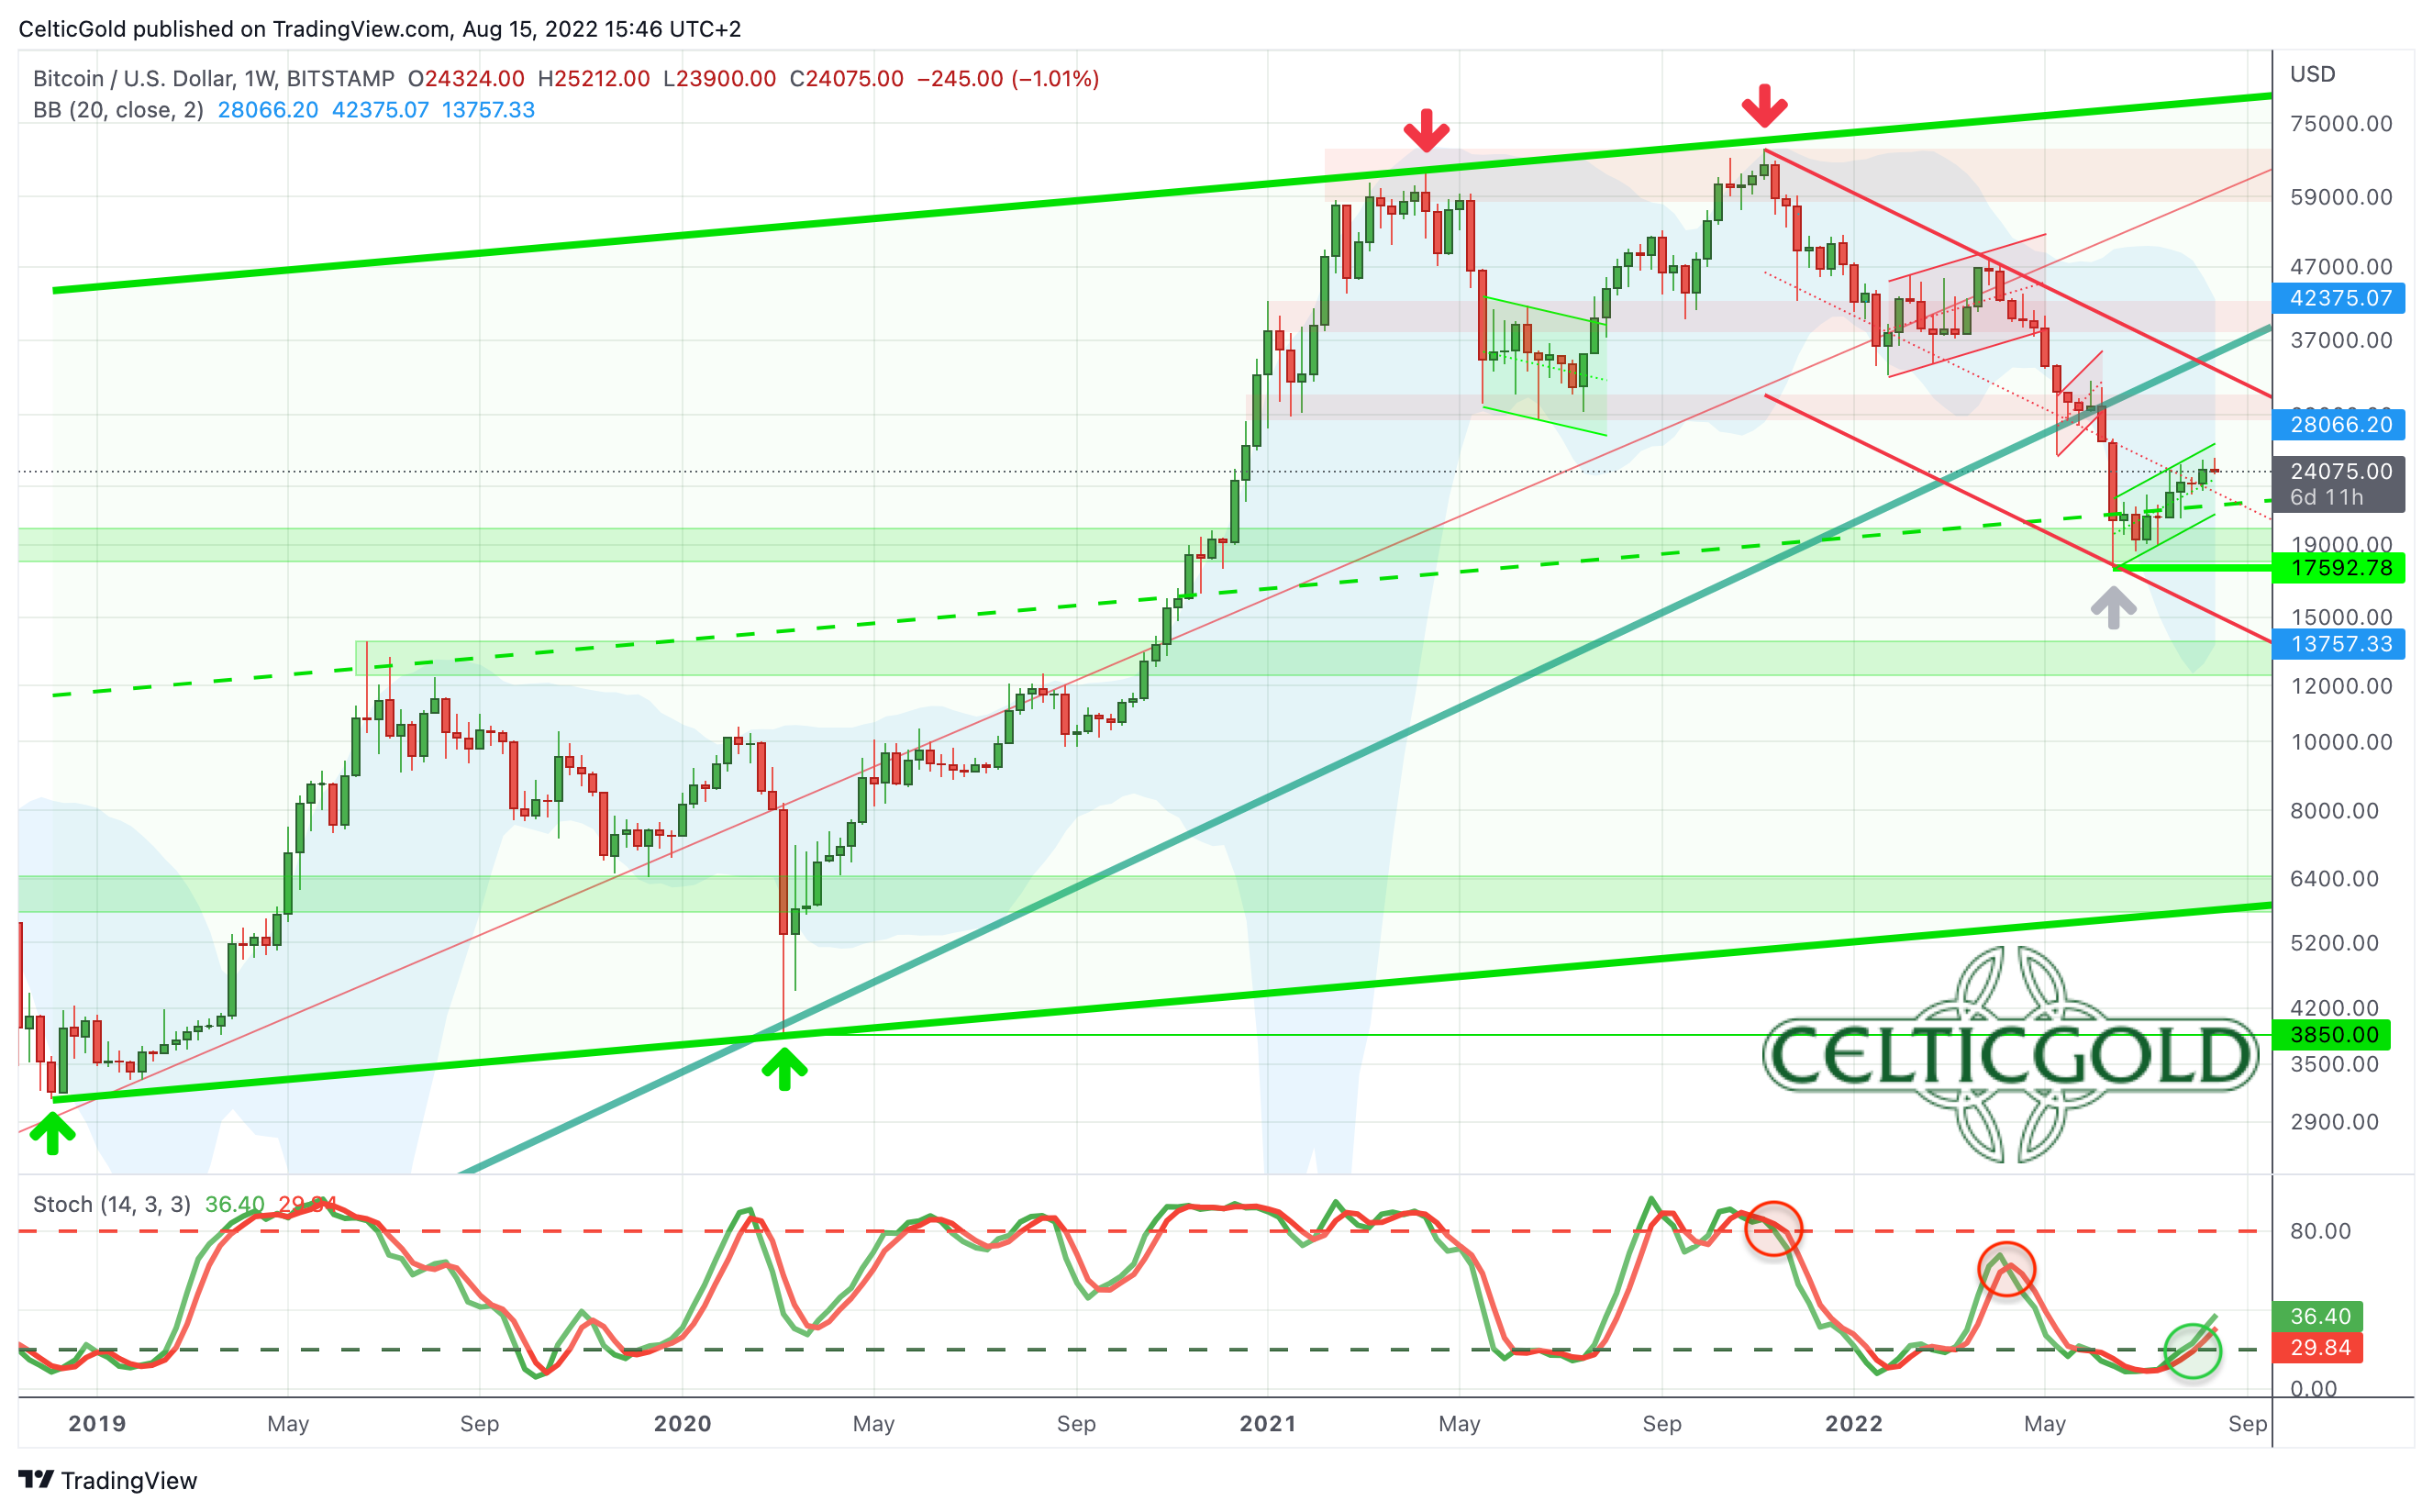 *Bitcoin in USD, weekly chart as of August 15th, 2022. Source: Tradingview* Within the established downtrend channel, since the all-time high at 69,000 USD in November 2021, bitcoin was able to recover a good bit recently. Starting from the low around 17,600 USD, bitcoin is currently trading nearly 37% higher. This recovery has led to a buy signal from the weekly stochastic oscillator. As well, the recovery wave has also crossed the mid-trend line within the downtrend channel. Therefore, chances for a continuation of the recovery towards 29,000 USD to 30,000 USD are pretty good. Overall, the weekly chart is providing a first bullish signal. It is still too early to speak of a sustainable trend reversal and the end of the crypto winter. However, a continuation of the recovery seems quite possible in any case and is the preferred scenario. #### Bitcoin Daily Chart – 200-day moving average remains the recovery target 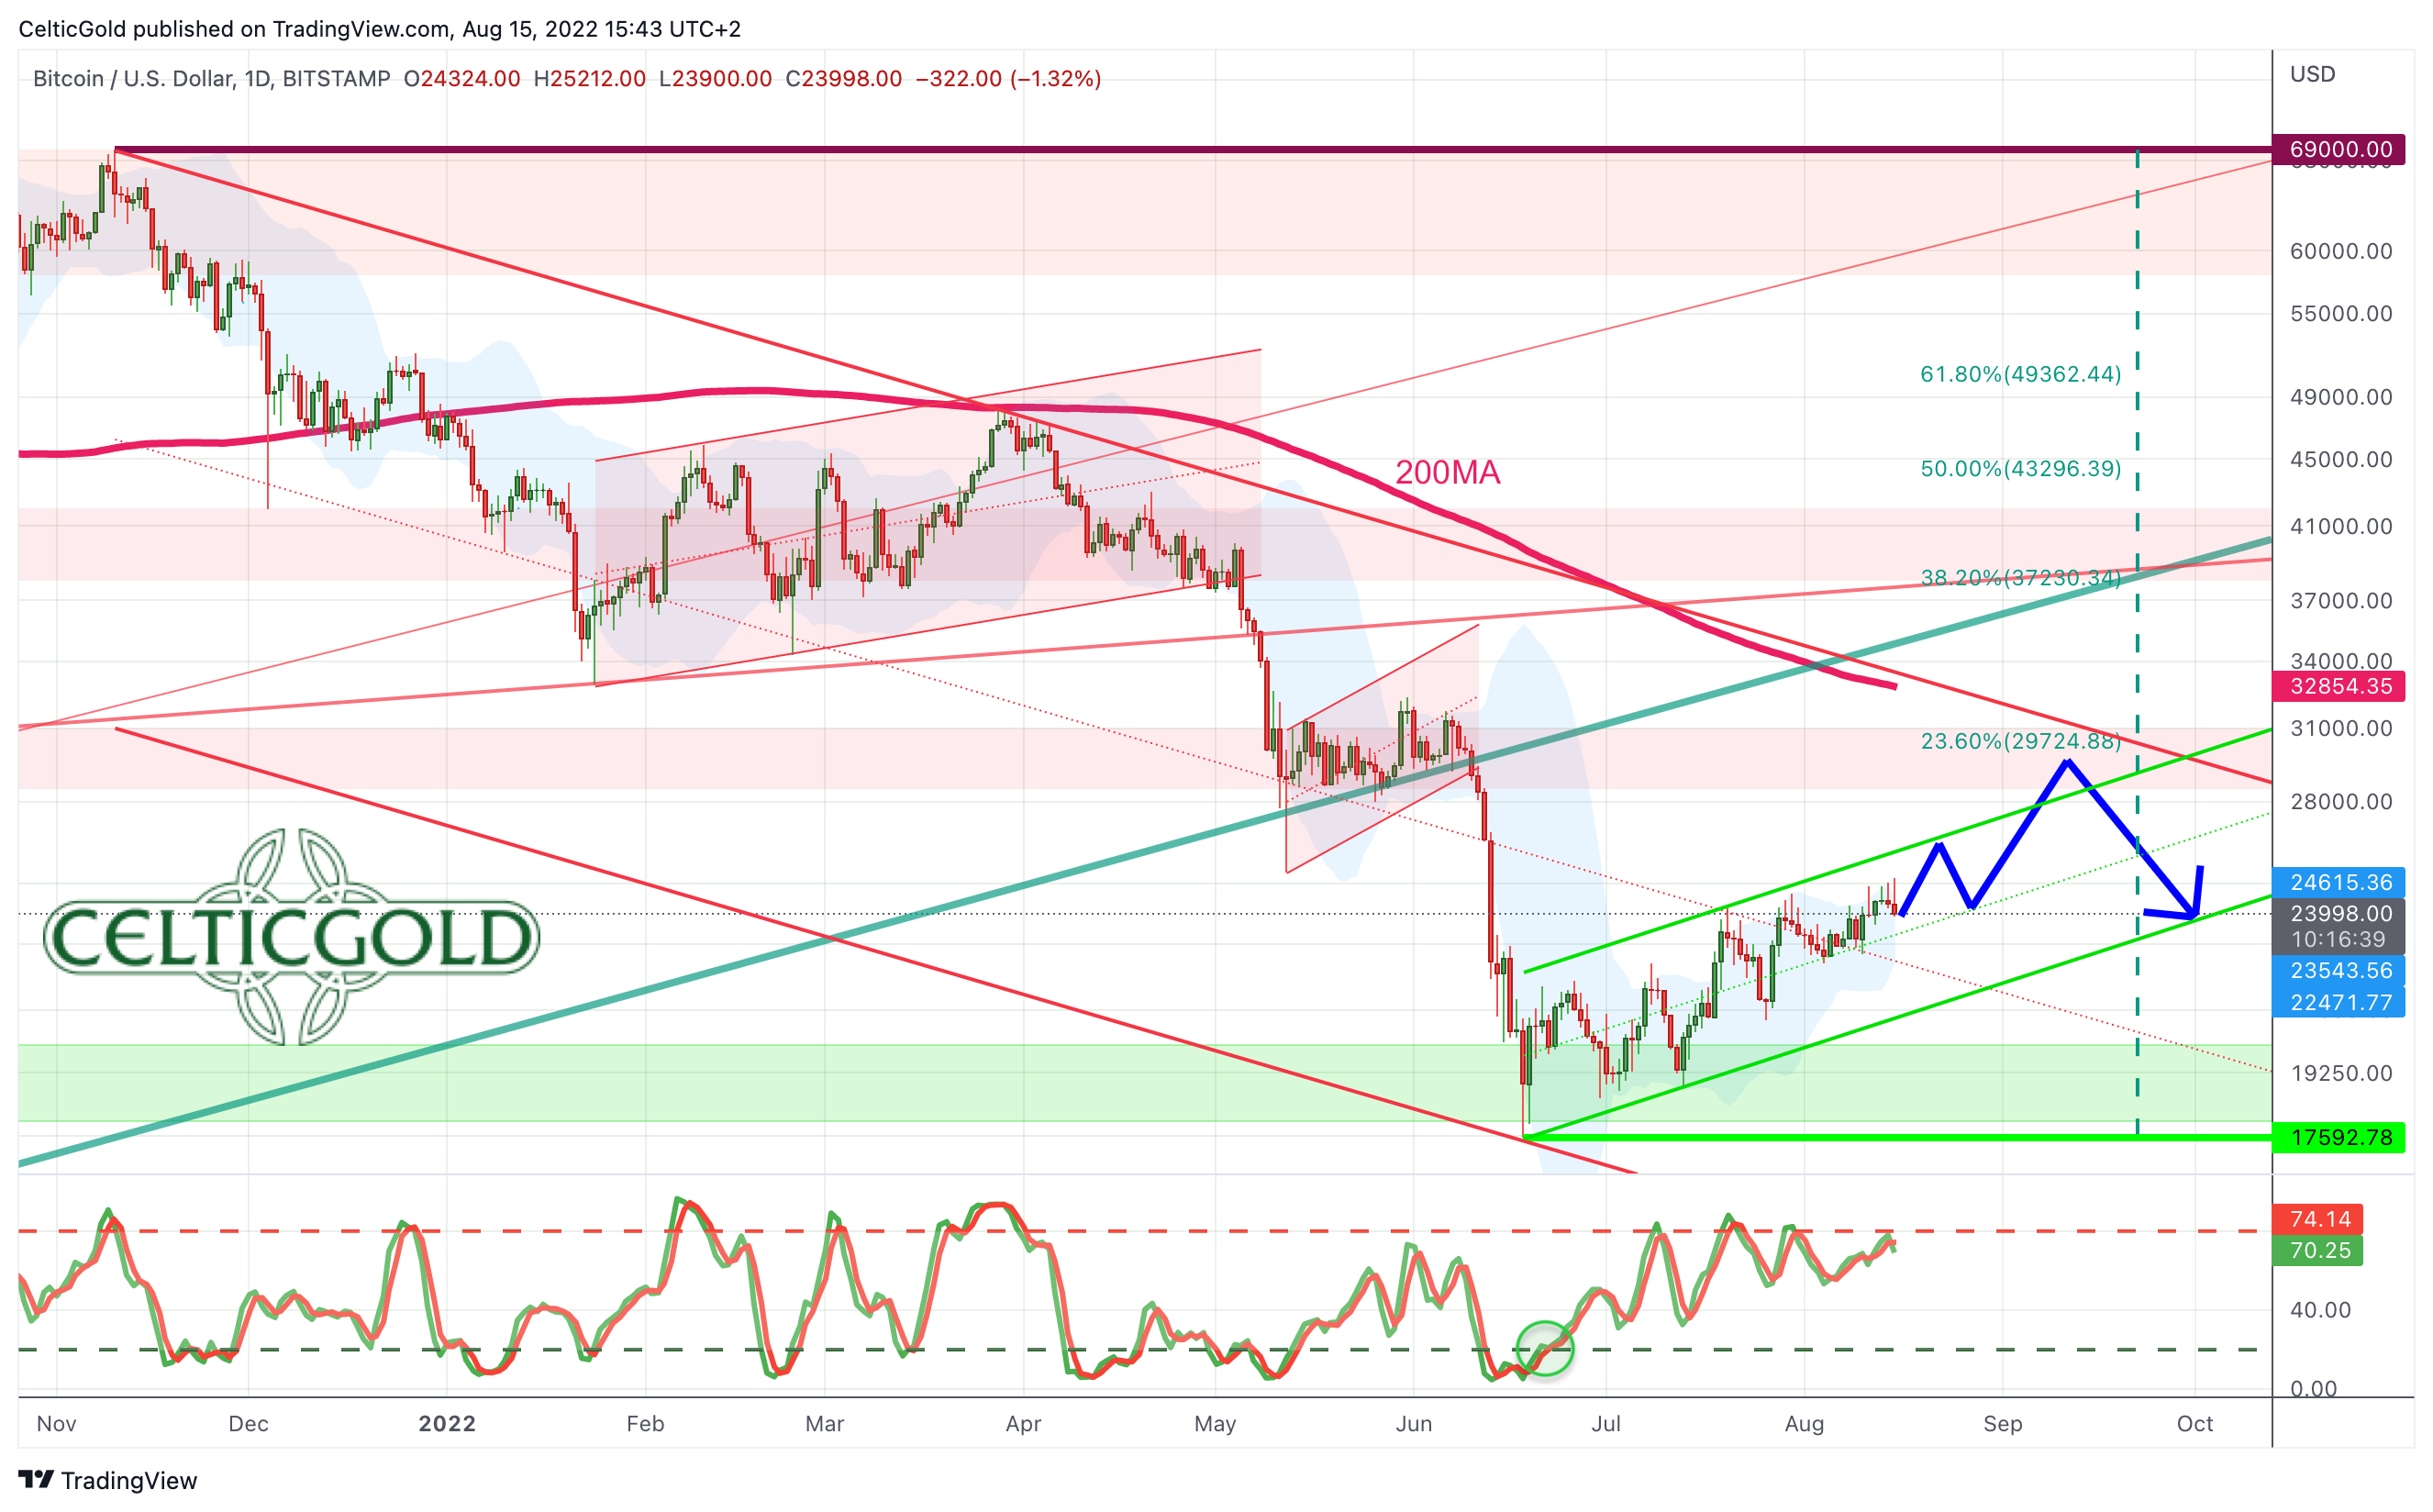 *Bitcoin in USD, daily chart as of August 15th, 2022. Source: Tradingview* On the daily chart, bitcoin prices have reached our first price target around 25,000 USD. Currently, bitcoin is trading slightly below its upper Bollinger Band (24,622 USD). Though this resistance has been attacked various times in recent weeks, it has not (yet) released more room to the upside on a daily basis. While the stochastic oscillator is trying to hide its active buy signal, the distance to the falling 200-day line (32,855 USD) is still significant. A reunion with this moving average should therefore definitely succeed in the coming weeks or months. Nevertheless, the flat uptrend can still turn out to be a bearish flag formation, similar to the beginning of May. But even then, the higher probability points towards the upside, at least in the short term. Thus, a sustained rise above 25,000 USD could force a short squeeze and entail a rapid rise towards 29,000 to 30,000 USD. In summary, the daily chart is bullish. The recovery still has room to the upside. The next recovery target is the 30,000 USD mark and the fast falling 200-day moving average line. Only below 22,000 USD, the picture would degrade significantly. ### Sentiment Bitcoin – Recovery reaches first price target 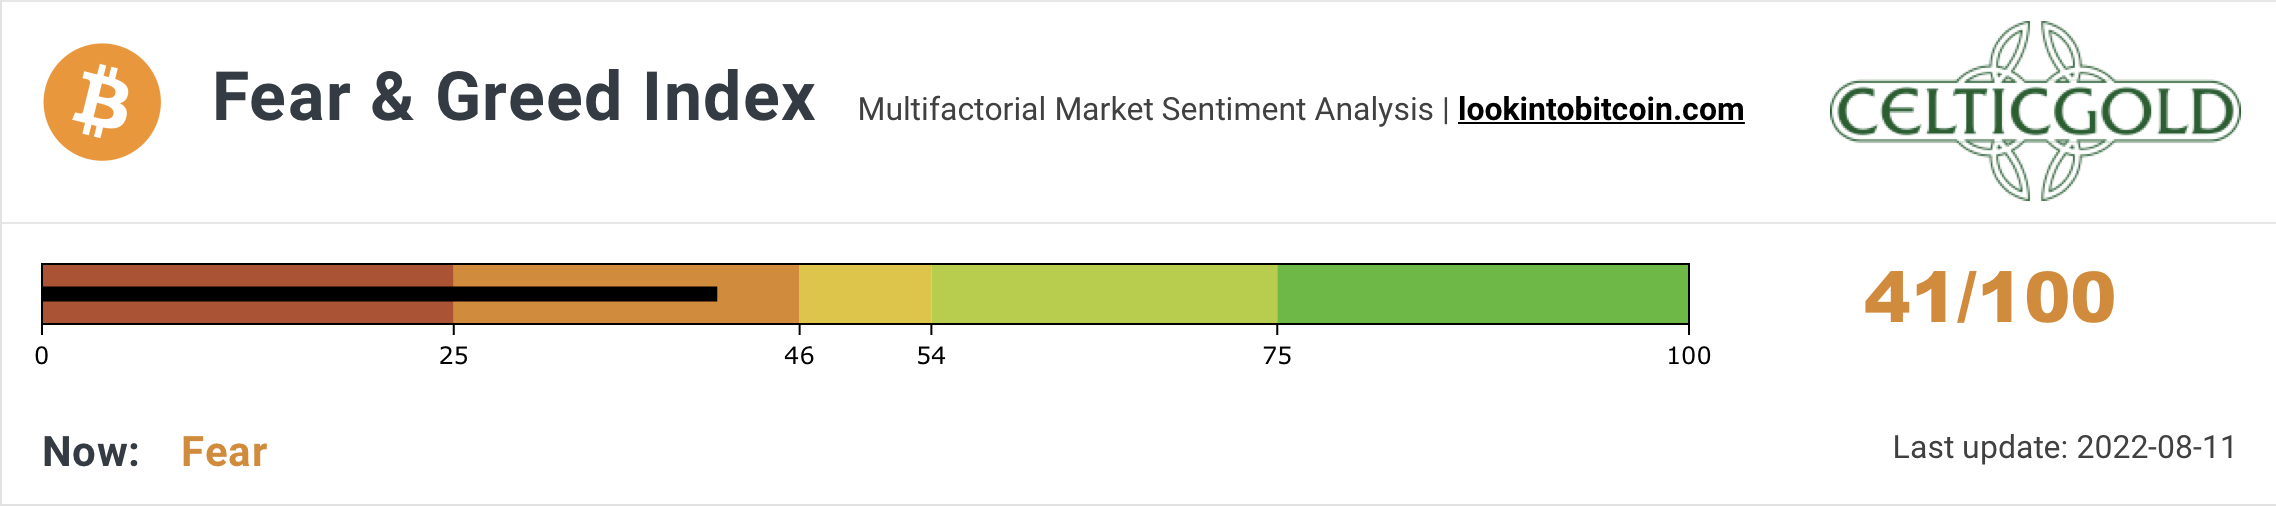 *Crypto Fear & Greed Index, as of August 11th, 2022. Source: Lookintobitcoin* The Crypto Fear & Greed Index has recovered significantly over the past four weeks. However, it still measures a rather fearful sentiment. After the brutal sell-off, which spanned over seven months, fear continues to run deep in the crypto sector. 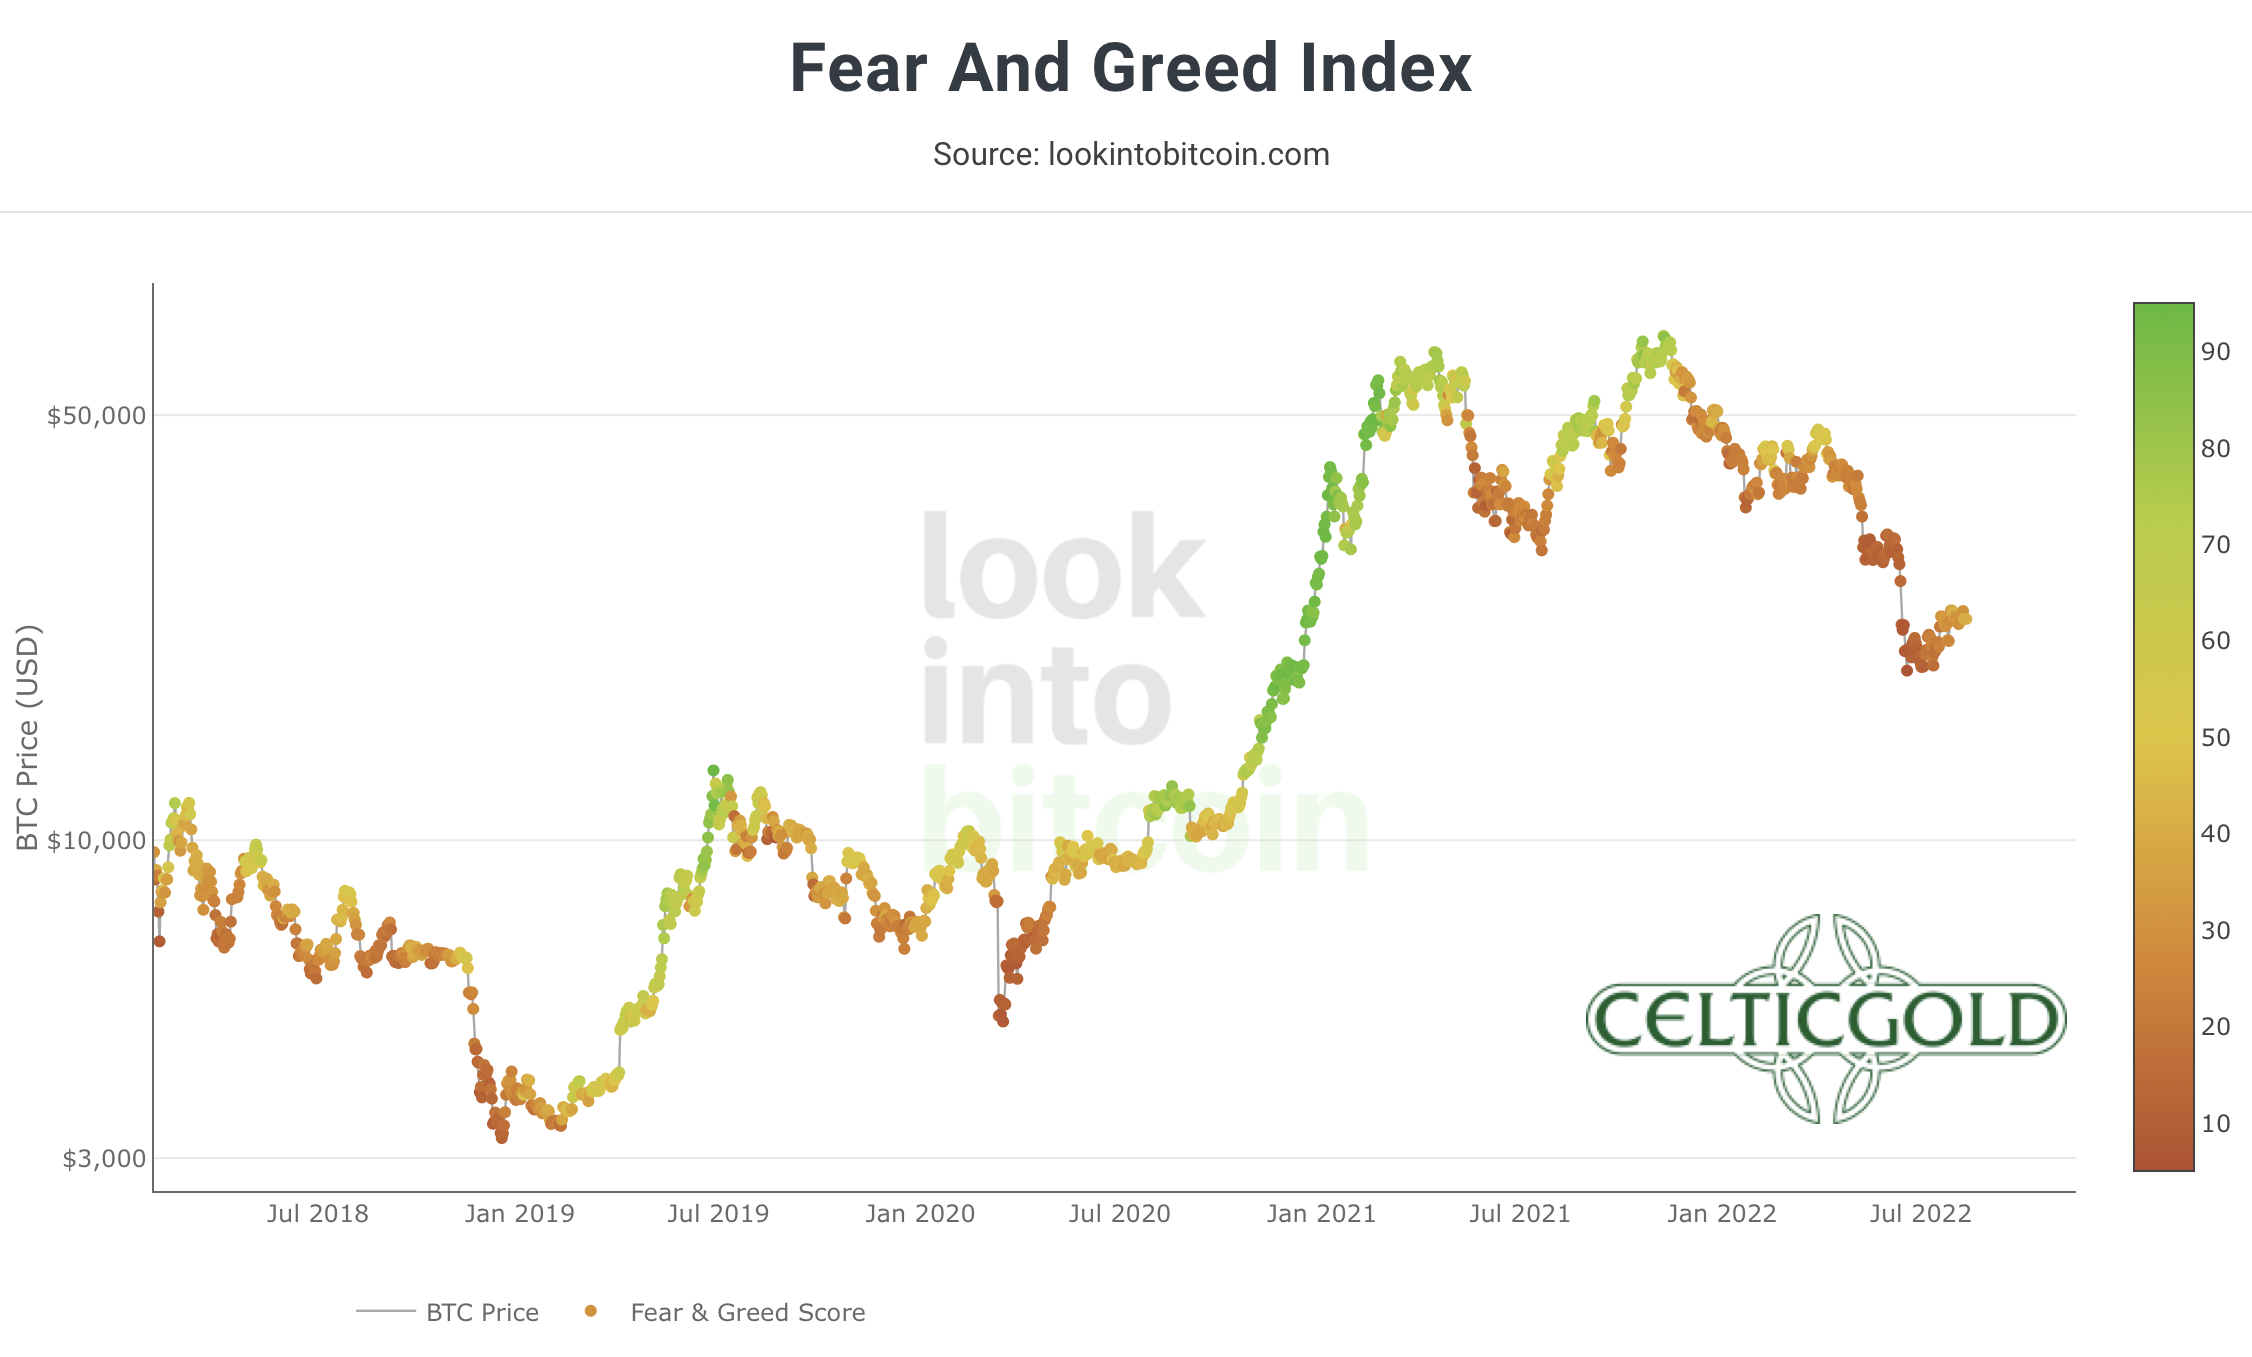 *Crypto Fear & Greed Index long term, as of August 11th, 2022. Source: Lookintobitcoin* In the bigger picture, the beaten down sentiment remains in place, as well. This setup holds some really good contrarian opportunities. Overall, the fearful sentiment continues to provide a contrarian buy signal. ### Seasonality Bitcoin – Recovery reaches first price target 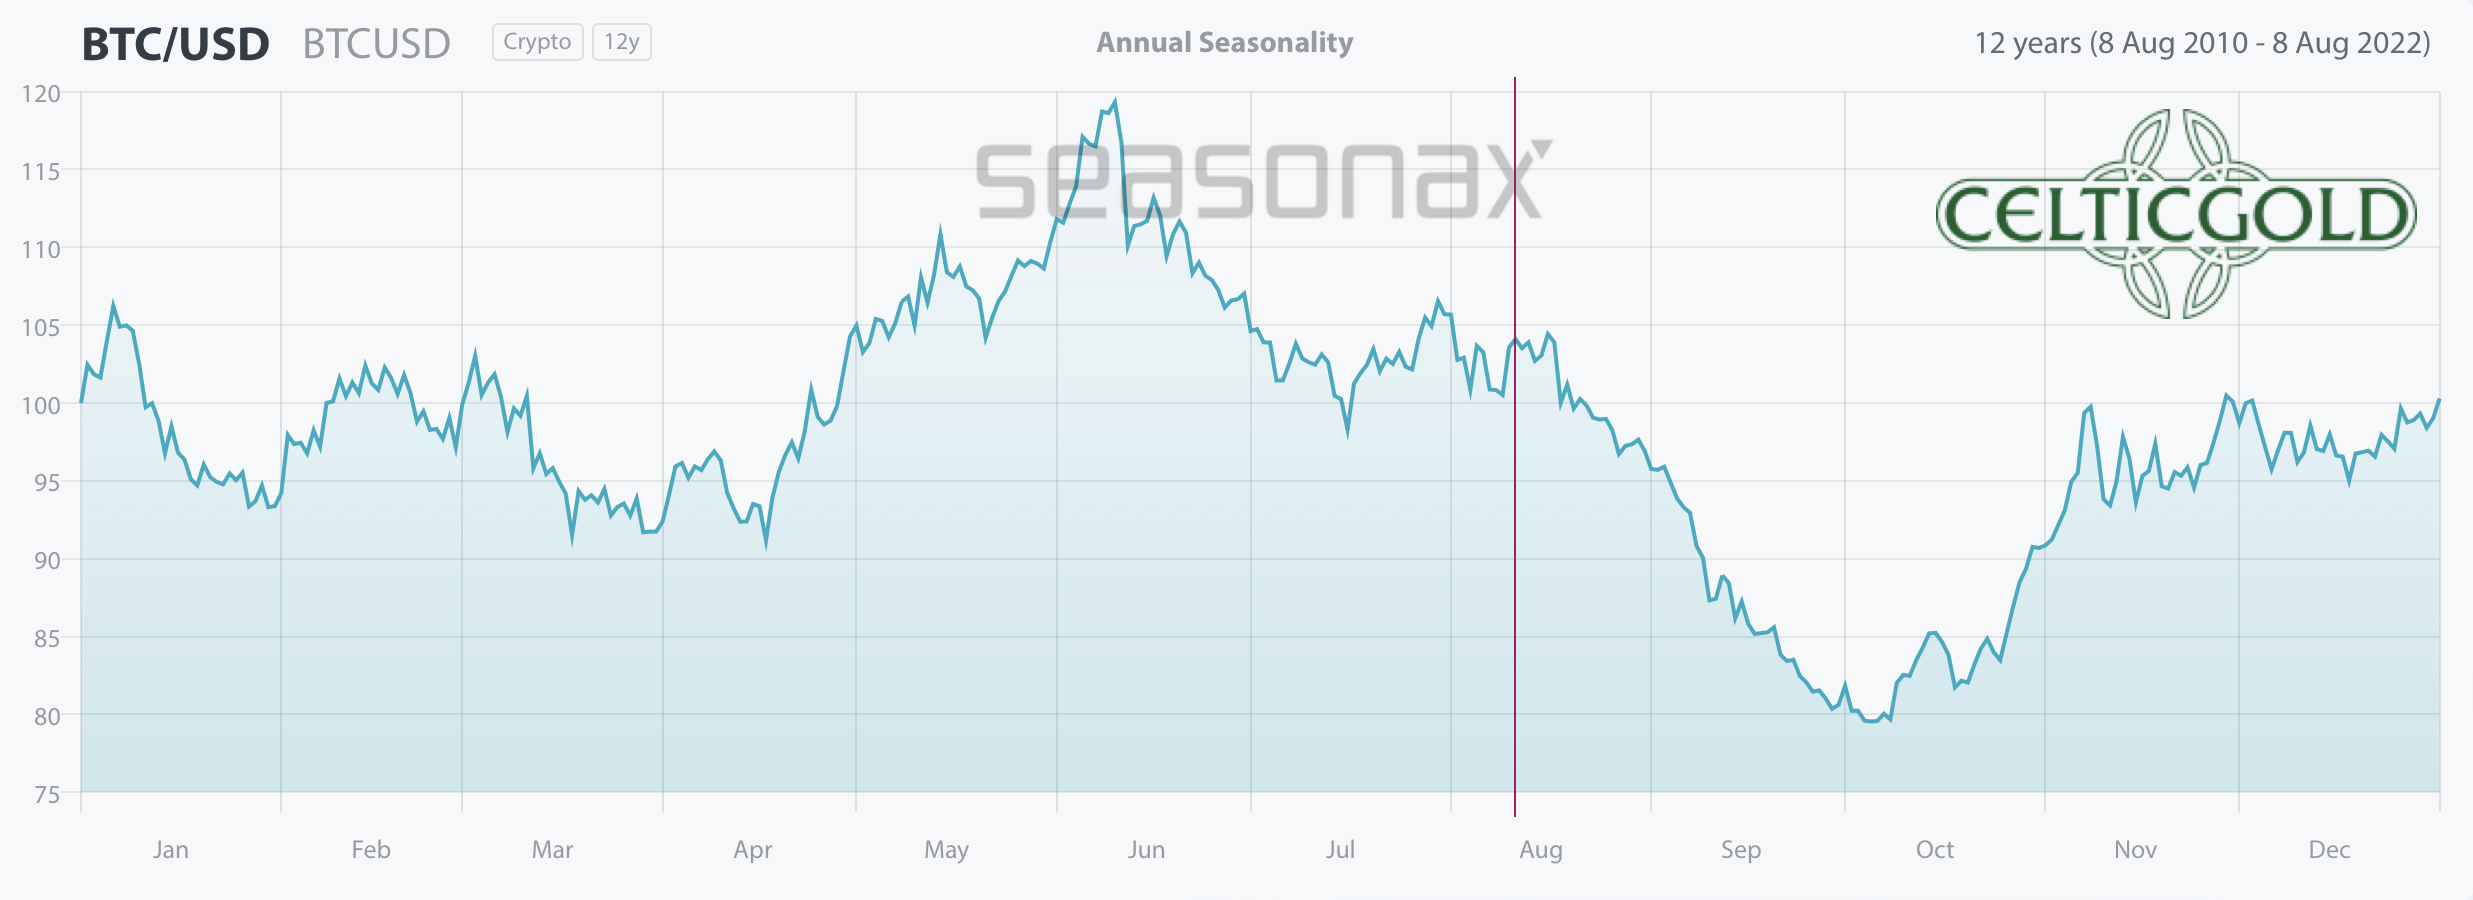 *Seasonality for bitcoin, as of August 11th, 2022. Source: Seasonax* The seasonal component remains rather unfavorable until the end of September or the beginning of October. In particular, September is traditionally a weak month in the stock markets. Since bitcoin and the stock markets have been strongly correlated for months, the weak seasonal trend might therefore get reinforced in September. However, according to the seasonal pattern, October could see the start of a new uptrend in the crypto sector. Given the “midterm elections” on November 8th in the U.S., sharp drops in the financial markets would be very counterproductive to keep the current administration in place. Therefore, only a mild pullback in financial markets during September would be more conceivable. From those lows the markets could then recover further until the U.S. election. Overall, the seasonal component still calls for patience. Statistically speaking, the situation does not brighten up significantly until mid-October. In the very short term, however, the continuation of the summer rally is still possible. ### Sound Money: Bitcoin vs. Gold 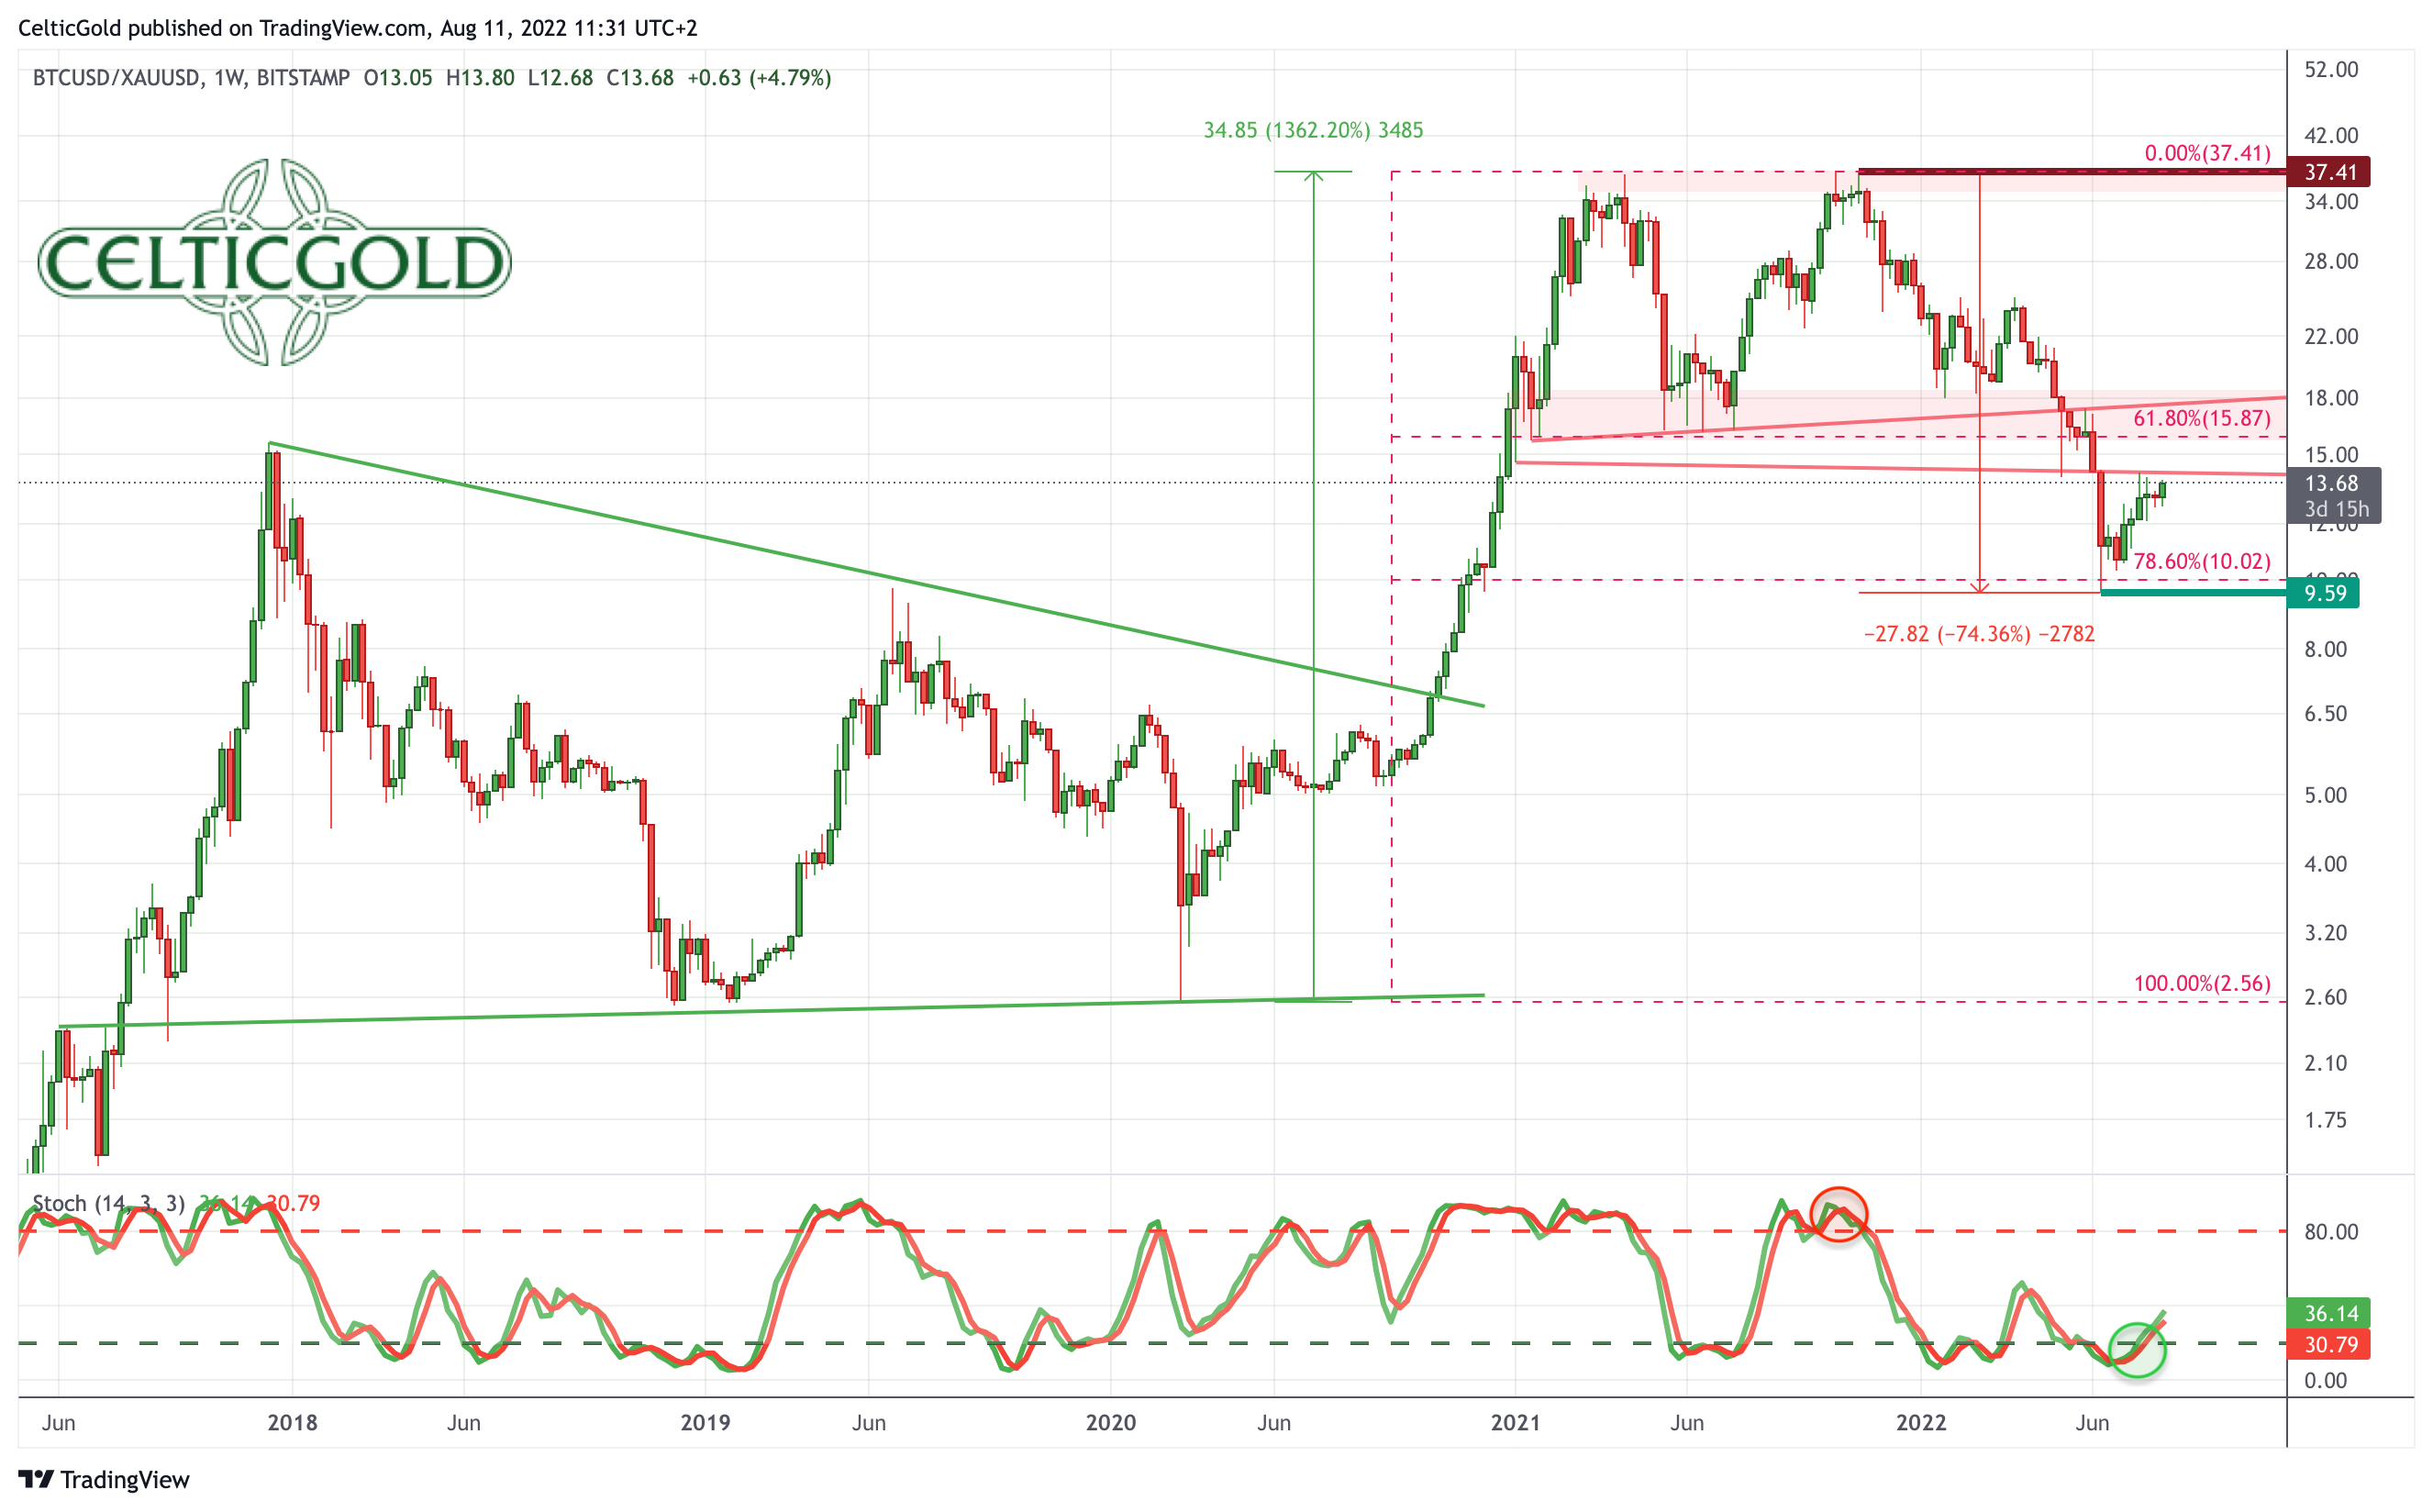 *Bitcoin/Gold-Ratio as of August 15th, 2022.Source: Tradingview* The bitcoin/gold-ratio recovered from its low of 9.59 to its current level of 13.5. At prices of currently around 24,000 USD for one bitcoin and around 1,775 for one troy ounce of gold, you have to pay 13.5 ounces of gold for one bitcoin. Put another way, a troy ounce of gold currently costs about 0.074 bitcoin. Overall, a recovery in favor of bitcoin against gold has been on its way over the past four weeks. The aforementioned recovery target in the range of about 15 to 16 has not yet been reached, but is now in sight. Due to the rise, the stochastic on the weekly chart has activated a new buy signal. If the ratio can break out above the current resistance around 14, a continuation of the recovery to around 16.50 to 17.50 would be conceivable. In this region, the ratio then again encounters strong resistance. #### Allocation of sound money Generally, buying and selling Bitcoin against gold only makes sense to the extent that one balances the allocation in those two asset classes! At least 10% up to a maximum of 25% of one’s total assets should be invested in precious metals physically, while in cryptos and especially in bitcoin one should hold at least 1% but max. 5%. If you are very familiar with cryptocurrencies and bitcoin, you can certainly allocate much higher percentages to bitcoin on an individual basis. For the average investor, who is primarily invested in equities and real estate, a maximum of 5% in the still highly speculative and highly volatile bitcoin is a good guideline! “Overall, you want to own gold and bitcoin, since opposites complement each other. In our dualistic world of Yin and Yang, body and mind, up and down, warm and cold, we are bound by the necessary attraction of opposites. In this sense you can view gold and bitcoin as such a pair of strength. With the physical scarcity of gold and the digital scarcity of bitcoin you have a complementary unit of hard assets that will act as a true safe haven in the 21st century. You want to own both!” – Florian Grummes In summary, the bitcoin/gold-ratio still has a good chance to continue its recovery in favor of bitcoin in the direction of about 16.50 to 17.50 over the coming weeks . ### Macro Update – Summer recovery more than just a bear market rally? 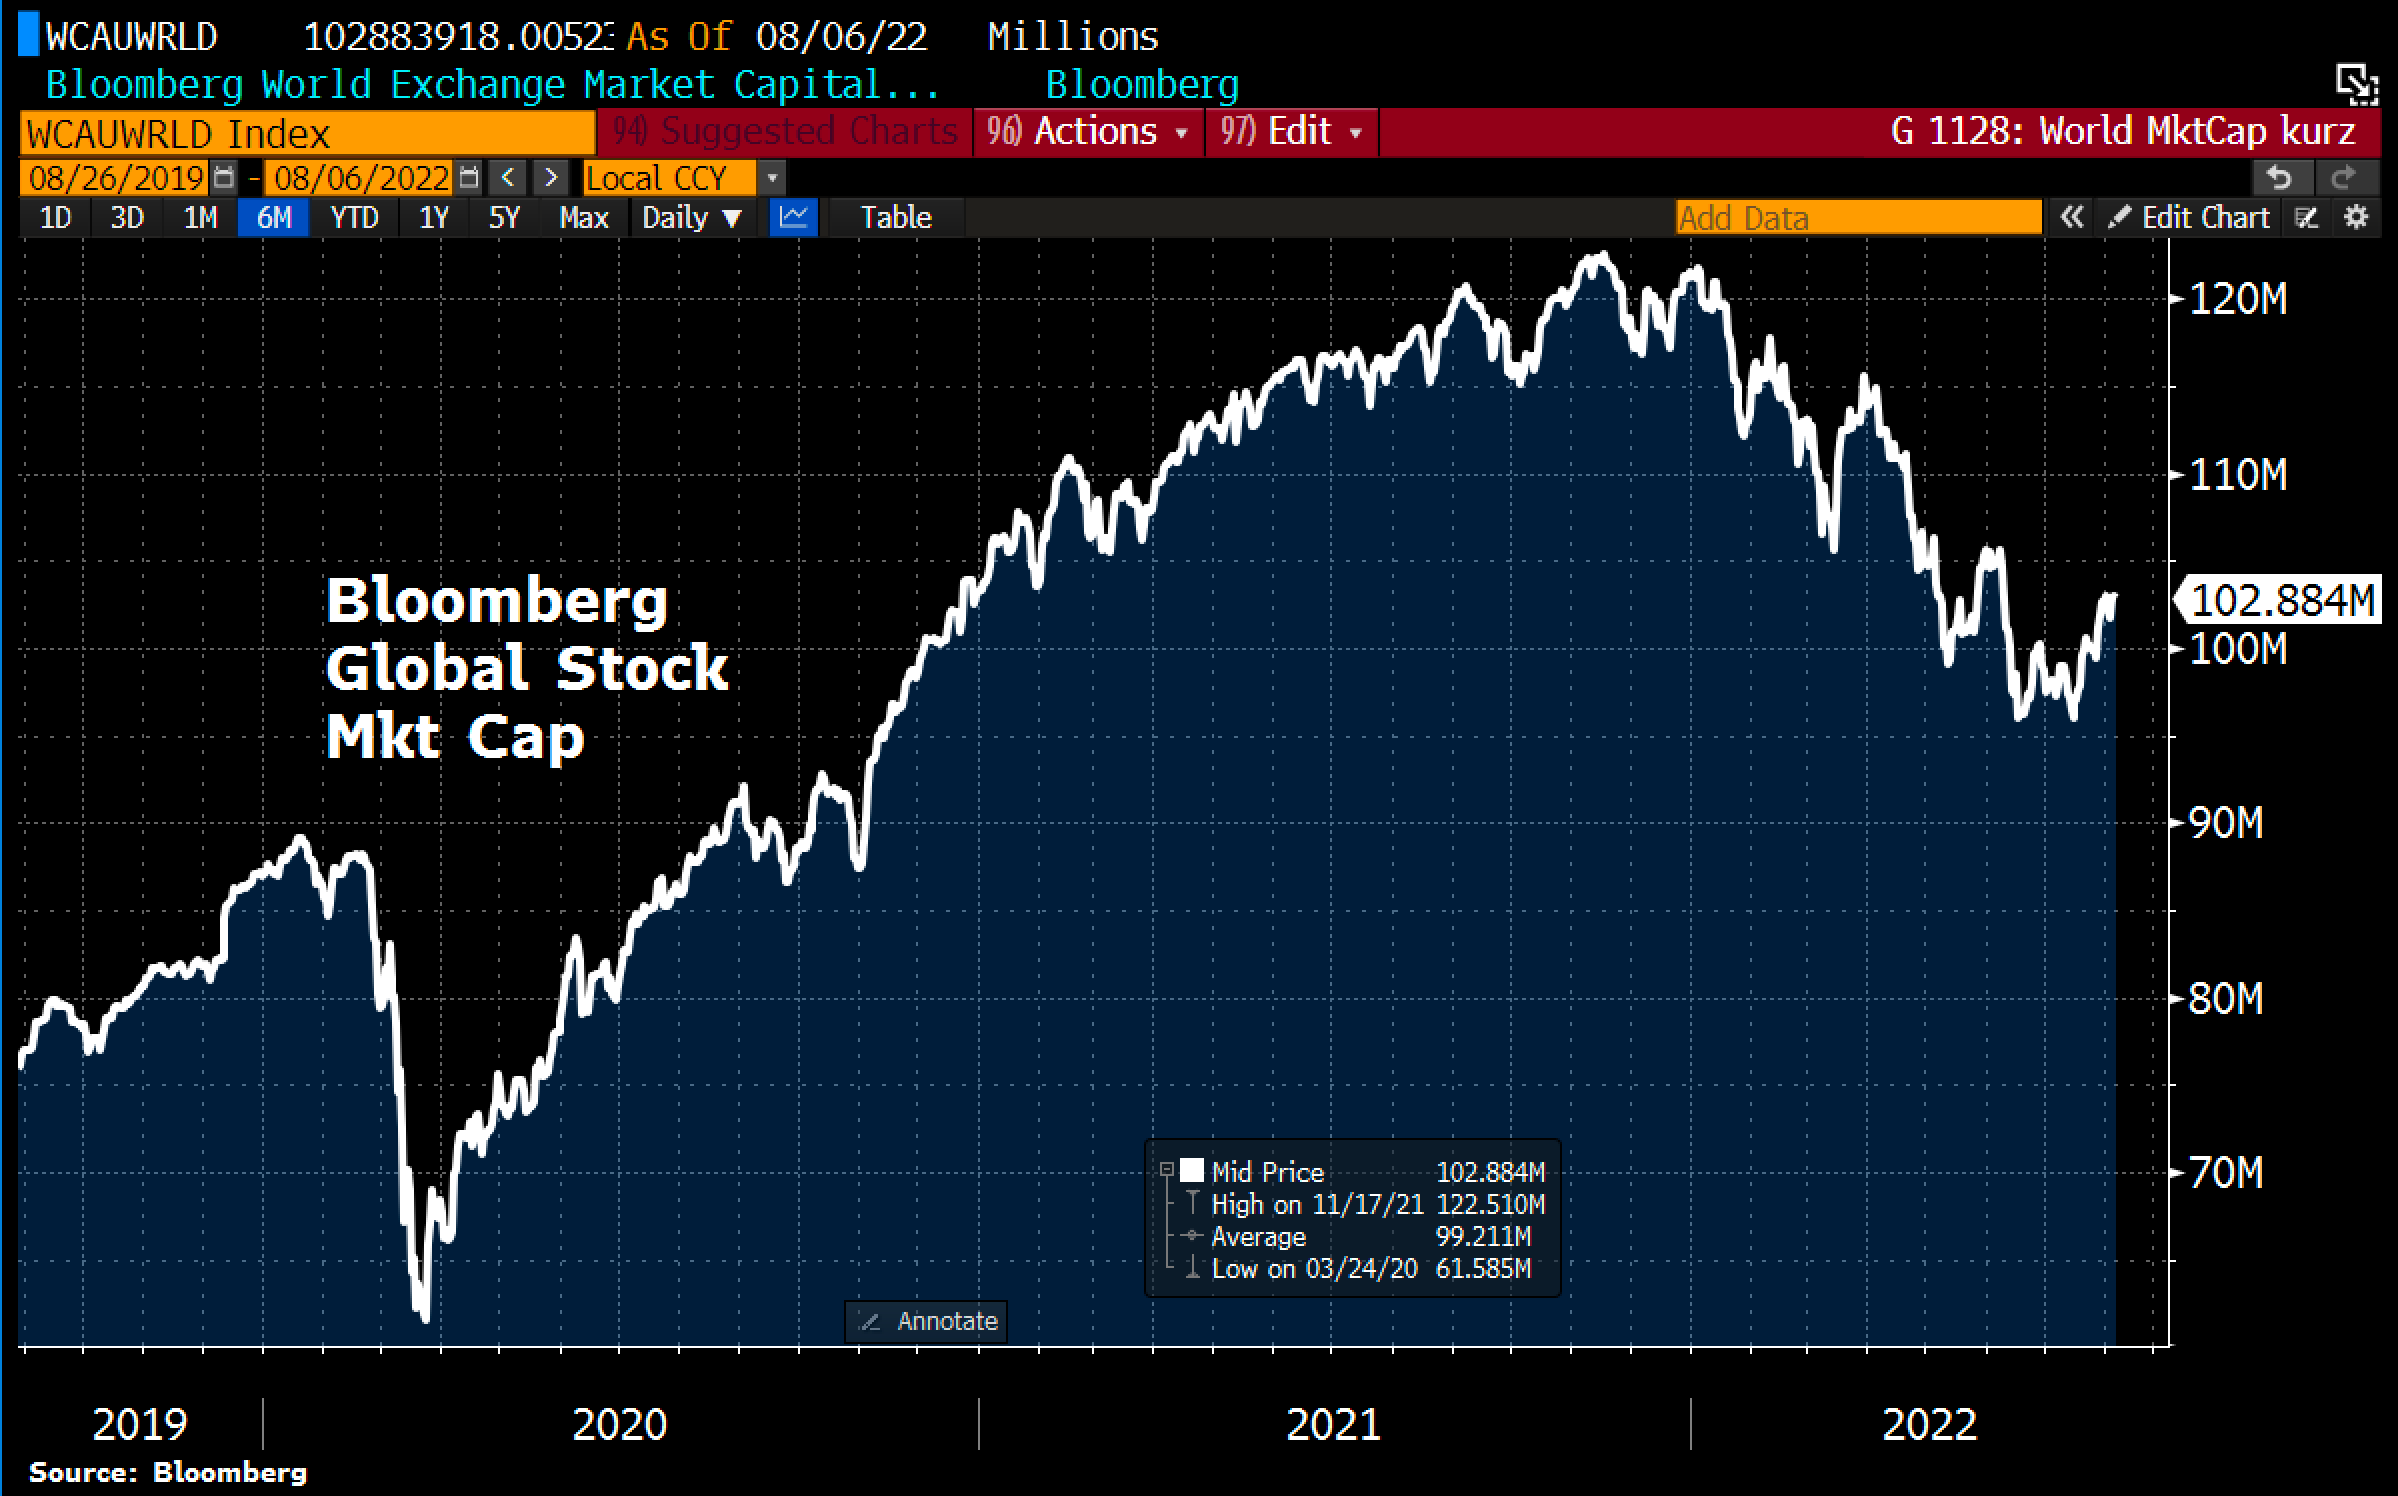 *Global stock-market capitalization, as of August 6th, 2022. ©Holger Zschaepitz* After months of tremendous pressure in equity and crypto markets since November 2021, a broad-based recovery has now been underway for just over four weeks. In this process, global equity markets have gained over 420 billion USD in market value and the technology-heavy Nasdaq Composite has risen over 20% from its low on June 16th. By definition, this would mean the bear market is over! 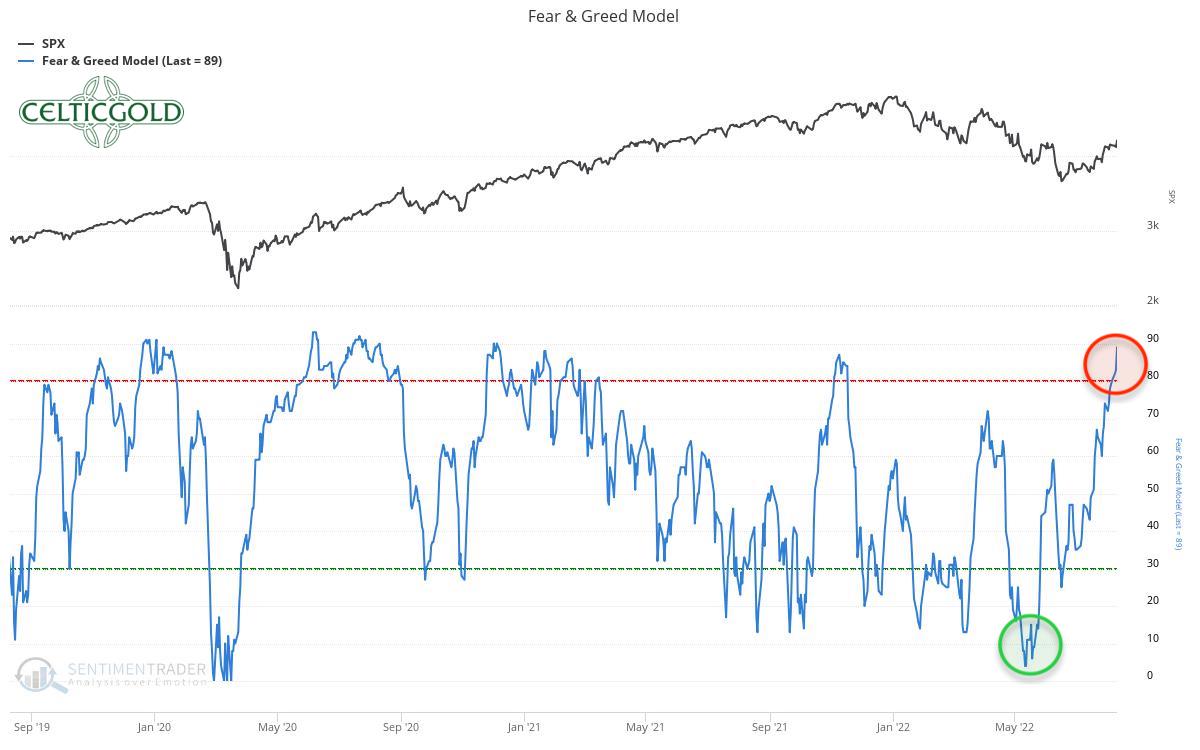 *Fear and Greed model, as of August 10th, 2022. Source: Sentimentrader* However, this recent recovery has brought about a shift in sentiment and the majority of market participants are now more optimistic about the future again. Thus, the Fear & Greed model has shifted from maximum fear to extreme greed in no time and the “Dumb Money” is daring to enter the markets again. This is the point at which bear market rallies usually turn! Given the ongoing recovery rally, however, clarity might not come before September about whether the month-long wave down in the markets was merely corrective in nature, or whether the markets are actually in a major cyclical bear market. In any case, the significant reduction in the Fed’s balance sheet only starts to gain momentum in September. From the current level of around 10 to 30 billion USD per month, almost half a trillion USD per month will then be wiped out. The midterm elections on November 8, on the other hand, could provide numerous fiscal stimuli on all fronts in order to prevent a landslide victory for the Republicans after all. 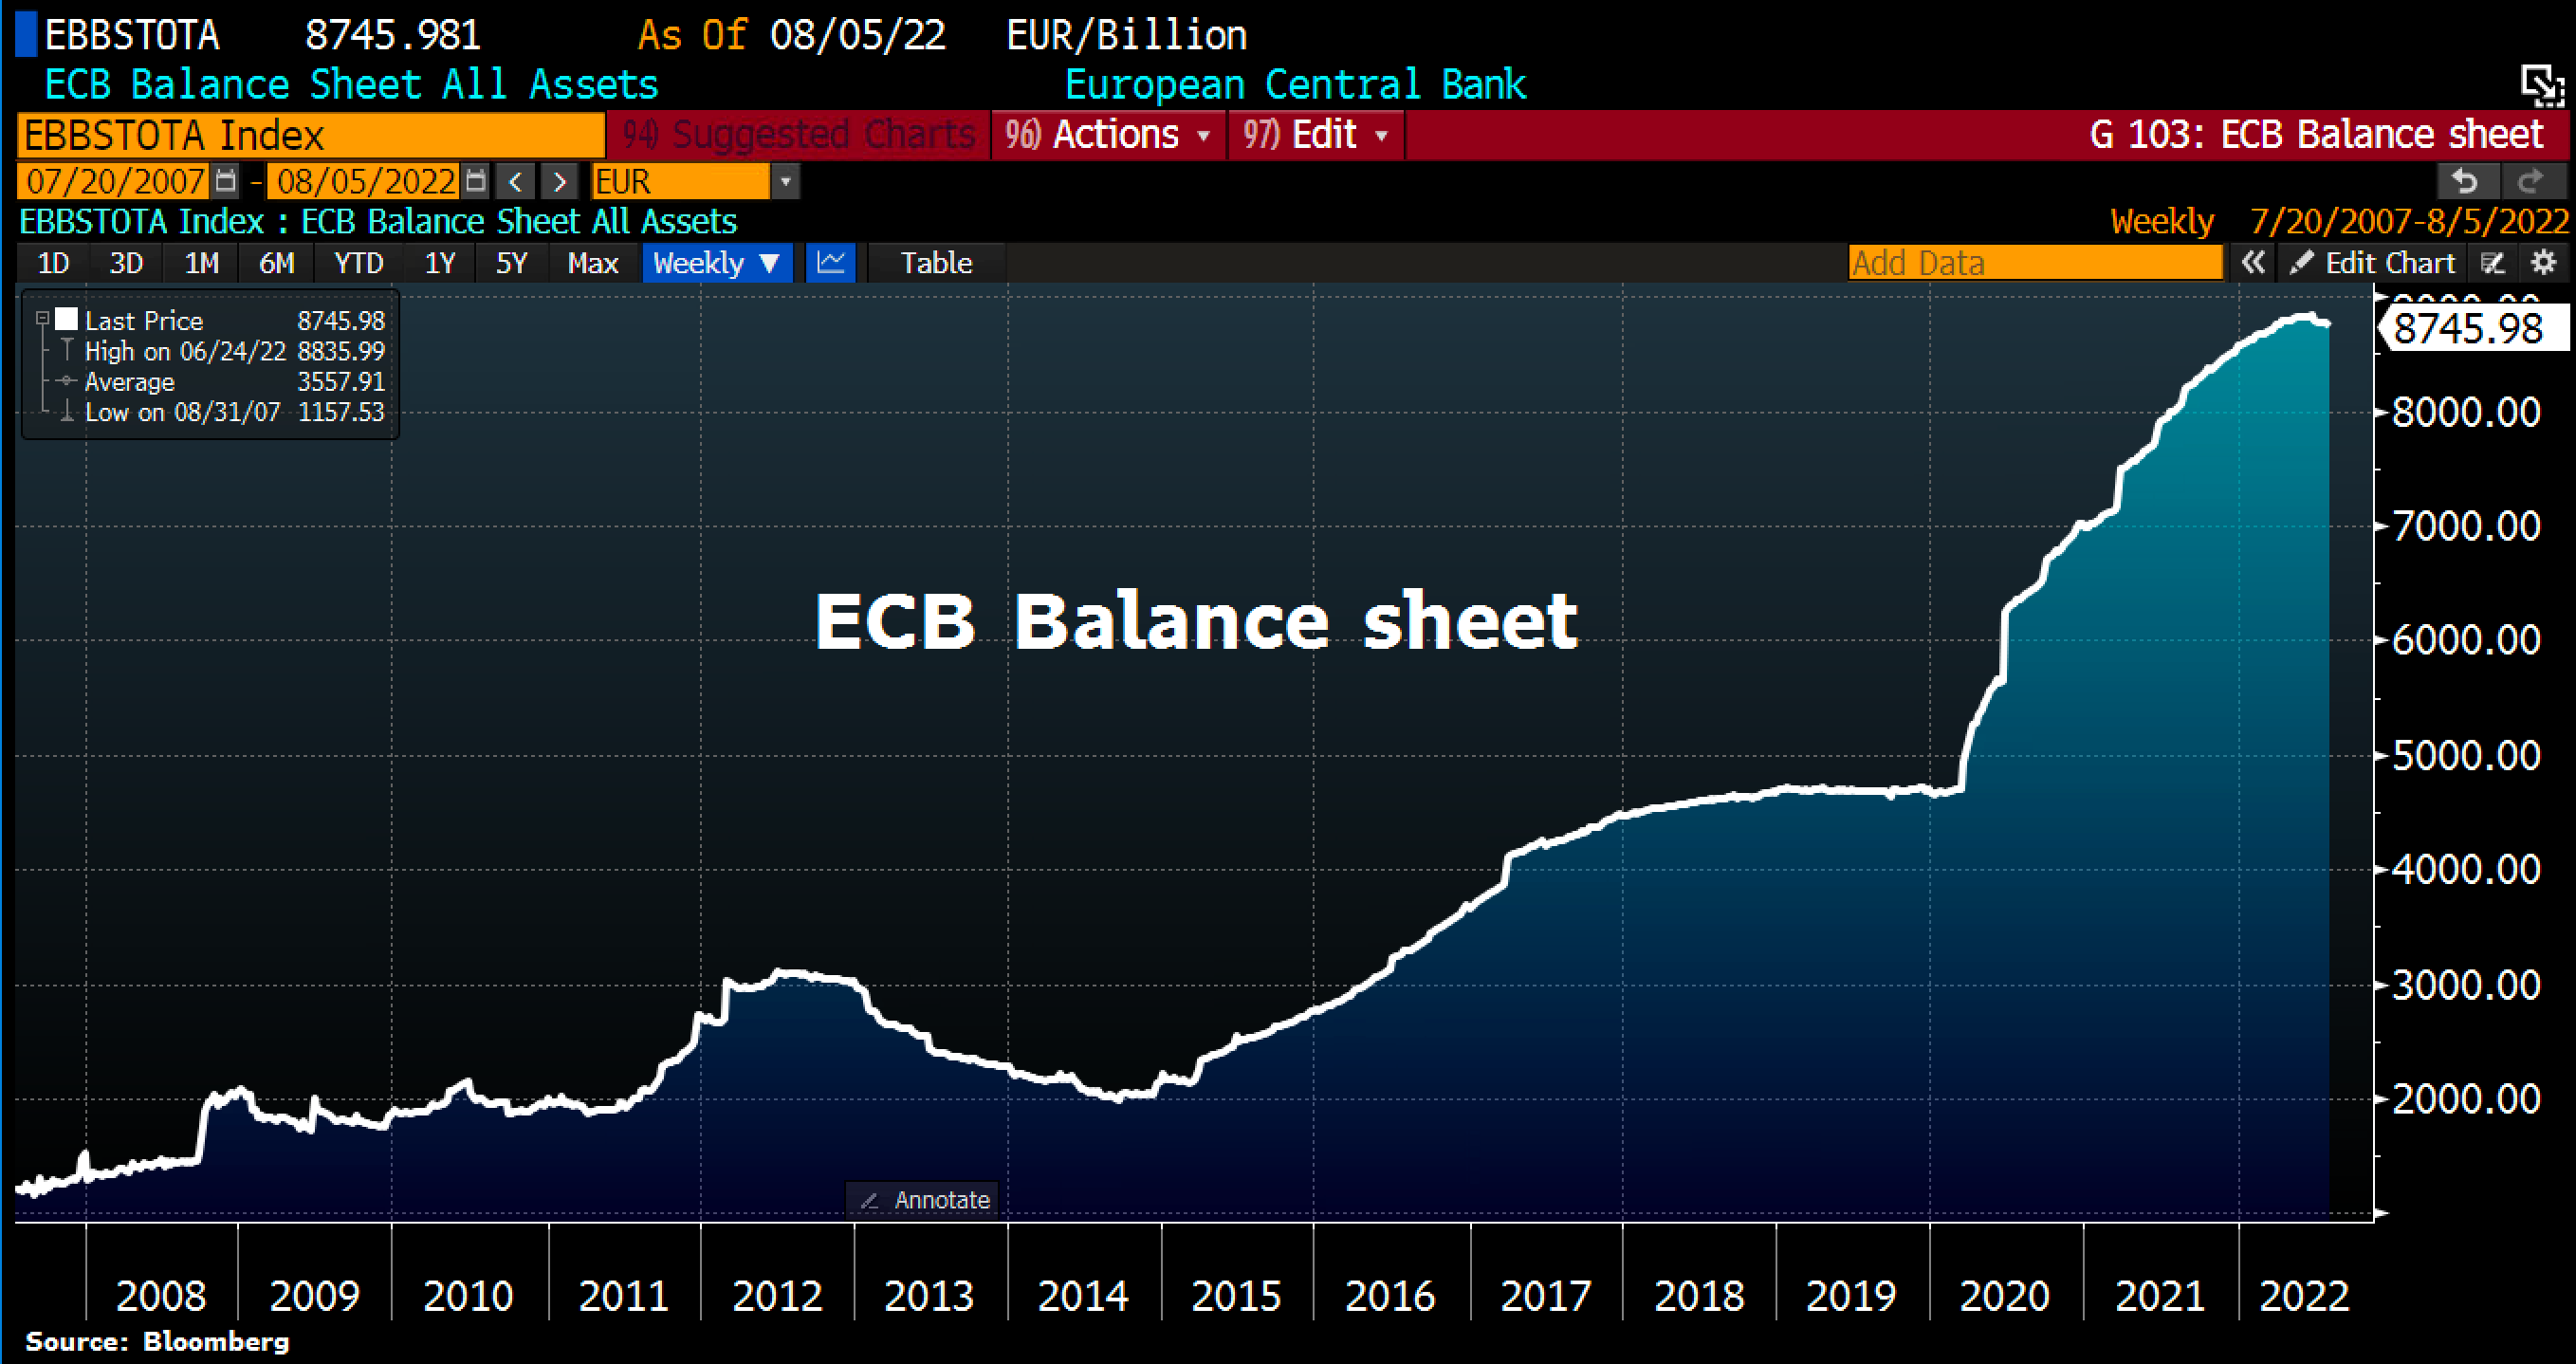 *ECB balance sheet, as of August 5th, 2022. ©Holger Zschaepitz* The central bank’s balance sheet is also shrinking in the eurozone. The week before last, the ECB announced the fifth decline in six weeks. Overall, total assets fell by a further 18.5 billion EUR to 8,746 billion EUR, and are now just under 90 billion EUR below their all-time high. 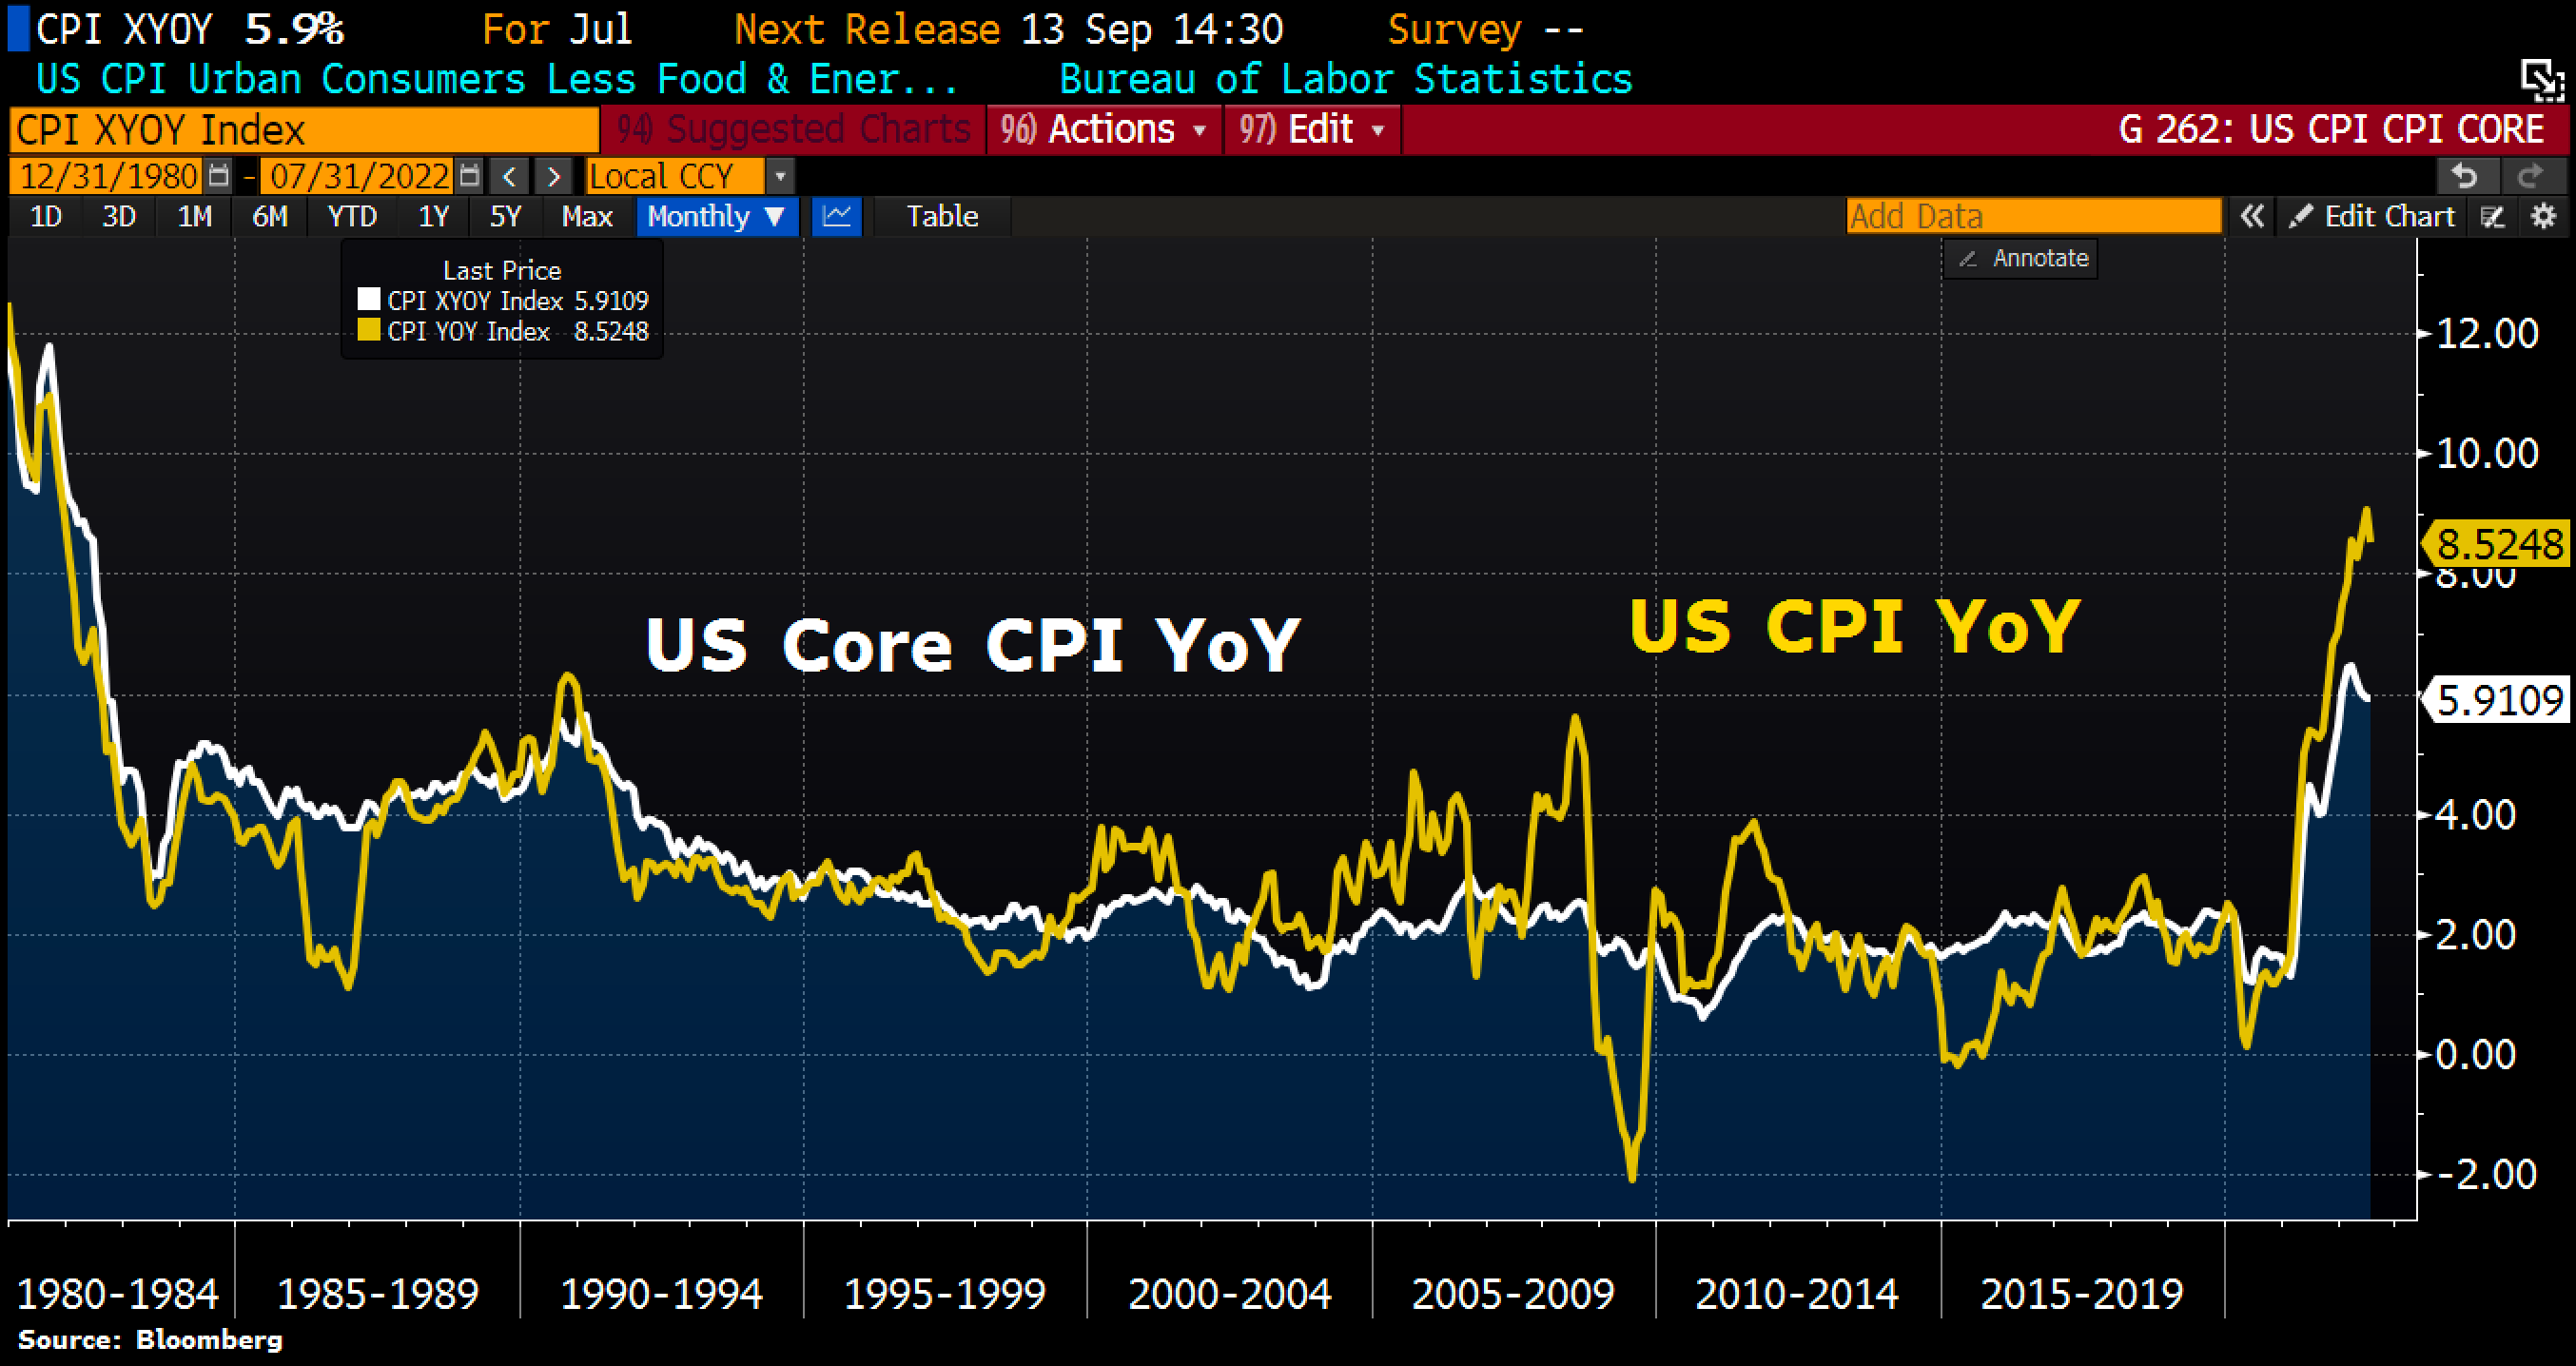 *U.S. inflation, as of August 10th, 2022. ©Holger Zschaepitz* At the same time, there are increasing signs that inflation may have peaked. For example, U.S. overall consumer prices rose 8.5% year-over-year in July, but were unchanged month-over-month. Of course, these are embellished baskets and the stabilization at a high level is primarily due to a weaker oil price. Nevertheless, the stock markets received the figures bullishly. Overall, we must continue to assume for the time being that the current recovery is merely a bear market rally. Nevertheless, fiscal stimulus in the U.S. could at least halfway stabilize the markets over the next three months. But there is still no reason to significantly increase exposure to the markets again. ### Conclusion: Bitcoin – Recovery reaches first price target Our assumption of a “relief rally in the summer?” came at exactly the right time four weeks ago, because bitcoin was able to stage a significant rally sine then. Trading around 18,900 USD back then and how sitting around 24,000 USD represents a gain of 27%. As well, our first price target of 25,000 USD has been hit. While optimism has now returned to the stock markets, fear and skepticism are still rather high in the crypto sector. The path of greatest pain therefore continues to lead upwards in the crypto sector. Our next price target for bitcoin is the 23.6% retracement around 29,725 USD. And at the round psychological number of 30,000 USD, we also expect a reunion with the falling 200-day moving average line at some point. Nevertheless, the end of the crypto winter cannot be proclaimed yet. _Analysis sponsored and initially published on August 11th, 2022, by [www.celticgold.eu](https://www.midastouch-consulting.com/15082022-bitcoin-recovery-reaches-first-price-target). Translated into English and partially updated on August 15th, 2022._ _Feel free to join us in our free [Telegram channel](https://t.me/MidasTouchConsulting) for daily real time data and a great community._ _If you like to get regular updates on our gold model, precious metals, commodities, and cryptocurrencies you can subscribe to our [free newsletter](http://bit.ly/1EUdt2K)._ _Disclosure: This article and the content are for informational purposes only and do not contain investment advice or recommendations. Every investment and trading move involves risk, and readers should conduct their own research when making a decision. The views, thoughts and opinions expressed here are the author’s alone. They do not necessarily reflect or represent the views and opinions of Midas Touch Consulting._ - |
| json metadata | {"tags":["bitcoin","crypto","leofinance","gold","investing","trading","macro"],"image":["https://cdn.steemitimages.com/DQmZntXw1JT1zkWmSUstf8z15qQYD5hKc2QQdHHSsHXB1QX/blog-header-celticgold-bitcoin.jpg","https://cdn.steemitimages.com/DQmUQg5X7WRdSxHPXdUuyEeQTurdcxLnA1KhCDmYoTJysCJ/Chart%2001%20Bitcoin%20weekly%20chart%20150822.png","https://cdn.steemitimages.com/DQmbtXVBU6PHZ7Jsxm14jTxobV6PUku18ShuT4buyyh6Bv1/Chart%2002%20Bitcoin%20daily%20chart%20150822.png","https://cdn.steemitimages.com/DQmT1WmiwcQKJxP32vevpd1DqSFqLuRwCiyVjyPvzdRQR2e/Chart%2003%20Crypto%20Fear%20&%20Greed%20Index%20110822.png","https://cdn.steemitimages.com/DQmb2WVyTH7yQMnM45KdK4cbqCx7k4SmsrDMDqQs2yapZiP/Chart%2004%20Crypto%20Fear%20&%20Greed%20Index%20110822.png","https://cdn.steemitimages.com/DQmaAxfgzXPK3A7mpd1Nr3RAaAGtH3cDgjaoFbyWcBN2gxK/Chart%2005%20Bitcoin%20Saisonalit%C3%A4t%20110822.png","https://cdn.steemitimages.com/DQmQ2ChG1VVBAGo5xVkLC1Abzm7PB33yxvcNyphrtFtFdfu/Chart%2006%20Bitcoin:Gold-Ratio%20110822.png","https://cdn.steemitimages.com/DQmakvoXuNM5RnZiQz26MU8iAhc8XWXbnqsdderAhnrsmjV/Chart%2007%20Global%20Stock%20Market%20Cap%20070822.png","https://cdn.steemitimages.com/DQmYESg688mJmw99DEuA4nXJ2HkvRZHCbZ2PS3VNAnoX9Hp/Chart%2008%20Fear%20&%20Greed%20Model%20100822.jpeg","https://cdn.steemitimages.com/DQmeUiGySALkFMVzxVi3DK9JcrbpUVBbpaNQNTFWCDuyzFj/Chart%2009%20EZB%20Bilanz%20090822.png","https://cdn.steemitimages.com/DQmPWM9iozqxVkR9ZDiuaUqLbvhDpuGjXz3EjFVFhP6FSGV/Chart%2010%20US-Inflation%20100822.png"],"links":["https://www.midastouch-consulting.com/15082022-bitcoin-recovery-reaches-first-price-target","https://t.me/MidasTouchConsulting","http://bit.ly/1EUdt2K"],"app":"steemit/0.2","format":"markdown"} |
| parent author | |
| parent permlink | bitcoin |
| permlink | august-15th-2022-bitcoin-recovery-reaches-first-price-target |
| title | August 15th, 2022, Bitcoin – Recovery reaches first price target |
| Transaction Info | Block #66851238/Trx 53cd0b91d7d2eb80137824a59ef96c6e082e6597 |
View Raw JSON Data
{
"block": 66851238,
"op": [
"comment",
{
"author": "midastouch",
"body": "\n# [August 15th, 2022, Bitcoin – Recovery reaches first price target](https://www.midastouch-consulting.com/15082022-bitcoin-recovery-reaches-first-price-target) \n\nOver the last few weeks, bitcoin was able to stage a recovery. Just two days ago, bitcoin prices reclaimed the 25,000 USD level for the first time since June 13th. Bitcoin – Recovery reaches first price target.\n\n### Review\n\nSince our analysis on July 13th (Relief rally in summer?), bitcoin has recovered significantly, as expected. At the peak, bitcoin prices gained almost 33% in the last four weeks and reached the highest level since the crash in mid-June with prices around 25,212 USD. Ethereum performed even stronger, rallying nearly 102% over the same timeframe.\n\nOver the last two weeks, however, bitcoin has been rather calmly running sideways between 22,500 USD and 24,500 USD. At the same time, stock markets as well as most commodity prices were able to recover a good bit in recent weeks, too. Hence, financial markets in general are experiencing the expected summer rally.\n\nSince sentiment had reached an extreme panic mood in mid of June due to the month-long and severe correction in the financial markets, the perception among participants has now improved significantly in the course of the recent recovery. In itself, this is a classic pattern within an established bear market. Yet, whether and how the bears will return, will likely not get clearer until mid of September.\n\n### Technical Analysis For Bitcoin in US-Dollar\n#### Bitcoin Weekly Chart – Stochastic oscillator with a buy signal.\n\n\n*Bitcoin in USD, weekly chart as of August 15th, 2022. Source: Tradingview*\n\nWithin the established downtrend channel, since the all-time high at 69,000 USD in November 2021, bitcoin was able to recover a good bit recently. Starting from the low around 17,600 USD, bitcoin is currently trading nearly 37% higher. This recovery has led to a buy signal from the weekly stochastic oscillator. As well, the recovery wave has also crossed the mid-trend line within the downtrend channel. Therefore, chances for a continuation of the recovery towards 29,000 USD to 30,000 USD are pretty good.\n\nOverall, the weekly chart is providing a first bullish signal. It is still too early to speak of a sustainable trend reversal and the end of the crypto winter. However, a continuation of the recovery seems quite possible in any case and is the preferred scenario.\n\n#### Bitcoin Daily Chart – 200-day moving average remains the recovery target\n\n*Bitcoin in USD, daily chart as of August 15th, 2022. Source: Tradingview*\n\nOn the daily chart, bitcoin prices have reached our first price target around 25,000 USD. Currently, bitcoin is trading slightly below its upper Bollinger Band (24,622 USD). Though this resistance has been attacked various times in recent weeks, it has not (yet) released more room to the upside on a daily basis. While the stochastic oscillator is trying to hide its active buy signal, the distance to the falling 200-day line (32,855 USD) is still significant. A reunion with this moving average should therefore definitely succeed in the coming weeks or months.\n\nNevertheless, the flat uptrend can still turn out to be a bearish flag formation, similar to the beginning of May. But even then, the higher probability points towards the upside, at least in the short term. Thus, a sustained rise above 25,000 USD could force a short squeeze and entail a rapid rise towards 29,000 to 30,000 USD.\n\nIn summary, the daily chart is bullish. The recovery still has room to the upside. The next recovery target is the 30,000 USD mark and the fast falling 200-day moving average line. Only below 22,000 USD, the picture would degrade significantly.\n\n### Sentiment Bitcoin – Recovery reaches first price target\n\n*Crypto Fear & Greed Index, as of August 11th, 2022. Source: Lookintobitcoin*\n\nThe Crypto Fear & Greed Index has recovered significantly over the past four weeks. However, it still measures a rather fearful sentiment. After the brutal sell-off, which spanned over seven months, fear continues to run deep in the crypto sector.\n\n\n*Crypto Fear & Greed Index long term, as of August 11th, 2022. Source: Lookintobitcoin*\n\nIn the bigger picture, the beaten down sentiment remains in place, as well. This setup holds some really good contrarian opportunities.\n\nOverall, the fearful sentiment continues to provide a contrarian buy signal.\n\n### Seasonality Bitcoin – Recovery reaches first price target\n\n*Seasonality for bitcoin, as of August 11th, 2022. Source: Seasonax*\n\nThe seasonal component remains rather unfavorable until the end of September or the beginning of October. In particular, September is traditionally a weak month in the stock markets. Since bitcoin and the stock markets have been strongly correlated for months, the weak seasonal trend might therefore get reinforced in September. However, according to the seasonal pattern, October could see the start of a new uptrend in the crypto sector.\n\nGiven the “midterm elections” on November 8th in the U.S., sharp drops in the financial markets would be very counterproductive to keep the current administration in place. Therefore, only a mild pullback in financial markets during September would be more conceivable. From those lows the markets could then recover further until the U.S. election.\n\nOverall, the seasonal component still calls for patience. Statistically speaking, the situation does not brighten up significantly until mid-October. In the very short term, however, the continuation of the summer rally is still possible.\n\n### Sound Money: Bitcoin vs. Gold\n\n*Bitcoin/Gold-Ratio as of August 15th, 2022.Source: Tradingview*\n\nThe bitcoin/gold-ratio recovered from its low of 9.59 to its current level of 13.5. At prices of currently around 24,000 USD for one bitcoin and around 1,775 for one troy ounce of gold, you have to pay 13.5 ounces of gold for one bitcoin. Put another way, a troy ounce of gold currently costs about 0.074 bitcoin.\n\nOverall, a recovery in favor of bitcoin against gold has been on its way over the past four weeks. The aforementioned recovery target in the range of about 15 to 16 has not yet been reached, but is now in sight. Due to the rise, the stochastic on the weekly chart has activated a new buy signal. If the ratio can break out above the current resistance around 14, a continuation of the recovery to around 16.50 to 17.50 would be conceivable. In this region, the ratio then again encounters strong resistance.\n\n#### Allocation of sound money\n\nGenerally, buying and selling Bitcoin against gold only makes sense to the extent that one balances the allocation in those two asset classes! At least 10% up to a maximum of 25% of one’s total assets should be invested in precious metals physically, while in cryptos and especially in bitcoin one should hold at least 1% but max. 5%. If you are very familiar with cryptocurrencies and bitcoin, you can certainly allocate much higher percentages to bitcoin on an individual basis. For the average investor, who is primarily invested in equities and real estate, a maximum of 5% in the still highly speculative and highly volatile bitcoin is a good guideline!\n\n“Overall, you want to own gold and bitcoin, since opposites complement each other. In our dualistic world of Yin and Yang, body and mind, up and down, warm and cold, we are bound by the necessary attraction of opposites. In this sense you can view gold and bitcoin as such a pair of strength. With the physical scarcity of gold and the digital scarcity of bitcoin you have a complementary unit of hard assets that will act as a true safe haven in the 21st century. You want to own both!” – Florian Grummes\n\nIn summary, the bitcoin/gold-ratio still has a good chance to continue its recovery in favor of bitcoin in the direction of about 16.50 to 17.50 over the coming weeks .\n\n### Macro Update – Summer recovery more than just a bear market rally?\n\n*Global stock-market capitalization, as of August 6th, 2022. ©Holger Zschaepitz*\n\nAfter months of tremendous pressure in equity and crypto markets since November 2021, a broad-based recovery has now been underway for just over four weeks. In this process, global equity markets have gained over 420 billion USD in market value and the technology-heavy Nasdaq Composite has risen over 20% from its low on June 16th. By definition, this would mean the bear market is over!\n\n\n*Fear and Greed model, as of August 10th, 2022. Source: Sentimentrader*\n\nHowever, this recent recovery has brought about a shift in sentiment and the majority of market participants are now more optimistic about the future again. Thus, the Fear & Greed model has shifted from maximum fear to extreme greed in no time and the “Dumb Money” is daring to enter the markets again. This is the point at which bear market rallies usually turn!\n\nGiven the ongoing recovery rally, however, clarity might not come before September about whether the month-long wave down in the markets was merely corrective in nature, or whether the markets are actually in a major cyclical bear market.\n\nIn any case, the significant reduction in the Fed’s balance sheet only starts to gain momentum in September. From the current level of around 10 to 30 billion USD per month, almost half a trillion USD per month will then be wiped out. The midterm elections on November 8, on the other hand, could provide numerous fiscal stimuli on all fronts in order to prevent a landslide victory for the Republicans after all.\n\n\n*ECB balance sheet, as of August 5th, 2022. ©Holger Zschaepitz*\n\nThe central bank’s balance sheet is also shrinking in the eurozone. The week before last, the ECB announced the fifth decline in six weeks. Overall, total assets fell by a further 18.5 billion EUR to 8,746 billion EUR, and are now just under 90 billion EUR below their all-time high.\n\n\n*U.S. inflation, as of August 10th, 2022. ©Holger Zschaepitz*\n\nAt the same time, there are increasing signs that inflation may have peaked. For example, U.S. overall consumer prices rose 8.5% year-over-year in July, but were unchanged month-over-month. Of course, these are embellished baskets and the stabilization at a high level is primarily due to a weaker oil price. Nevertheless, the stock markets received the figures bullishly.\n\nOverall, we must continue to assume for the time being that the current recovery is merely a bear market rally. Nevertheless, fiscal stimulus in the U.S. could at least halfway stabilize the markets over the next three months. But there is still no reason to significantly increase exposure to the markets again.\n\n### Conclusion: Bitcoin – Recovery reaches first price target\n\nOur assumption of a “relief rally in the summer?” came at exactly the right time four weeks ago, because bitcoin was able to stage a significant rally sine then. Trading around 18,900 USD back then and how sitting around 24,000 USD represents a gain of 27%. As well, our first price target of 25,000 USD has been hit.\n\nWhile optimism has now returned to the stock markets, fear and skepticism are still rather high in the crypto sector. The path of greatest pain therefore continues to lead upwards in the crypto sector. Our next price target for bitcoin is the 23.6% retracement around 29,725 USD. And at the round psychological number of 30,000 USD, we also expect a reunion with the falling 200-day moving average line at some point. Nevertheless, the end of the crypto winter cannot be proclaimed yet.\n\n_Analysis sponsored and initially published on August 11th, 2022, by [www.celticgold.eu](https://www.midastouch-consulting.com/15082022-bitcoin-recovery-reaches-first-price-target). Translated into English and partially updated on August 15th, 2022._\n\n_Feel free to join us in our free [Telegram channel](https://t.me/MidasTouchConsulting) for daily real time data and a great community._ \n\n_If you like to get regular updates on our gold model, precious metals, commodities, and cryptocurrencies you can subscribe to our [free newsletter](http://bit.ly/1EUdt2K)._ \n\n_Disclosure: This article and the content are for informational purposes only and do not contain investment advice or recommendations. Every investment and trading move involves risk, and readers should conduct their own research when making a decision. The views, thoughts and opinions expressed here are the author’s alone. They do not necessarily reflect or represent the views and opinions of Midas Touch Consulting._ -",
"json_metadata": "{\"tags\":[\"bitcoin\",\"crypto\",\"leofinance\",\"gold\",\"investing\",\"trading\",\"macro\"],\"image\":[\"https://cdn.steemitimages.com/DQmZntXw1JT1zkWmSUstf8z15qQYD5hKc2QQdHHSsHXB1QX/blog-header-celticgold-bitcoin.jpg\",\"https://cdn.steemitimages.com/DQmUQg5X7WRdSxHPXdUuyEeQTurdcxLnA1KhCDmYoTJysCJ/Chart%2001%20Bitcoin%20weekly%20chart%20150822.png\",\"https://cdn.steemitimages.com/DQmbtXVBU6PHZ7Jsxm14jTxobV6PUku18ShuT4buyyh6Bv1/Chart%2002%20Bitcoin%20daily%20chart%20150822.png\",\"https://cdn.steemitimages.com/DQmT1WmiwcQKJxP32vevpd1DqSFqLuRwCiyVjyPvzdRQR2e/Chart%2003%20Crypto%20Fear%20&%20Greed%20Index%20110822.png\",\"https://cdn.steemitimages.com/DQmb2WVyTH7yQMnM45KdK4cbqCx7k4SmsrDMDqQs2yapZiP/Chart%2004%20Crypto%20Fear%20&%20Greed%20Index%20110822.png\",\"https://cdn.steemitimages.com/DQmaAxfgzXPK3A7mpd1Nr3RAaAGtH3cDgjaoFbyWcBN2gxK/Chart%2005%20Bitcoin%20Saisonalit%C3%A4t%20110822.png\",\"https://cdn.steemitimages.com/DQmQ2ChG1VVBAGo5xVkLC1Abzm7PB33yxvcNyphrtFtFdfu/Chart%2006%20Bitcoin:Gold-Ratio%20110822.png\",\"https://cdn.steemitimages.com/DQmakvoXuNM5RnZiQz26MU8iAhc8XWXbnqsdderAhnrsmjV/Chart%2007%20Global%20Stock%20Market%20Cap%20070822.png\",\"https://cdn.steemitimages.com/DQmYESg688mJmw99DEuA4nXJ2HkvRZHCbZ2PS3VNAnoX9Hp/Chart%2008%20Fear%20&%20Greed%20Model%20100822.jpeg\",\"https://cdn.steemitimages.com/DQmeUiGySALkFMVzxVi3DK9JcrbpUVBbpaNQNTFWCDuyzFj/Chart%2009%20EZB%20Bilanz%20090822.png\",\"https://cdn.steemitimages.com/DQmPWM9iozqxVkR9ZDiuaUqLbvhDpuGjXz3EjFVFhP6FSGV/Chart%2010%20US-Inflation%20100822.png\"],\"links\":[\"https://www.midastouch-consulting.com/15082022-bitcoin-recovery-reaches-first-price-target\",\"https://t.me/MidasTouchConsulting\",\"http://bit.ly/1EUdt2K\"],\"app\":\"steemit/0.2\",\"format\":\"markdown\"}",
"parent_author": "",
"parent_permlink": "bitcoin",
"permlink": "august-15th-2022-bitcoin-recovery-reaches-first-price-target",
"title": "August 15th, 2022, Bitcoin – Recovery reaches first price target"
}
],
"op_in_trx": 0,
"timestamp": "2022-08-16T10:54:30",
"trx_id": "53cd0b91d7d2eb80137824a59ef96c6e082e6597",
"trx_in_block": 5,
"virtual_op": 0
}cve3upvoted (100.00%) @midastouch / july-28th-2022-gold-summer-rally-has-started2022/08/04 00:57:39
cve3upvoted (100.00%) @midastouch / july-28th-2022-gold-summer-rally-has-started
2022/08/04 00:57:39
| author | midastouch |
| permlink | july-28th-2022-gold-summer-rally-has-started |
| voter | cve3 |
| weight | 10000 (100.00%) |
| Transaction Info | Block #66496208/Trx 0c1e6f004cdc464353eb580fac1cc2efd1b41c0a |
View Raw JSON Data
{
  "block": 66496208,
  "op": [
    "vote",
    {
      "author": "midastouch",
      "permlink": "july-28th-2022-gold-summer-rally-has-started",
      "voter": "cve3",
      "weight": 10000
    }
  ],
  "op_in_trx": 0,
  "timestamp": "2022-08-04T00:57:39",
  "trx_id": "0c1e6f004cdc464353eb580fac1cc2efd1b41c0a",
  "trx_in_block": 3,
  "virtual_op": 0
}maxlonggoldupvoted (100.00%) @midastouch / july-28th-2022-gold-summer-rally-has-started2022/08/04 00:47:00
maxlonggoldupvoted (100.00%) @midastouch / july-28th-2022-gold-summer-rally-has-started
2022/08/04 00:47:00
| author | midastouch |
| permlink | july-28th-2022-gold-summer-rally-has-started |
| voter | maxlonggold |
| weight | 10000 (100.00%) |
| Transaction Info | Block #66495995/Trx 0445e3e12294009241a7275a9c9267d8ec081bd5 |
View Raw JSON Data
{
  "block": 66495995,
  "op": [
    "vote",
    {
      "author": "midastouch",
      "permlink": "july-28th-2022-gold-summer-rally-has-started",
      "voter": "maxlonggold",
      "weight": 10000
    }
  ],
  "op_in_trx": 0,
  "timestamp": "2022-08-04T00:47:00",
  "trx_id": "0445e3e12294009241a7275a9c9267d8ec081bd5",
  "trx_in_block": 0,
  "virtual_op": 0
}pocket-changereplied to @midastouch / rfro2h2022/07/29 05:18:18
pocket-changereplied to @midastouch / rfro2h
2022/07/29 05:18:18
| author | pocket-change |
| body | What do you think about the recent $50,000,000 purchase of 90% Silver and Gold U.S. Coins...??? Do you think the U.S. Treasury will be offering Special Deals for all 90% Silver and Gold U.S. Coins...??? |
| json metadata | {"app":"steemit/0.2"} |
| parent author | midastouch |
| parent permlink | july-28th-2022-gold-summer-rally-has-started |
| permlink | rfro2h |
| title | |
| Transaction Info | Block #66329491/Trx 1d790f29f91ab9a9cd01e46c7566a27cab94ca00 |
View Raw JSON Data
{
  "block": 66329491,
  "op": [
    "comment",
    {
      "author": "pocket-change",
      "body": "What do you think about the recent $50,000,000 purchase of 90% Silver and Gold U.S. Coins...???\n\nDo you think the U.S. Treasury will be offering Special Deals for all 90% Silver and Gold U.S. Coins...???",
      "json_metadata": "{\"app\":\"steemit/0.2\"}",
      "parent_author": "midastouch",
      "parent_permlink": "july-28th-2022-gold-summer-rally-has-started",
      "permlink": "rfro2h",
      "title": ""
    }
  ],
  "op_in_trx": 0,
  "timestamp": "2022-07-29T05:18:18",
  "trx_id": "1d790f29f91ab9a9cd01e46c7566a27cab94ca00",
  "trx_in_block": 32,
  "virtual_op": 0
}midastouchpublished a new post: july-28th-2022-gold-summer-rally-has-started2022/07/29 03:56:39
midastouchpublished a new post: july-28th-2022-gold-summer-rally-has-started
2022/07/29 03:56:39
| author | midastouch |
| body |  # [July 28th, 2022: Gold – Summer rally has started](https://www.midastouch-consulting.com/14072022-bitcoin-relief-rally-in-the-summer) It’s been three and half tough months for gold and silver investors. Stockmarket and crypto investors have been suffering since November 2021 already, though. Now, after a bloodbath of almost 400 USD in the gold market, last week’s reversal looks promising. Gold – Summer rally has started. ### Review Gold prices reached an important high on March 8th, 2022, at around 2,070 USD and have since then slid into a brutal sell-off over the course of the last three and a half months. The final low of this wave down has been seen on Thursday, 21st of July, at 1,681 USD. Thus, gold has lost almost 400 USD or 18.8% in a rather short period of time. 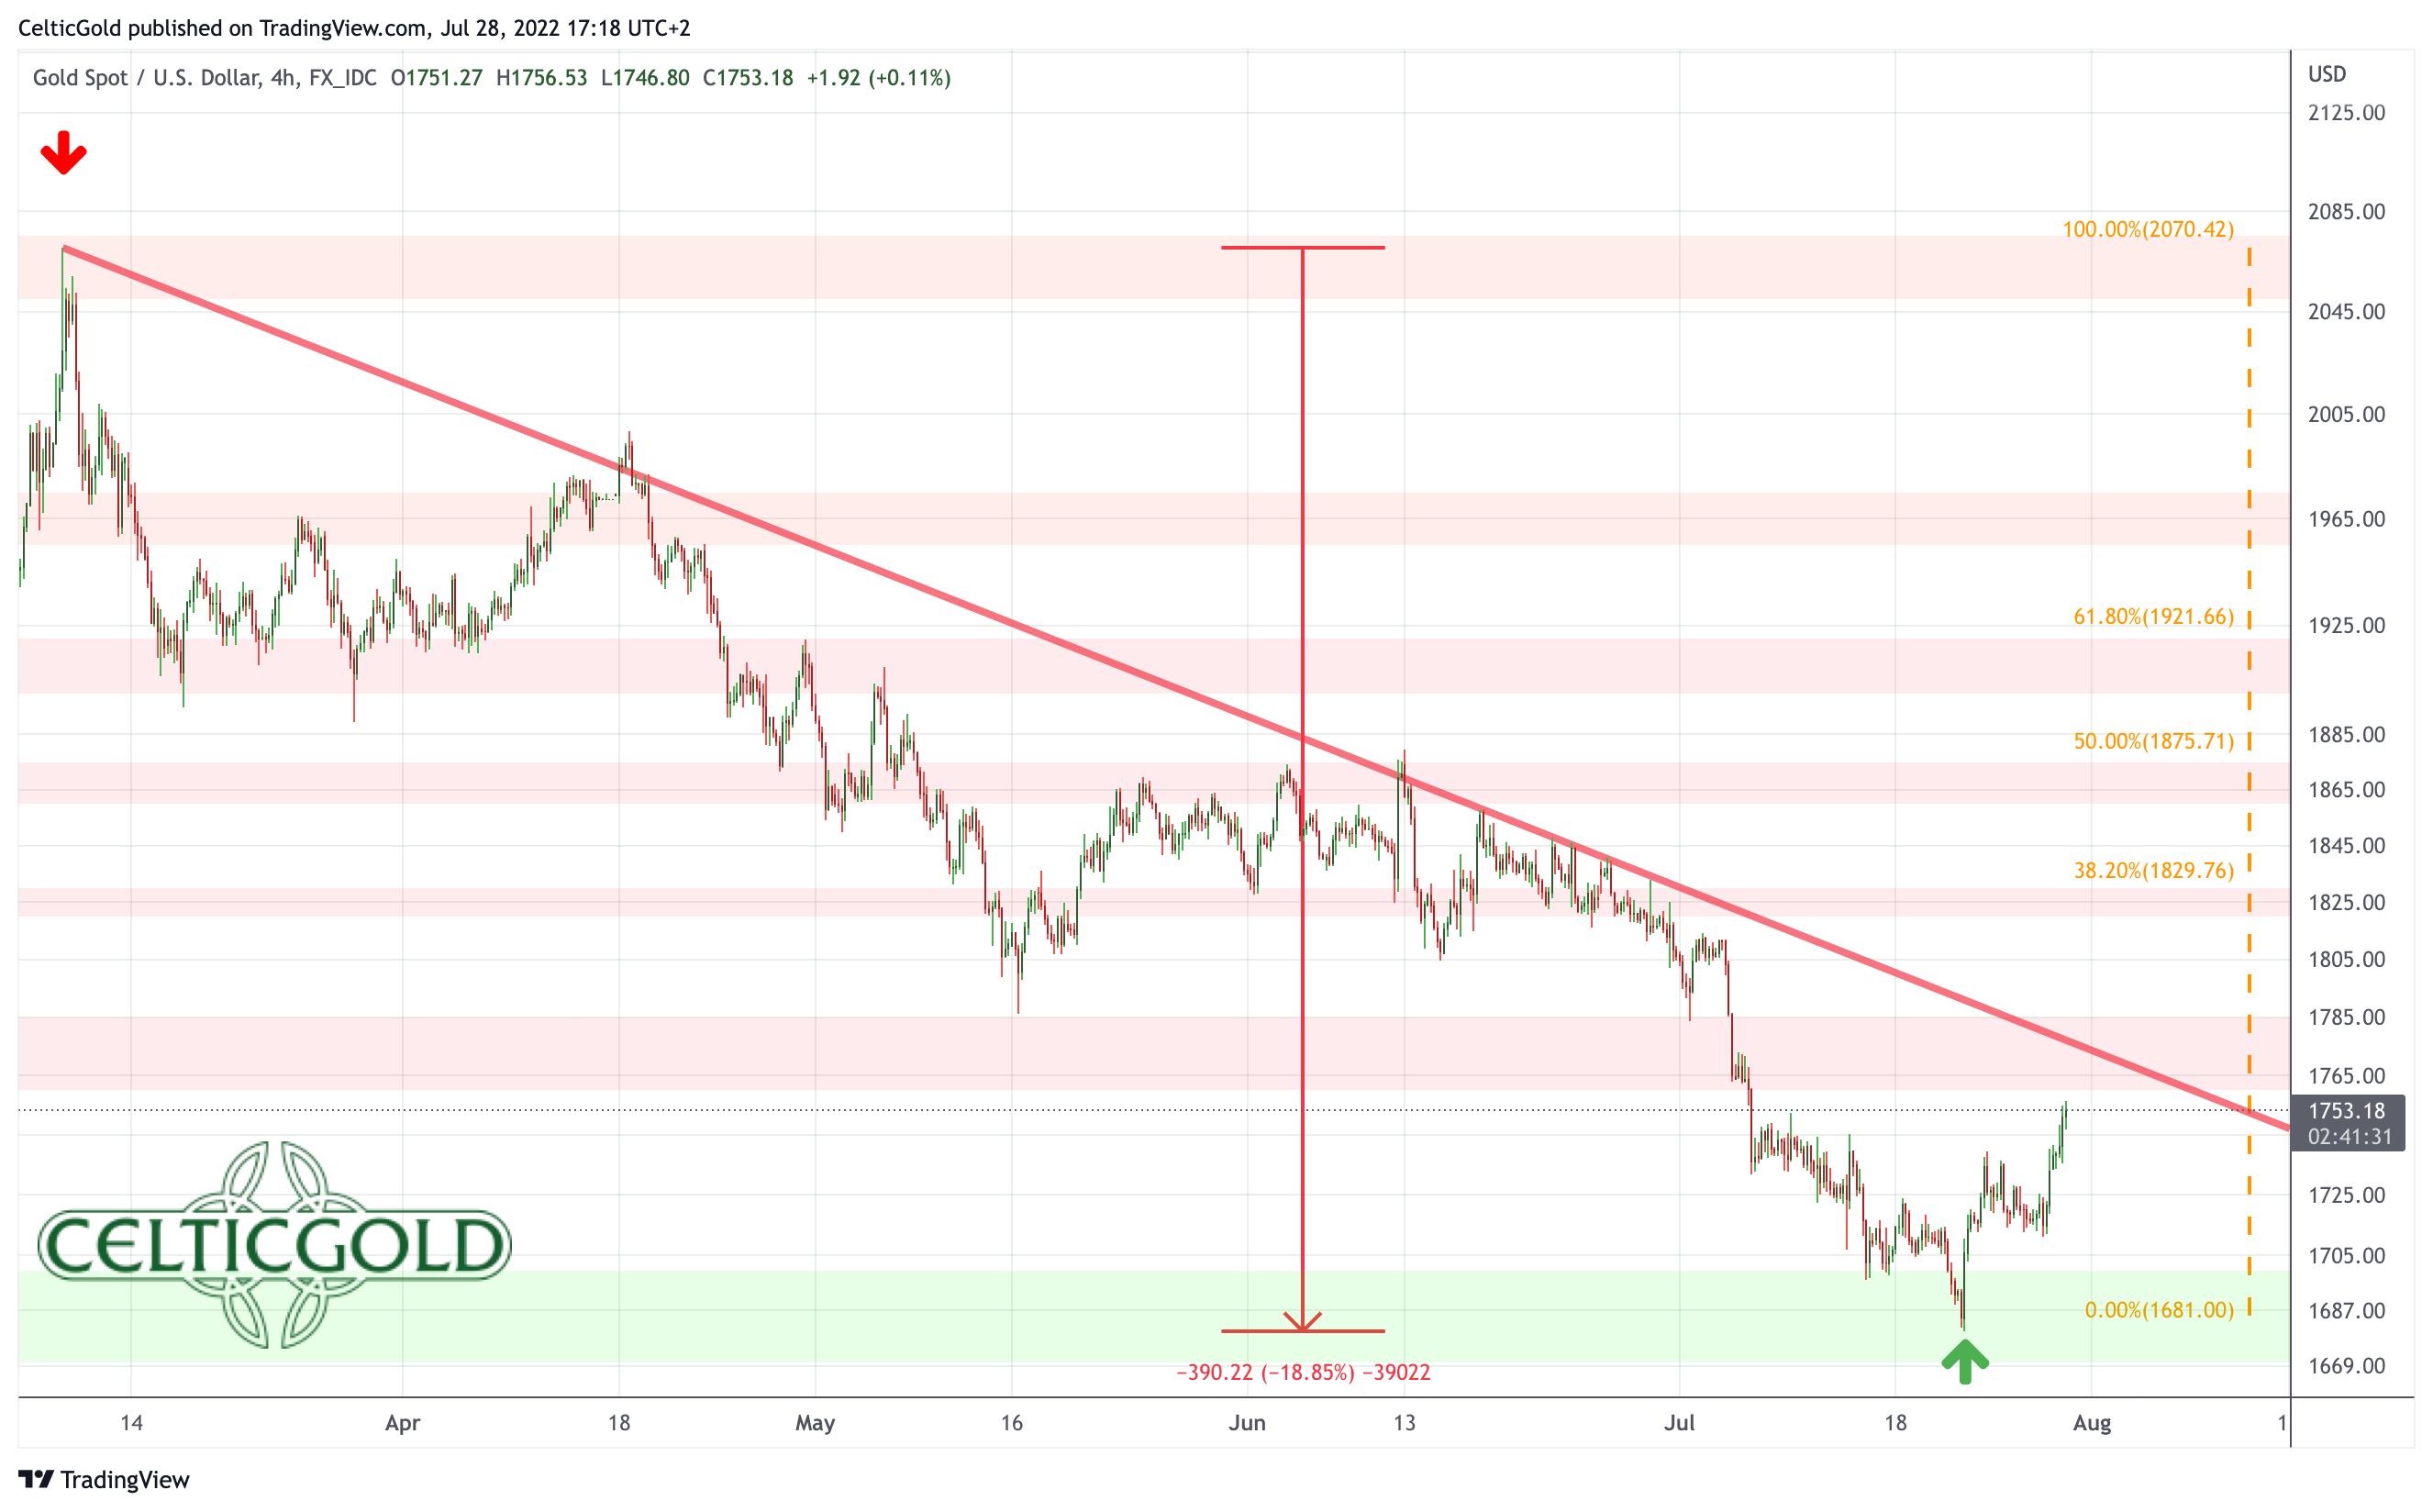 *Gold in USD, 4-hour chart as of July 28th, 2022. Source: Tradingview* Besides the clearly overbought situation and the euphoric sentiment in March combined with the fact that precious metals are already within a correction since August 2020, the toxic mix of interest rate hikes & quantitative tightening of U.S. monetary policy, as well as high inflation data and collapsing stock & crypto markets, and thus a rampant recession, were primarily responsible for this selling pressure and the nasty downward spiral, which unfolded in the gold market. More and more investors plagued by the stock and crypto crash were thus forced to sell their physical precious metal holdings in order to access much needed liquidity. The “summer doldrums” we had hoped for have therefore not materialized this year. Rather did gold opt for our alternative scenario, which was a further price slide. After all, however, gold was able to recover quite impulsively over the last week and touched 1,750 USD this morning. Hence, yesterday’s FOMC meeting seems to have amplified a wave of short covering in the gold market. This could very likely develop into the typical summer rally over the coming one to three months, at least. ### Technical Analysis: Gold in US-Dollar #### Weekly Chart – At the upper edge of the 4-year uptrend channel 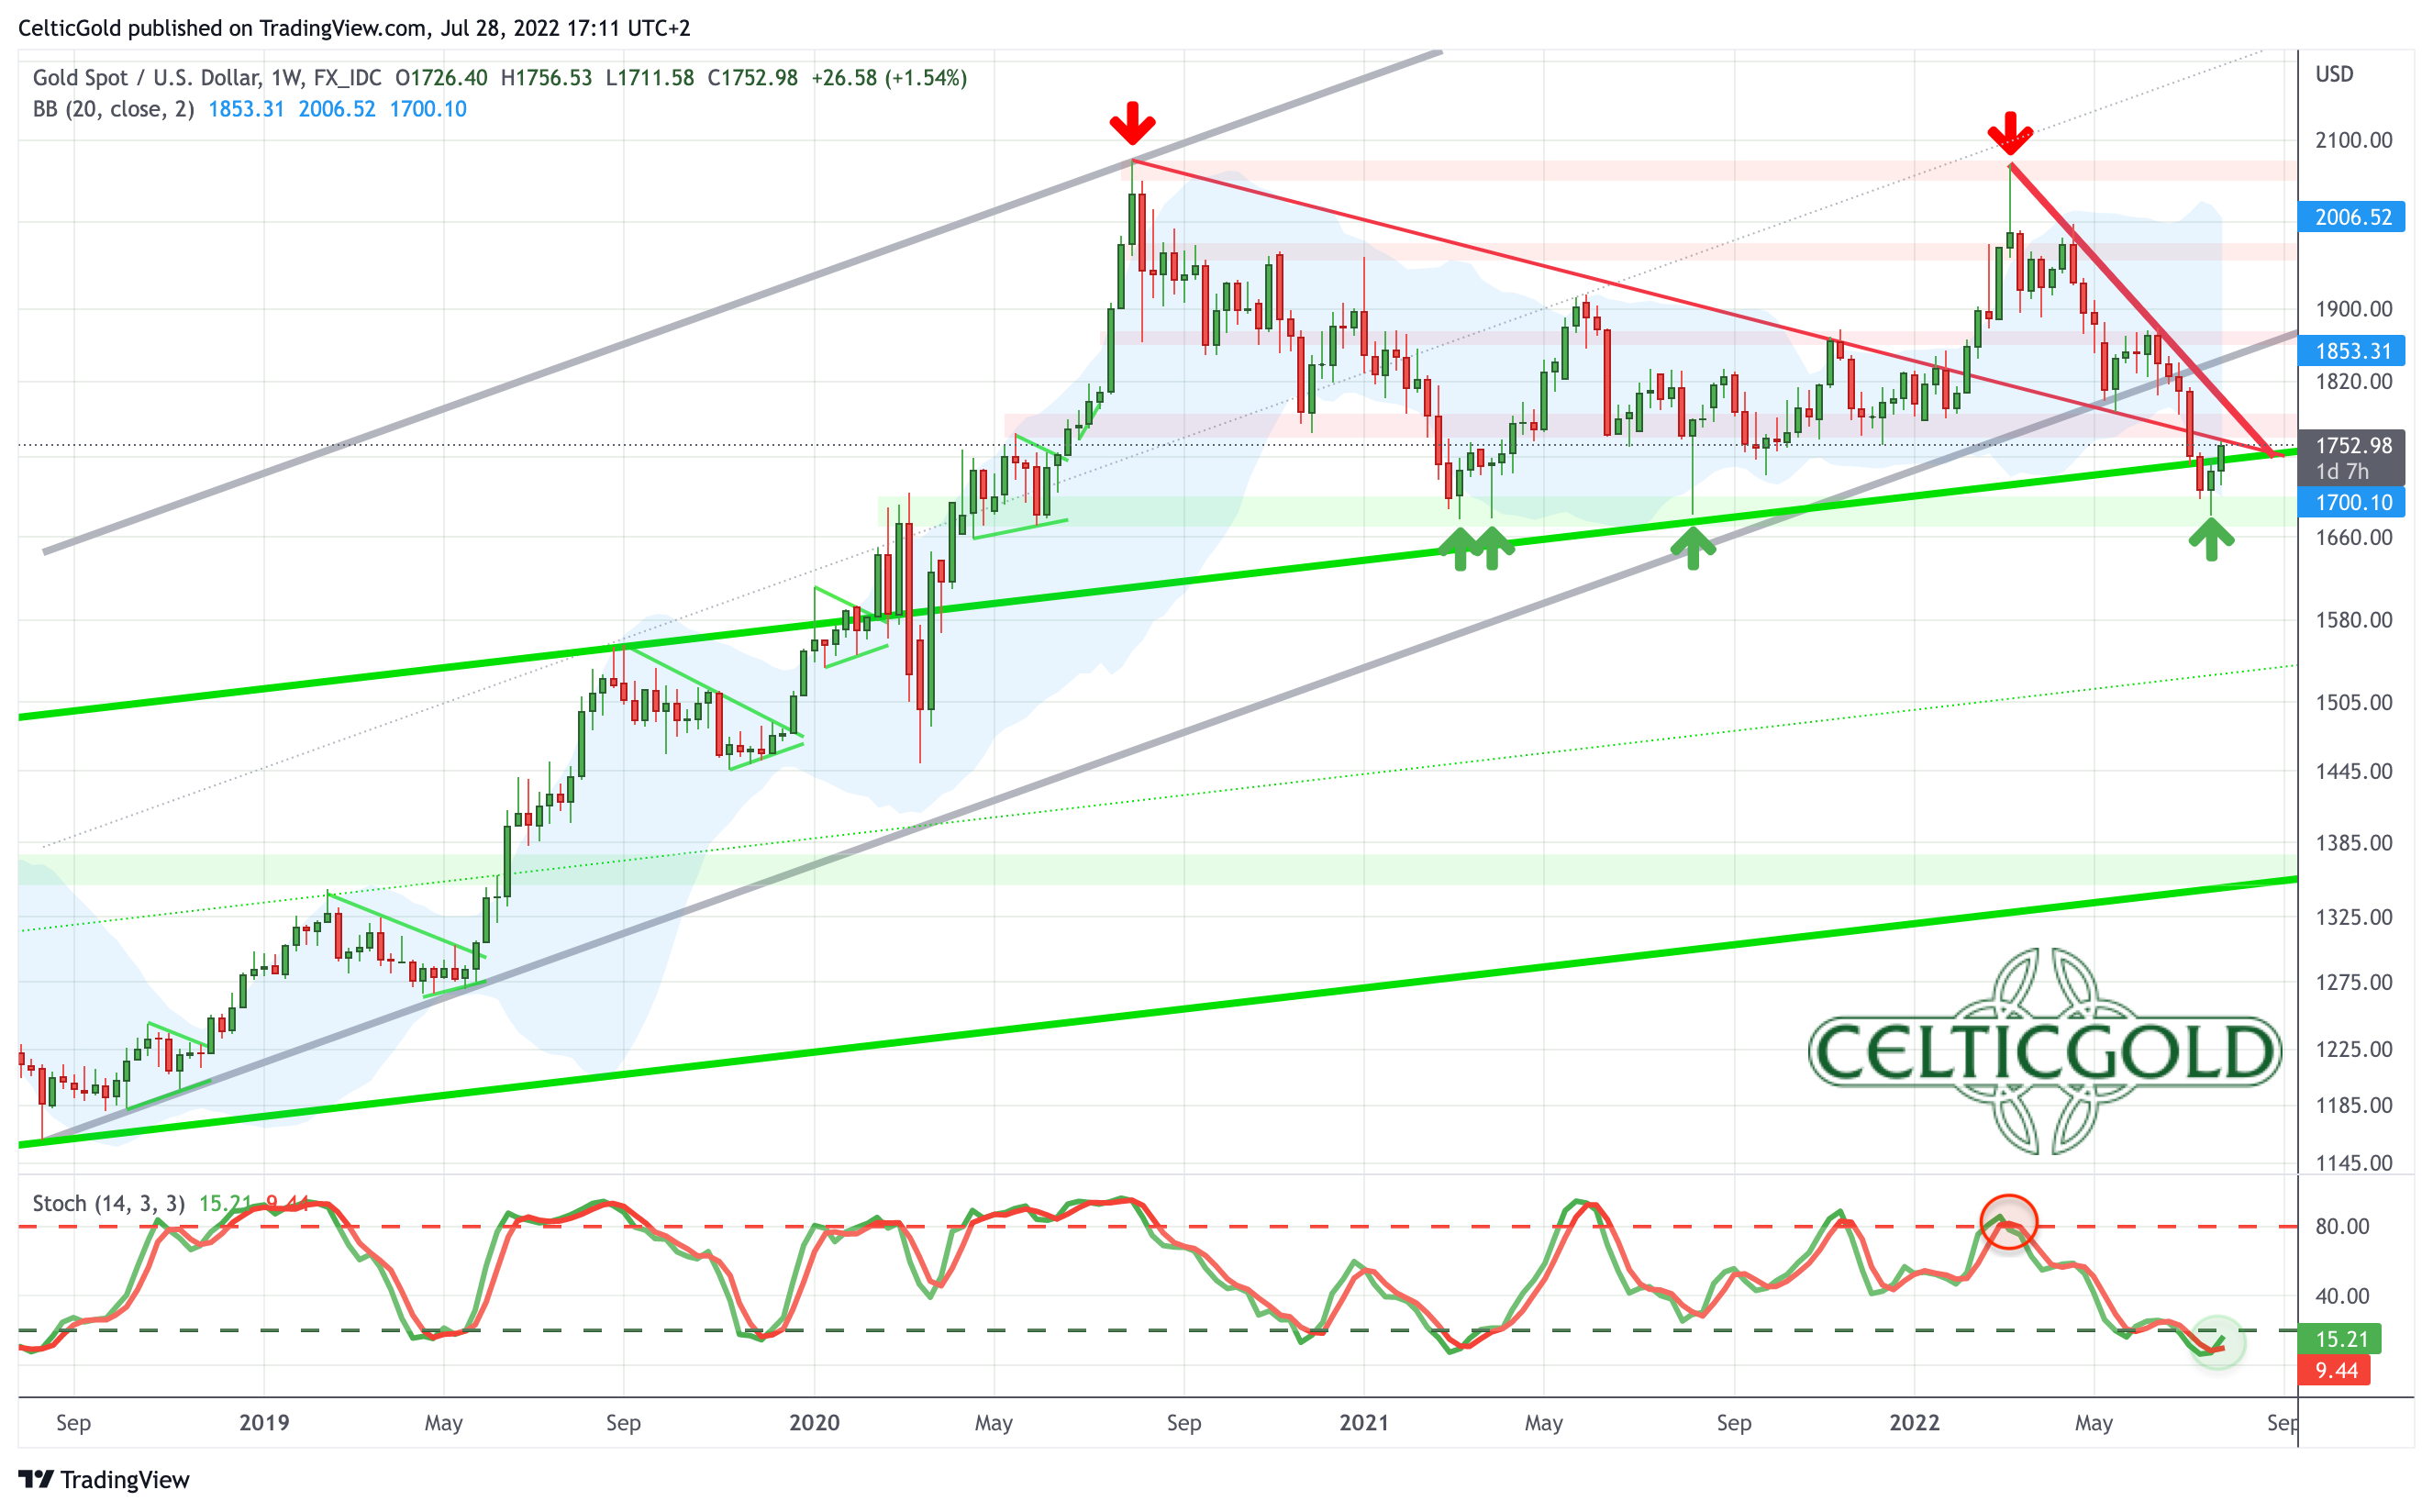 *Gold in US-Dollars, weekly chart as of July 28th, 2022. Source: Tradingview* On the weekly chart, gold corrected mercilessly over the last three and a half months. Finally, prices even dropped slightly below the upper edge of the flat uptrend channel established since August 2018 (in green). Only here, at the triple bottom (1,678 USD) from last year, gold bulls managed to stabilize the price action. And judging from a candlestick perspective, those last two green candles signaling a reversal. On top, the strongly oversold stochastic oscillator looks pretty promising. The oscillator has a lot of room for a strong rally lasting several weeks to several months. However, there is no clear “buying signal” yet from the weekly oscillator. Overall, the weekly chart is still in a downtrend. A clear trend reversal is not yet present. But a stabilization is definitely succeeding. If this is indeed a sustainable bottom, a bounce or even a strong recovery should make up quite some ground in the coming two to three months. #### Daily Chart – Stochastic buy signal 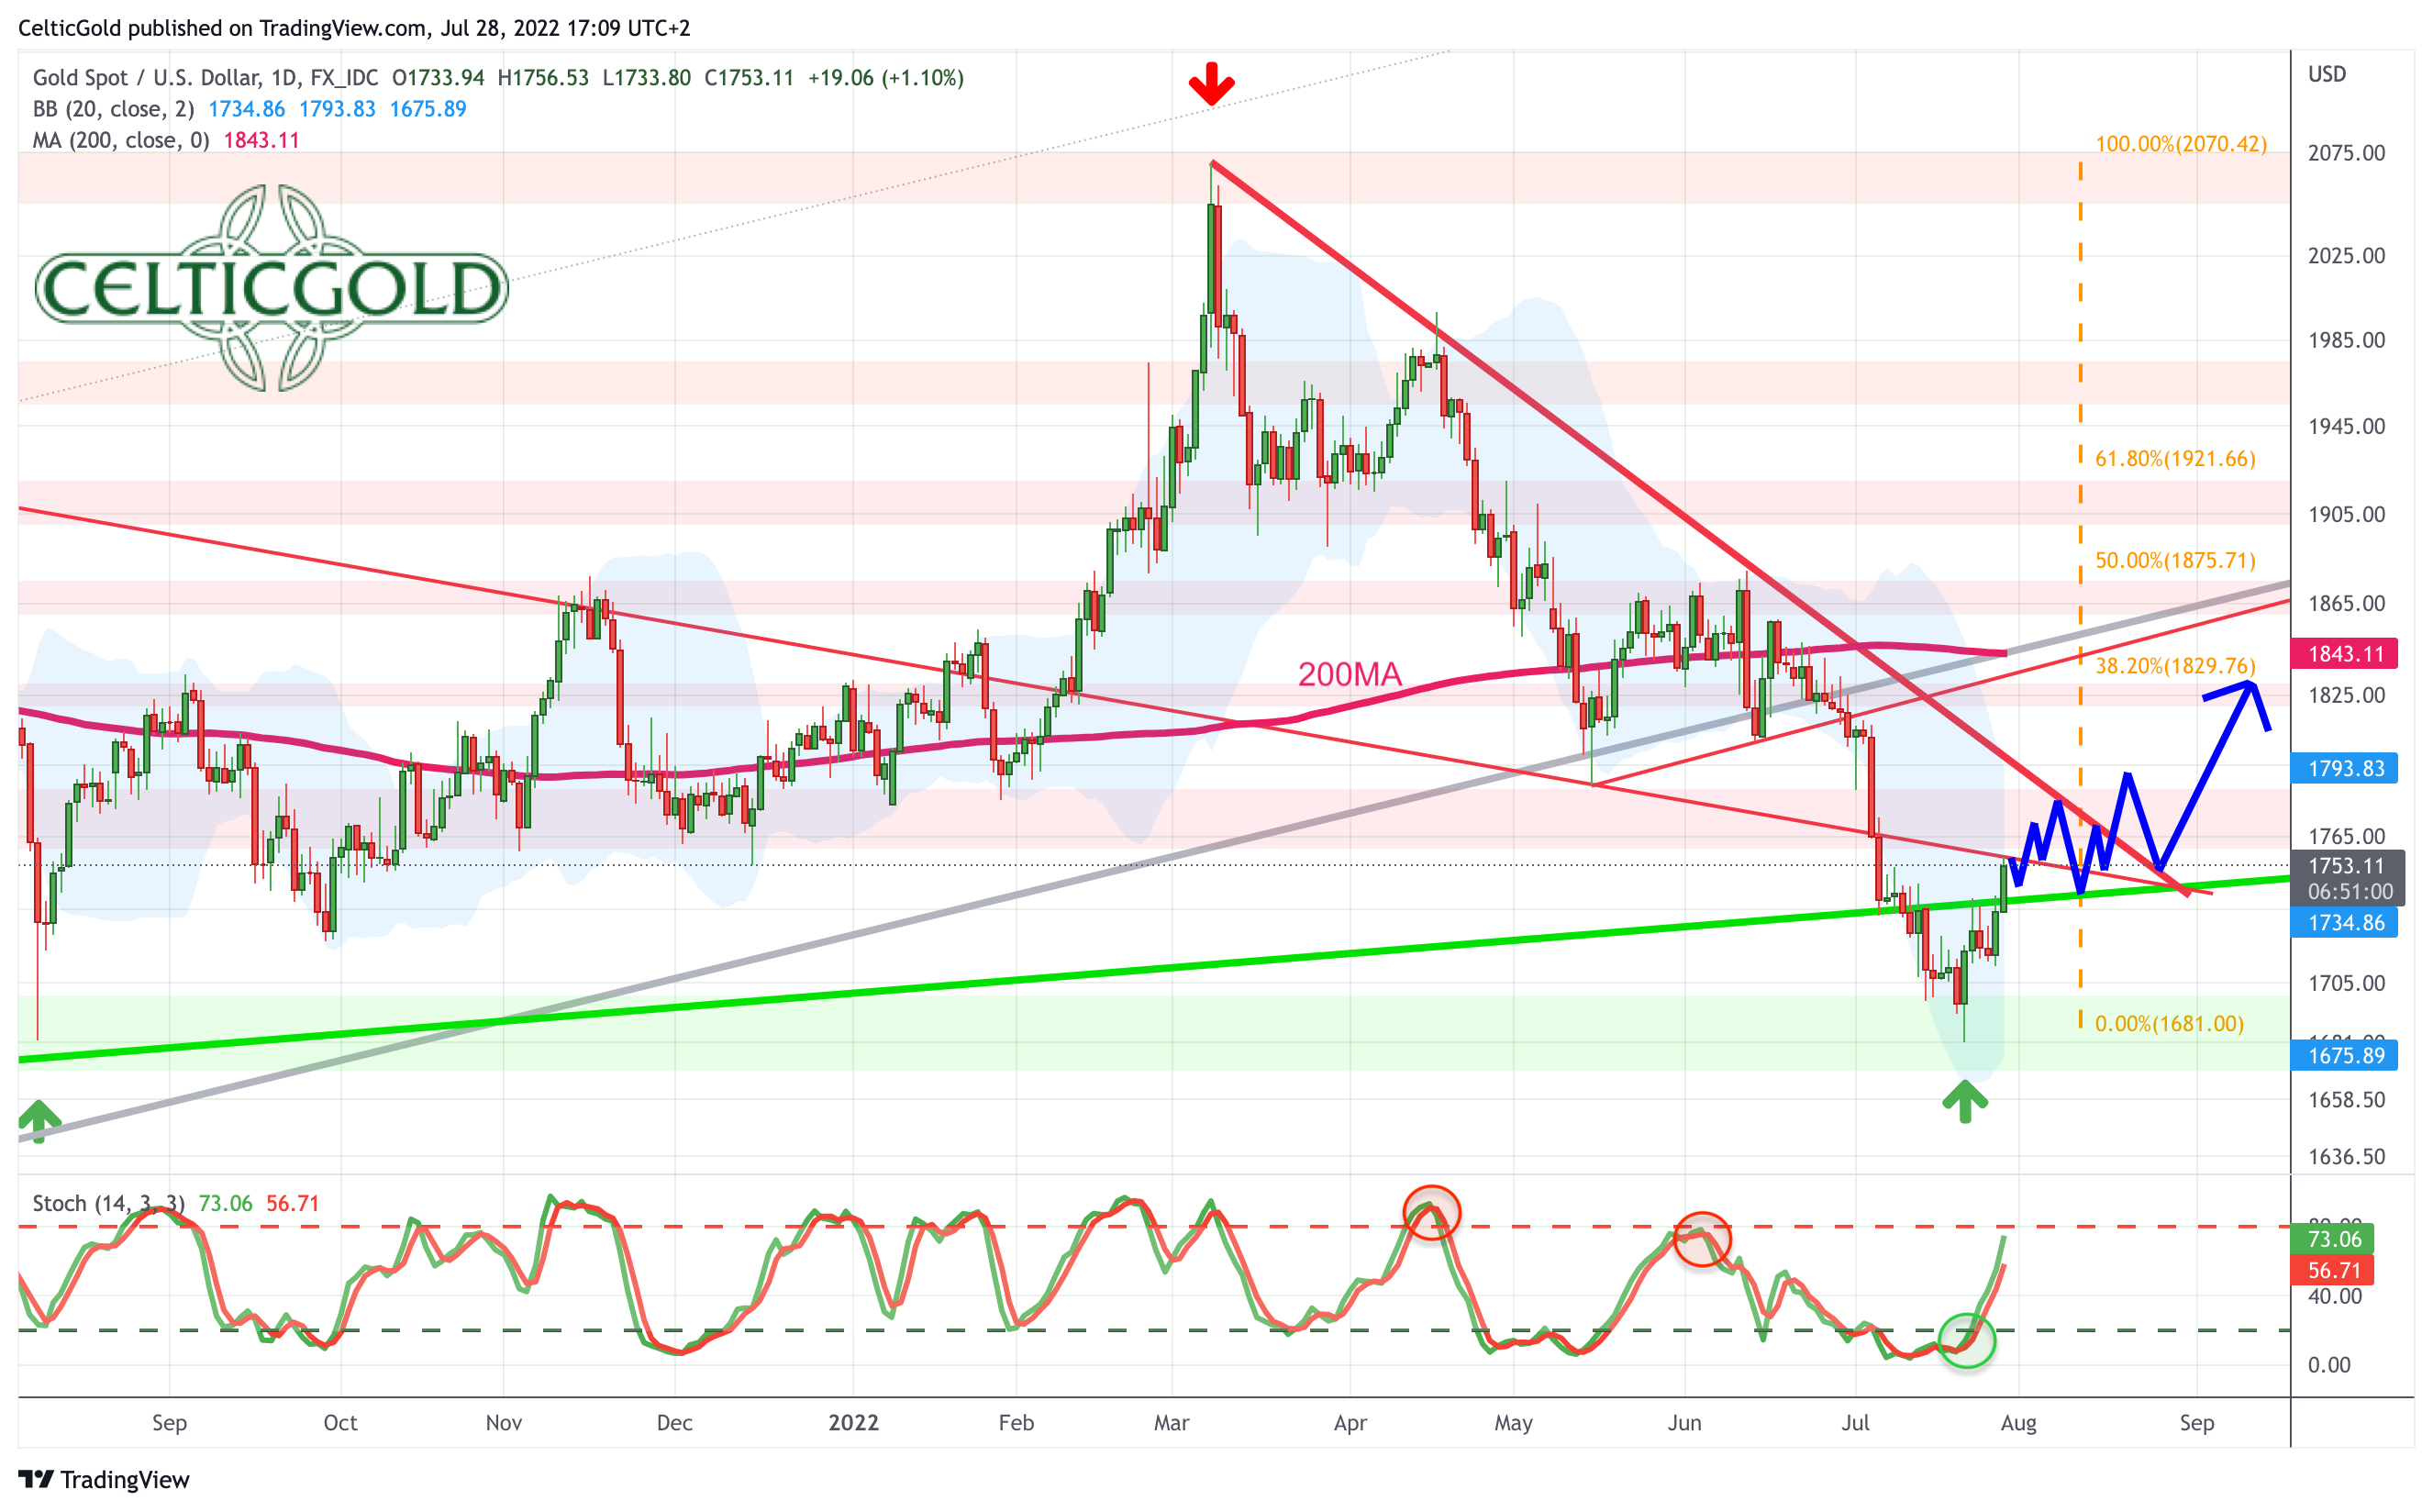 *Gold in US-Dollars, daily chart as of July 28th, 2022. Source: Tradingview* On the daily chart, the trend reversal is clearly visible. Since the low at 1,681 USD, gold is up more than 70 USD. This confirms our assumption that the bottom is in, and that gold has started some form of a recovery, at least. Now, the falling 200-day moving average (1,842 USD) will act as magnet and likely attract prices towards approx. 1,830 USD. Exactly here would also wait the 38.2% retracement of the entire wave down since March, which typically represents the minimum target of a countertrend move. All in all, the daily chart has been bullish for a week now and still provides a buy signal. However, the way up is paved with strong resistances. Around 1,755 to 1,760 USD, an older downtrend line is waiting. Here also begins the well-known resistance zone between 1,750 and 1,785 USD. Even stronger resistance is likely to come from the downtrend line of the last three and a half months (currently around 1,800 USD and falling fast). Below 1,700 USD and especially below 1,680 USD, however, the sell-off continues. In that unlikely case, prices around 1,625 USD must be expected. ### Commitments of Traders for Gold – Summer rally has started 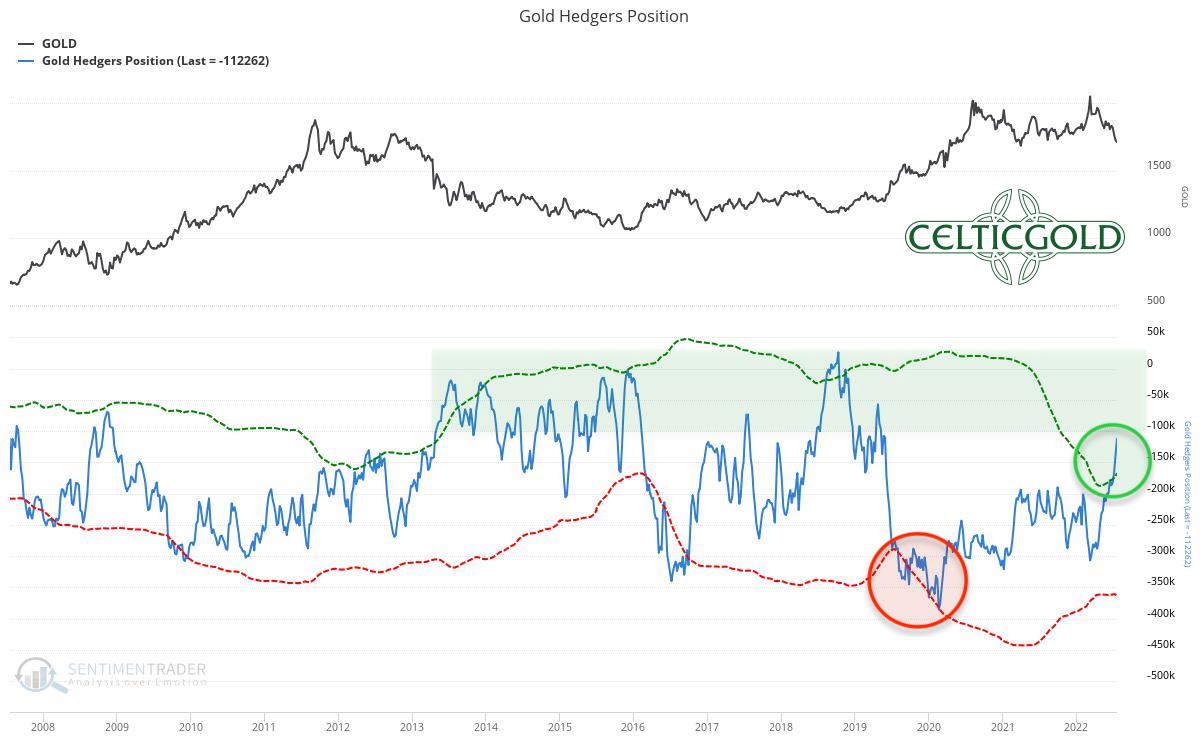 *Commitments of Traders for Gold as of July 25th, 2022. Source: Sentimentrader* Over the last four weeks, the cumulative net short position of the commercial market participants has dropped by another 66,307 contracts to “only” 112,262 gold contracts sold short. The commercial net short position is thus just slightly above the threshold of 100,000 short contracts, at which one can speak of a positive or bullish gold CoT report. In other words, professional market participants see less and less need to hedge against a falling gold price but are increasingly switching to the buy side due to the low gold prices. In summary, the CoT report can be classified as cautiously bullish. ### Sentiment for Gold – Summer rally has started 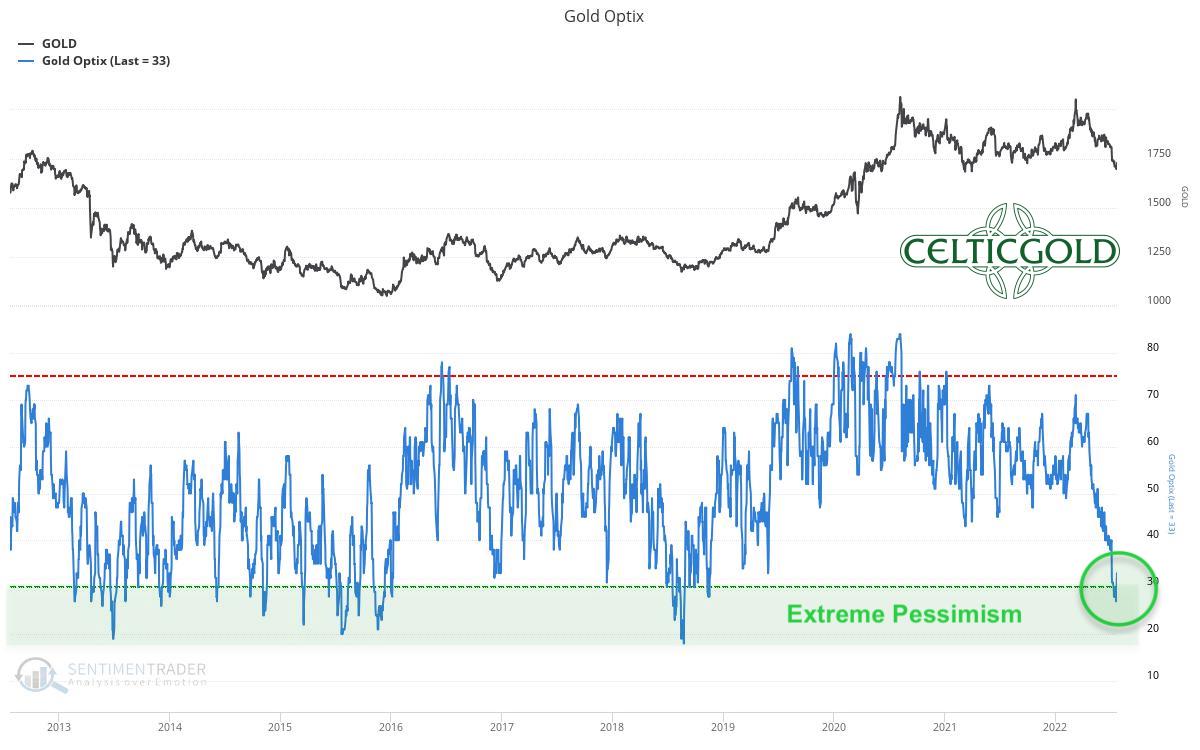 *Sentiment Optix for Gold as of July 25th, 2022. Source: Sentimentrader* The latest sentiment data for gold measure an extremely pessimistic sentiment for the first time since the fall of 2018! For almost four years, patient gold bugs had to wait for this promising contrarian setup! 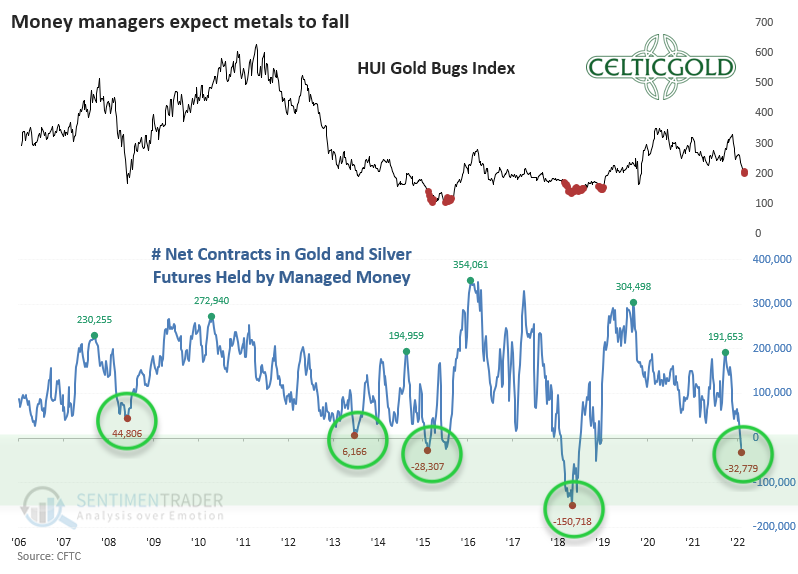 *Gold & Silver future contracts held by managed money as of July 25th, 2022. Source: Sentimentrader* Not surprisingly, asset managers currently hold the lowest cumulative number of gold and silver futures contracts in their client portfolios since August 2018, and this is the second-lowest positioning in a long-term comparison over the past 16 years. This low allocation is evidence of a very negative expectation for precious metals prices. Overall, the “sentiment traffic light” is now green and provides a contrarian buy signal! ### Seasonality for Gold – Summer rally has started 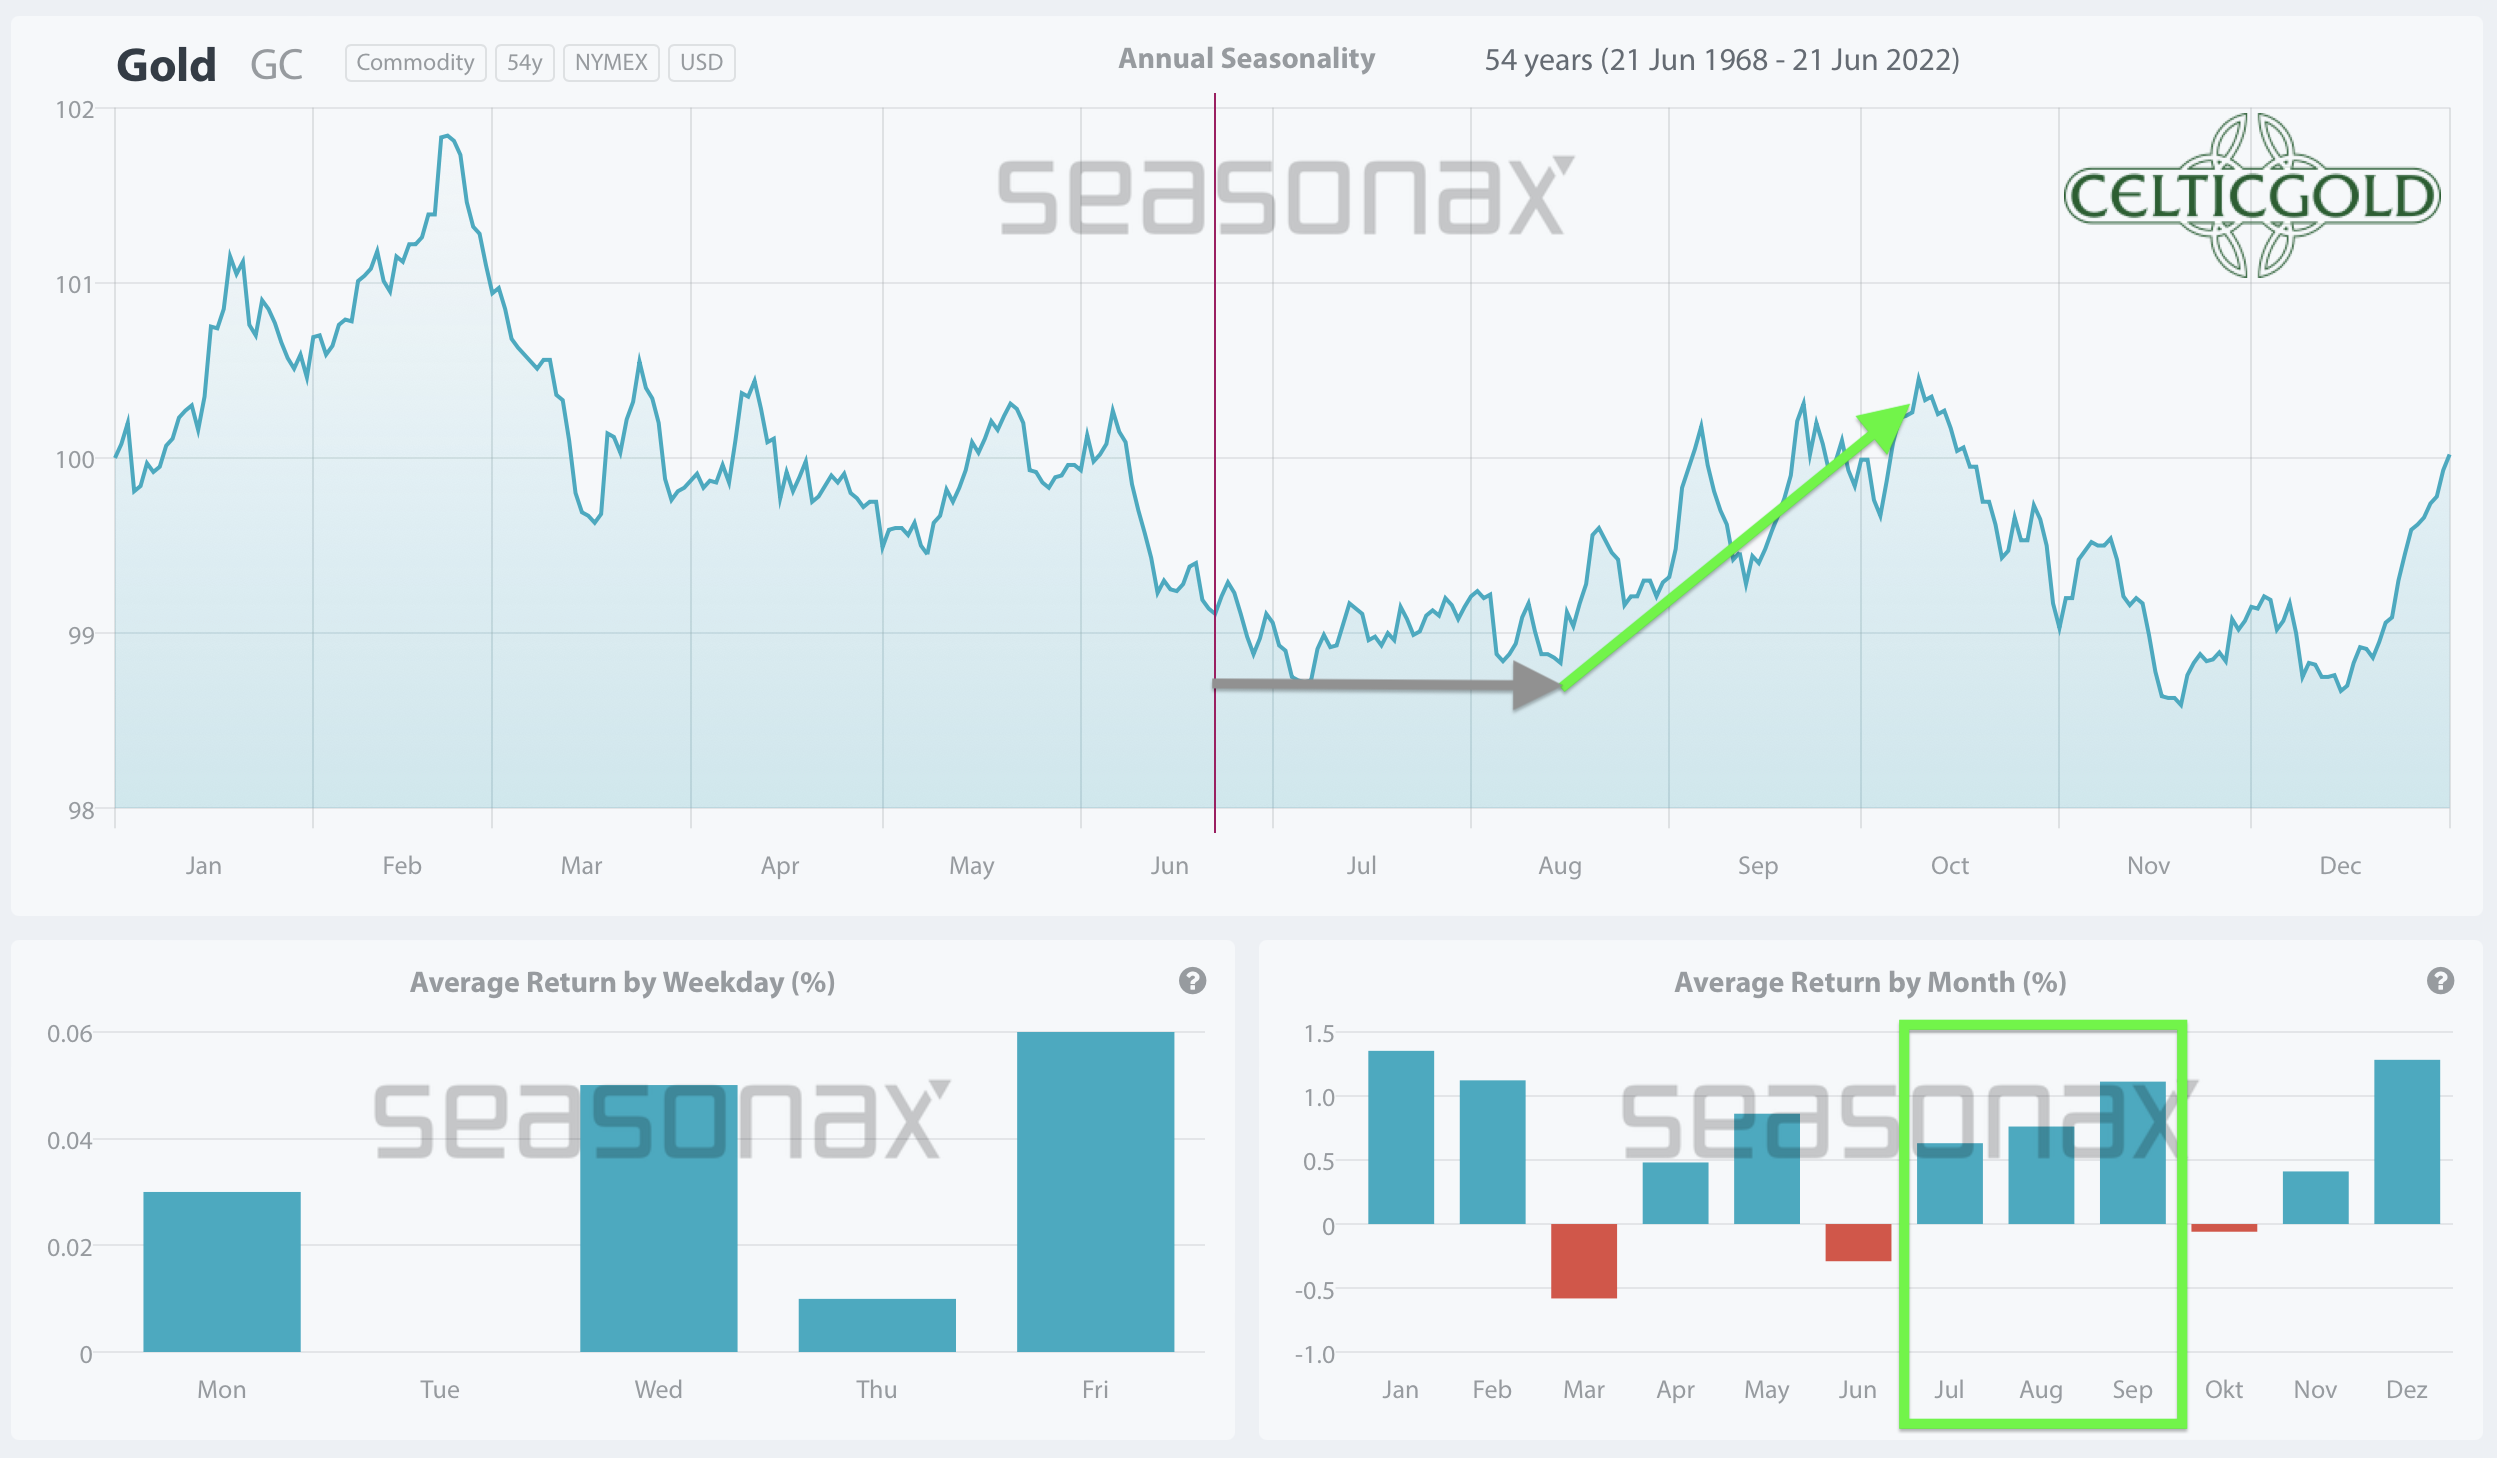 *Seasonality for Gold over the last 53-years as of June 22nd, 2022. Source: Seasonax* From a seasonal perspective, gold is about to begin its typical summer rally, which statistically has usually caused precious metal prices to rise sharply in August and September over the past 54 years. Seasonality for gold and silver is strongly bullish from now on until early October. ### Macro update: Panic, recession, and stagflation Ever since the financial crisis of 2008, all central banks have been gradually providing the banking system and thus the entire financial system with huge amounts of additional liquidity through low interest rates and “quantitative easing”. This was intended to counteract deflation. Since the beginning of the Corona crisis, the U.S. Federal Reserve had once again significantly increased its holdings of government and mortgage bonds by 120 billion USD every month. However, after central bankers had long refused to acknowledge the resulting sharp rise in inflation, there have been no excuses since the official inflation rate topped 6-8% since the beginning of this year. Accordingly, the U.S. Federal Reserve had ended its bond purchases in March 2022 and announced its intention to reduce its balance sheet, which now weighs almost 9 trillion USD. Among other things, the monthly proceeds of up to 30 billion USD from maturing government bonds and up to 17.5 billion USD from maturing mortgage-backed securities were no longer to be reinvested from June 1st. Whether central bankers will succeed in a measured and slow exit from their ultra-soft monetary policy is anyone’s guess. So far, at any rate, the financial markets have reacted like a “junkie in withdrawal” to the change in central bank policy over the past seven months. 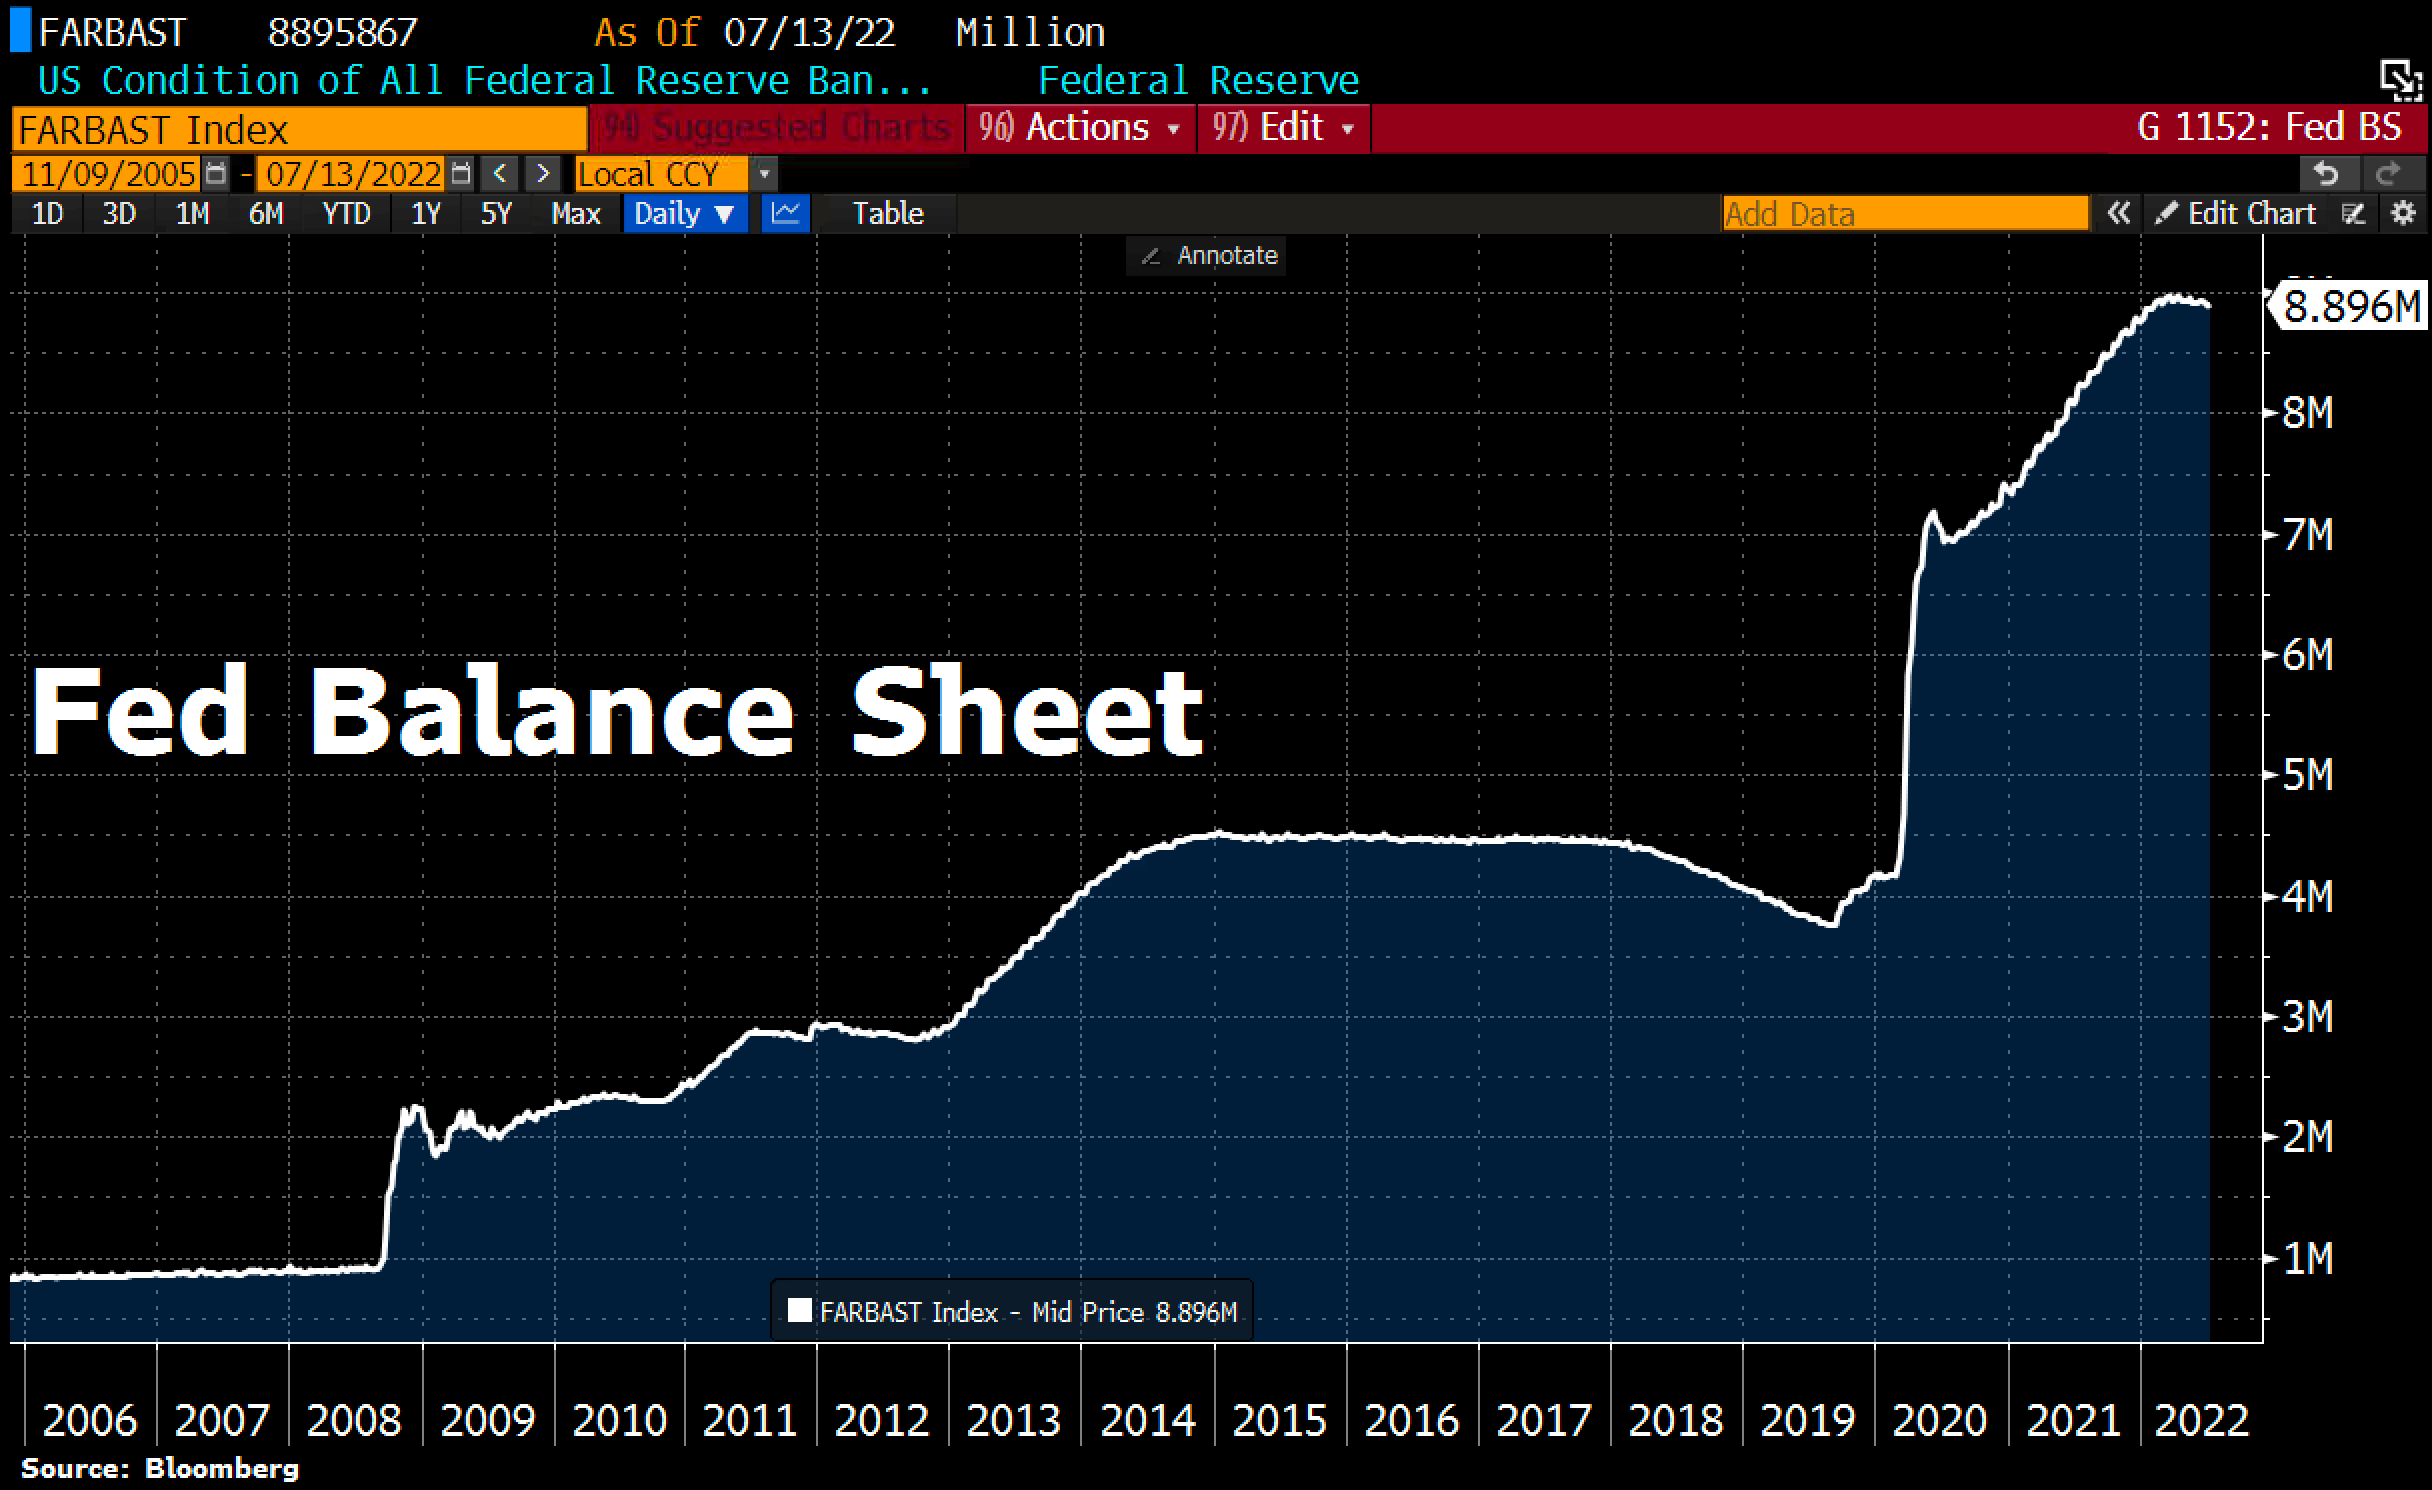 *FED Balance Sheet Total as of July 13th , 2022, ©Holger Zschaepitz* According to the official data released as of July 13th, the Fed has therefore already stopped shrinking its balance sheet again, as total assets increased by 4 billion USD to 8.896 billion USD as of July 13th. The Fed’s balance sheet now represents 36.5% of U.S. GDP, compared to 82% for the ECB and 135% for the BoJ. 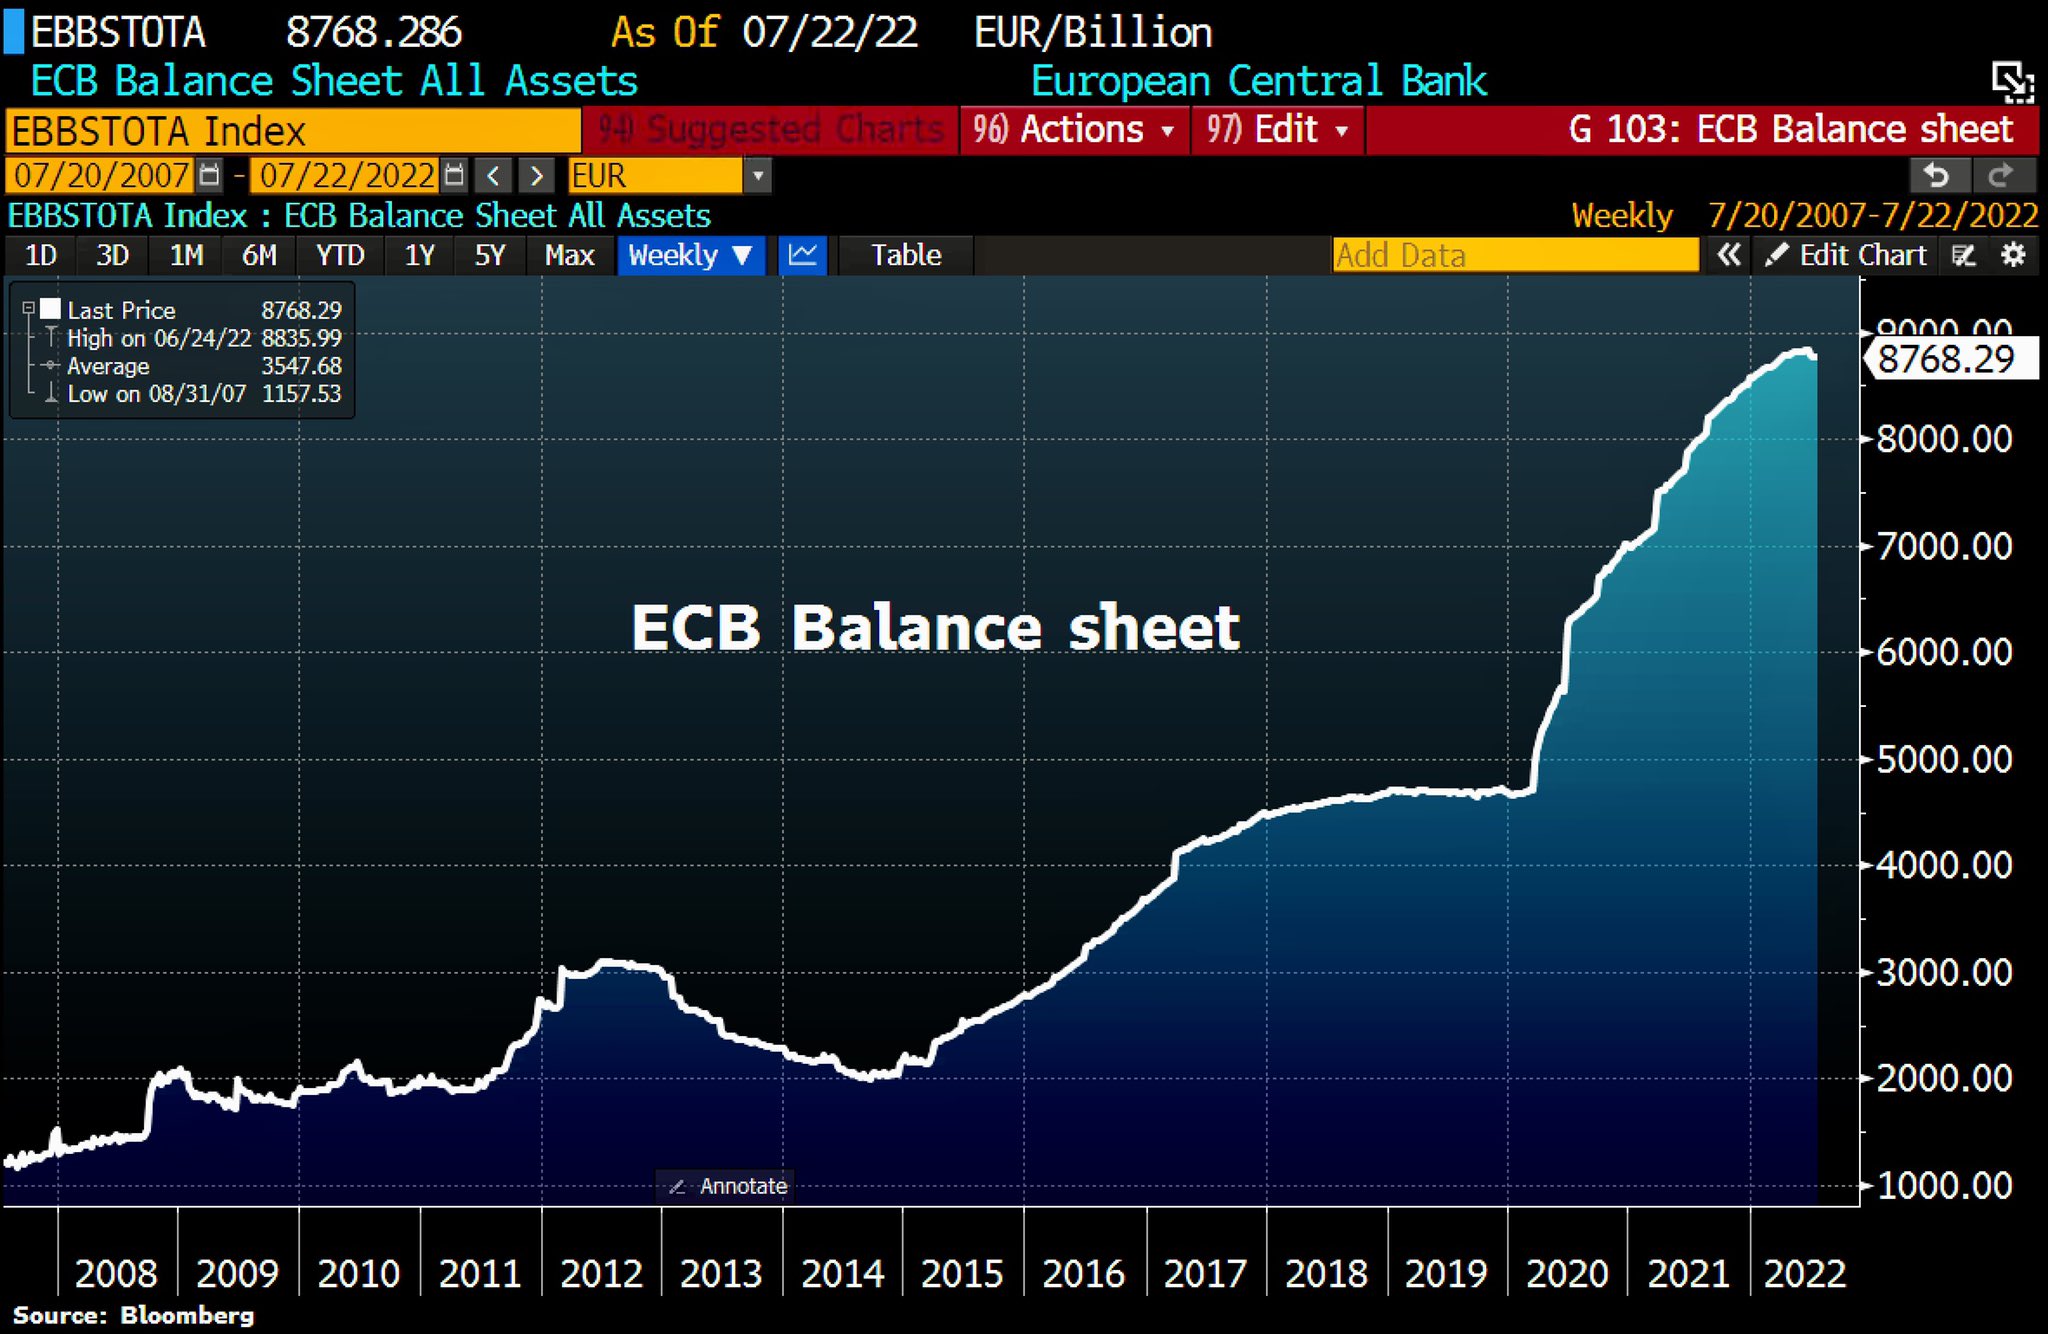 *ECB Balance Sheet Total as of July 22nd , 2022, ©Holger Zschaepitz* And the ECB’s balance sheet has also grown again recently after three weeks of contraction. Total assets rose by 2.6 billion EUR last week to 8,769.3 billion EUR. This means that the ECB balance sheet is still close to its all-time high and is now equivalent to 82% of eurozone GDP. In any case, the damage to the global economy has already been done and will likely worsen in the coming months, as the recession increasingly reaches the real economy after more than seven months of falling stock prices. Not only have valuations of almost all companies dropped significantly, but layoffs are on the rise and pay raises, bonuses and job offers are being canceled. In addition, start-ups are finding it very difficult, if at all, to obtain financing. Real estate markets have also long since peaked, with asking prices already falling and demand for mortgages lower than at any time since 2000. Home sales are currently declining most sharply for the cheapest properties, as potential buyers here are more price-conscious and generally more affected by changes in interest rates. But luxury home sales also fell nearly 18% between February and May. I.e., the Fed will hardly be able to raise interest rates any further into the fall without completely destroying the economy. But at the same time, inflation will remain elevated, so the stagflationary environment will continue to tighten. These are excellent conditions for a rising gold price. However, commodities and precious metals typically come under significant pressure in the early stages of an economic slowdown. This is exactly what has happened now. At the latest, when the U.S. Federal Reserve has to pivot back to a loose stance as well as quantitative easing and interest rate cuts next year, gold prices will very likely break out to new all-time highs. ### Conclusion: Gold – Summer rally has started With a buy signal on the daily chart, a bombed-out sentiment and the very favorable seasonal component, there are currently three strong arguments on the table for an imminent summer rally in the gold market. The completely oversold weekly chart and the quite constructive CoT report also support this thesis. However, the financial markets have been in a contraction à la 2008 for months, which has dragged down all asset classes. Calling a bottom early on can be dangerous in this environment. Nevertheless, the chances of a summer recovery to around 1,830 USD are very good. Higher recovery targets are also conceivable. In the short term it is important that the bottom is confirmed, and that gold can continue its recovery towards approx. 1,770 to 1,775 USD, where a breather for one to three weeks can be expected. _Analysis sponsored and initially published on July 27th, 2022, by [www.celticgold.eu](https://celticgold.de/blog/gold-und-bitcoin-analysen-von-florian-grummes-32/gold-sommerrally-kann-beginnen-184). Translated into English and partially updated on July 28th, 2022._ _Feel free to join us in our free [Telegram channel](https://t.me/MidasTouchConsulting) for daily real time data and a great community._ _If you like to get regular updates on our gold model, precious metals, commodities, and cryptocurrencies you can subscribe to our [free newsletter](http://bit.ly/1EUdt2K)._ _Disclosure: This article and the content are for informational purposes only and do not contain investment advice or recommendations. Every investment and trading move involves risk, and readers should conduct their own research when making a decision. The views, thoughts and opinions expressed here are the author’s alone. They do not necessarily reflect or represent the views and opinions of Midas Touch Consulting._ |
| json metadata | {"tags":["silvergoldstackers","steemsilvergold","leofinance","gold","preciousmetals","trading","investing","inflation"],"image":["https://cdn.steemitimages.com/DQmTuxCfYepzkx31kFWAo7aRRsbSBP7cZCcrjdyL4jq2zxW/blog-header-gold-celticgold.jpg","https://cdn.steemitimages.com/DQmP9ht3LnwjepUYUdzmQDWX5ayuYRizVUo1QXXeFWwRqcn/Chart%2001%20Gold%20in%20USD%204-hour%20chart%20280722.png","https://cdn.steemitimages.com/DQmfJbi5V6Kdjmb1xPwymCgNS1e3ku7AJc6QDGSuid9jDFN/Chart%2002%20Gold%20in%20USD%20weekly%20chart%20280722.png","https://cdn.steemitimages.com/DQmaLiKG5L5Eks7DZ3FKbig9hN64frctTTwAvtsXNYESsq9/Chart%2003%20Gold%20in%20USD%20daily%20chart%20280722.png","https://cdn.steemitimages.com/DQmZ2MAuy9UEXJTxQFe62QQ2vQ9PXsc5ngEUHjmFYc7Drww/Chart%2004%20Gold%20Hedgers%20Position%20250722.jpeg","https://cdn.steemitimages.com/DQmf6m9nU5TTsfv6g91sWoGewKZADR5AAdd8rFEesBMq684/Chart%2005%20Gold%20Sentiment%20250722.jpeg","https://cdn.steemitimages.com/DQmeJM9ENBwnxs7MiqMXt5d95rMrWdBzsZUSLVXhkmEpVLK/Chart%2006%20Managed%20Money%20Net%20Contracts%20in%20Gold%20&%20Silver%20250722.png","https://cdn.steemitimages.com/DQmcGf8EEpG14uKD7f814XjLrojLW6vQQyXu41yGQ11XeSE/Chart%2007%20Gold%20Seasonality%20220622.png","https://cdn.steemitimages.com/DQmNZjipuphpnNwecGwKSQKRRmNbrfNzY7PunwhTNV8iZ5r/Chart%2008%20Fed%20Balance%20Sheet%2016072022.png","https://cdn.steemitimages.com/DQmZ2JgPm8dtJSU6huQJ6b4VmqTzJ1yKFWttttfUGpE1imp/Chart%2009%20ECB%20Balance%20Sheet%2026072022.jpeg"],"links":["https://www.midastouch-consulting.com/14072022-bitcoin-relief-rally-in-the-summer","https://celticgold.de/blog/gold-und-bitcoin-analysen-von-florian-grummes-32/gold-sommerrally-kann-beginnen-184","https://t.me/MidasTouchConsulting","http://bit.ly/1EUdt2K"],"app":"steemit/0.2","format":"markdown"} |
| parent author | |
| parent permlink | silvergoldstackers |
| permlink | july-28th-2022-gold-summer-rally-has-started |
| title | July 28th, 2022: Gold – Summer rally has started |
| Transaction Info | Block #66327866/Trx 1b46504295b015d10ac4945a1db6011ad1fb4d54 |
View Raw JSON Data
{
"block": 66327866,
"op": [
"comment",
{
"author": "midastouch",
"body": "\n# [July 28th, 2022: Gold – Summer rally has started](https://www.midastouch-consulting.com/14072022-bitcoin-relief-rally-in-the-summer)\n\nIt’s been three and half tough months for gold and silver investors. Stockmarket and crypto investors have been suffering since November 2021 already, though. Now, after a bloodbath of almost 400 USD in the gold market, last week’s reversal looks promising. Gold – Summer rally has started.\n\n### Review\n\nGold prices reached an important high on March 8th, 2022, at around 2,070 USD and have since then slid into a brutal sell-off over the course of the last three and a half months. The final low of this wave down has been seen on Thursday, 21st of July, at 1,681 USD. Thus, gold has lost almost 400 USD or 18.8% in a rather short period of time.\n\n\n*Gold in USD, 4-hour chart as of July 28th, 2022. Source: Tradingview*\n\nBesides the clearly overbought situation and the euphoric sentiment in March combined with the fact that precious metals are already within a correction since August 2020, the toxic mix of interest rate hikes & quantitative tightening of U.S. monetary policy, as well as high inflation data and collapsing stock & crypto markets, and thus a rampant recession, were primarily responsible for this selling pressure and the nasty downward spiral, which unfolded in the gold market. More and more investors plagued by the stock and crypto crash were thus forced to sell their physical precious metal holdings in order to access much needed liquidity.\n\nThe “summer doldrums” we had hoped for have therefore not materialized this year. Rather did gold opt for our alternative scenario, which was a further price slide. After all, however, gold was able to recover quite impulsively over the last week and touched 1,750 USD this morning. Hence, yesterday’s FOMC meeting seems to have amplified a wave of short covering in the gold market. This could very likely develop into the typical summer rally over the coming one to three months, at least.\n\n### Technical Analysis: Gold in US-Dollar\n\n#### Weekly Chart – At the upper edge of the 4-year uptrend channel\n\n\n*Gold in US-Dollars, weekly chart as of July 28th, 2022. Source: Tradingview*\n\nOn the weekly chart, gold corrected mercilessly over the last three and a half months. Finally, prices even dropped slightly below the upper edge of the flat uptrend channel established since August 2018 (in green). Only here, at the triple bottom (1,678 USD) from last year, gold bulls managed to stabilize the price action. And judging from a candlestick perspective, those last two green candles signaling a reversal. On top, the strongly oversold stochastic oscillator looks pretty promising. The oscillator has a lot of room for a strong rally lasting several weeks to several months. However, there is no clear “buying signal” yet from the weekly oscillator.\n\nOverall, the weekly chart is still in a downtrend. A clear trend reversal is not yet present. But a stabilization is definitely succeeding. If this is indeed a sustainable bottom, a bounce or even a strong recovery should make up quite some ground in the coming two to three months.\n\n#### Daily Chart – Stochastic buy signal\n\n\n*Gold in US-Dollars, daily chart as of July 28th, 2022. Source: Tradingview*\n\nOn the daily chart, the trend reversal is clearly visible. Since the low at 1,681 USD, gold is up more than 70 USD. This confirms our assumption that the bottom is in, and that gold has started some form of a recovery, at least. Now, the falling 200-day moving average (1,842 USD) will act as magnet and likely attract prices towards approx. 1,830 USD. Exactly here would also wait the 38.2% retracement of the entire wave down since March, which typically represents the minimum target of a countertrend move.\n\nAll in all, the daily chart has been bullish for a week now and still provides a buy signal. However, the way up is paved with strong resistances. Around 1,755 to 1,760 USD, an older downtrend line is waiting. Here also begins the well-known resistance zone between 1,750 and 1,785 USD. Even stronger resistance is likely to come from the downtrend line of the last three and a half months (currently around 1,800 USD and falling fast). Below 1,700 USD and especially below 1,680 USD, however, the sell-off continues. In that unlikely case, prices around 1,625 USD must be expected.\n\n### Commitments of Traders for Gold – Summer rally has started\n\n\n*Commitments of Traders for Gold as of July 25th, 2022. Source: Sentimentrader*\n\nOver the last four weeks, the cumulative net short position of the commercial market participants has dropped by another 66,307 contracts to “only” 112,262 gold contracts sold short. The commercial net short position is thus just slightly above the threshold of 100,000 short contracts, at which one can speak of a positive or bullish gold CoT report. In other words, professional market participants see less and less need to hedge against a falling gold price but are increasingly switching to the buy side due to the low gold prices.\n\nIn summary, the CoT report can be classified as cautiously bullish.\n\n### Sentiment for Gold – Summer rally has started\n\n\n*Sentiment Optix for Gold as of July 25th, 2022. Source: Sentimentrader*\n\nThe latest sentiment data for gold measure an extremely pessimistic sentiment for the first time since the fall of 2018! For almost four years, patient gold bugs had to wait for this promising contrarian setup!\n\n\n*Gold & Silver future contracts held by managed money as of July 25th, 2022. Source: Sentimentrader*\n\nNot surprisingly, asset managers currently hold the lowest cumulative number of gold and silver futures contracts in their client portfolios since August 2018, and this is the second-lowest positioning in a long-term comparison over the past 16 years. This low allocation is evidence of a very negative expectation for precious metals prices.\n\nOverall, the “sentiment traffic light” is now green and provides a contrarian buy signal!\n\n### Seasonality for Gold – Summer rally has started\n\n\n*Seasonality for Gold over the last 53-years as of June 22nd, 2022. Source: Seasonax*\n\nFrom a seasonal perspective, gold is about to begin its typical summer rally, which statistically has usually caused precious metal prices to rise sharply in August and September over the past 54 years.\n\nSeasonality for gold and silver is strongly bullish from now on until early October.\n\n### Macro update: Panic, recession, and stagflation\n\nEver since the financial crisis of 2008, all central banks have been gradually providing the banking system and thus the entire financial system with huge amounts of additional liquidity through low interest rates and “quantitative easing”. This was intended to counteract deflation. Since the beginning of the Corona crisis, the U.S. Federal Reserve had once again significantly increased its holdings of government and mortgage bonds by 120 billion USD every month. However, after central bankers had long refused to acknowledge the resulting sharp rise in inflation, there have been no excuses since the official inflation rate topped 6-8% since the beginning of this year.\n\nAccordingly, the U.S. Federal Reserve had ended its bond purchases in March 2022 and announced its intention to reduce its balance sheet, which now weighs almost 9 trillion USD. Among other things, the monthly proceeds of up to 30 billion USD from maturing government bonds and up to 17.5 billion USD from maturing mortgage-backed securities were no longer to be reinvested from June 1st.\n\nWhether central bankers will succeed in a measured and slow exit from their ultra-soft monetary policy is anyone’s guess. So far, at any rate, the financial markets have reacted like a “junkie in withdrawal” to the change in central bank policy over the past seven months.\n\n\n*FED Balance Sheet Total as of July 13th , 2022, ©Holger Zschaepitz*\n\nAccording to the official data released as of July 13th, the Fed has therefore already stopped shrinking its balance sheet again, as total assets increased by 4 billion USD to 8.896 billion USD as of July 13th. The Fed’s balance sheet now represents 36.5% of U.S. GDP, compared to 82% for the ECB and 135% for the BoJ.\n\n\n*ECB Balance Sheet Total as of July 22nd , 2022, ©Holger Zschaepitz*\n\nAnd the ECB’s balance sheet has also grown again recently after three weeks of contraction. Total assets rose by 2.6 billion EUR last week to 8,769.3 billion EUR. This means that the ECB balance sheet is still close to its all-time high and is now equivalent to 82% of eurozone GDP.\n\nIn any case, the damage to the global economy has already been done and will likely worsen in the coming months, as the recession increasingly reaches the real economy after more than seven months of falling stock prices. Not only have valuations of almost all companies dropped significantly, but layoffs are on the rise and pay raises, bonuses and job offers are being canceled. In addition, start-ups are finding it very difficult, if at all, to obtain financing.\n\nReal estate markets have also long since peaked, with asking prices already falling and demand for mortgages lower than at any time since 2000. Home sales are currently declining most sharply for the cheapest properties, as potential buyers here are more price-conscious and generally more affected by changes in interest rates. But luxury home sales also fell nearly 18% between February and May.\n\nI.e., the Fed will hardly be able to raise interest rates any further into the fall without completely destroying the economy. But at the same time, inflation will remain elevated, so the stagflationary environment will continue to tighten. These are excellent conditions for a rising gold price. However, commodities and precious metals typically come under significant pressure in the early stages of an economic slowdown. This is exactly what has happened now. At the latest, when the U.S. Federal Reserve has to pivot back to a loose stance as well as quantitative easing and interest rate cuts next year, gold prices will very likely break out to new all-time highs.\n\n### Conclusion: Gold – Summer rally has started\n\nWith a buy signal on the daily chart, a bombed-out sentiment and the very favorable seasonal component, there are currently three strong arguments on the table for an imminent summer rally in the gold market. The completely oversold weekly chart and the quite constructive CoT report also support this thesis. However, the financial markets have been in a contraction à la 2008 for months, which has dragged down all asset classes. Calling a bottom early on can be dangerous in this environment.\n\nNevertheless, the chances of a summer recovery to around 1,830 USD are very good. Higher recovery targets are also conceivable. In the short term it is important that the bottom is confirmed, and that gold can continue its recovery towards approx. 1,770 to 1,775 USD, where a breather for one to three weeks can be expected.\n\n_Analysis sponsored and initially published on July 27th, 2022, by [www.celticgold.eu](https://celticgold.de/blog/gold-und-bitcoin-analysen-von-florian-grummes-32/gold-sommerrally-kann-beginnen-184). Translated into English and partially updated on July 28th, 2022._ \n\n_Feel free to join us in our free [Telegram channel](https://t.me/MidasTouchConsulting) for daily real time data and a great community._ _If you like to get regular updates on our gold model, precious metals, commodities, and cryptocurrencies you can subscribe to our [free newsletter](http://bit.ly/1EUdt2K)._ \n\n_Disclosure: This article and the content are for informational purposes only and do not contain investment advice or recommendations. Every investment and trading move involves risk, and readers should conduct their own research when making a decision. The views, thoughts and opinions expressed here are the author’s alone. They do not necessarily reflect or represent the views and opinions of Midas Touch Consulting._",
"json_metadata": "{\"tags\":[\"silvergoldstackers\",\"steemsilvergold\",\"leofinance\",\"gold\",\"preciousmetals\",\"trading\",\"investing\",\"inflation\"],\"image\":[\"https://cdn.steemitimages.com/DQmTuxCfYepzkx31kFWAo7aRRsbSBP7cZCcrjdyL4jq2zxW/blog-header-gold-celticgold.jpg\",\"https://cdn.steemitimages.com/DQmP9ht3LnwjepUYUdzmQDWX5ayuYRizVUo1QXXeFWwRqcn/Chart%2001%20Gold%20in%20USD%204-hour%20chart%20280722.png\",\"https://cdn.steemitimages.com/DQmfJbi5V6Kdjmb1xPwymCgNS1e3ku7AJc6QDGSuid9jDFN/Chart%2002%20Gold%20in%20USD%20weekly%20chart%20280722.png\",\"https://cdn.steemitimages.com/DQmaLiKG5L5Eks7DZ3FKbig9hN64frctTTwAvtsXNYESsq9/Chart%2003%20Gold%20in%20USD%20daily%20chart%20280722.png\",\"https://cdn.steemitimages.com/DQmZ2MAuy9UEXJTxQFe62QQ2vQ9PXsc5ngEUHjmFYc7Drww/Chart%2004%20Gold%20Hedgers%20Position%20250722.jpeg\",\"https://cdn.steemitimages.com/DQmf6m9nU5TTsfv6g91sWoGewKZADR5AAdd8rFEesBMq684/Chart%2005%20Gold%20Sentiment%20250722.jpeg\",\"https://cdn.steemitimages.com/DQmeJM9ENBwnxs7MiqMXt5d95rMrWdBzsZUSLVXhkmEpVLK/Chart%2006%20Managed%20Money%20Net%20Contracts%20in%20Gold%20&%20Silver%20250722.png\",\"https://cdn.steemitimages.com/DQmcGf8EEpG14uKD7f814XjLrojLW6vQQyXu41yGQ11XeSE/Chart%2007%20Gold%20Seasonality%20220622.png\",\"https://cdn.steemitimages.com/DQmNZjipuphpnNwecGwKSQKRRmNbrfNzY7PunwhTNV8iZ5r/Chart%2008%20Fed%20Balance%20Sheet%2016072022.png\",\"https://cdn.steemitimages.com/DQmZ2JgPm8dtJSU6huQJ6b4VmqTzJ1yKFWttttfUGpE1imp/Chart%2009%20ECB%20Balance%20Sheet%2026072022.jpeg\"],\"links\":[\"https://www.midastouch-consulting.com/14072022-bitcoin-relief-rally-in-the-summer\",\"https://celticgold.de/blog/gold-und-bitcoin-analysen-von-florian-grummes-32/gold-sommerrally-kann-beginnen-184\",\"https://t.me/MidasTouchConsulting\",\"http://bit.ly/1EUdt2K\"],\"app\":\"steemit/0.2\",\"format\":\"markdown\"}",
"parent_author": "",
"parent_permlink": "silvergoldstackers",
"permlink": "july-28th-2022-gold-summer-rally-has-started",
"title": "July 28th, 2022: Gold – Summer rally has started"
}
],
"op_in_trx": 0,
"timestamp": "2022-07-29T03:56:39",
"trx_id": "1b46504295b015d10ac4945a1db6011ad1fb4d54",
"trx_in_block": 2,
"virtual_op": 0
}midastouchupvoted (100.00%) @pocket-change / rcba022022/07/29 03:53:21
midastouchupvoted (100.00%) @pocket-change / rcba02
2022/07/29 03:53:21
| author | pocket-change |
| permlink | rcba02 |
| voter | midastouch |
| weight | 10000 (100.00%) |
| Transaction Info | Block #66327801/Trx fccb23aedb924a172d75ec018b06a5540c3f8666 |
View Raw JSON Data
{
  "block": 66327801,
  "op": [
    "vote",
    {
      "author": "pocket-change",
      "permlink": "rcba02",
      "voter": "midastouch",
      "weight": 10000
    }
  ],
  "op_in_trx": 0,
  "timestamp": "2022-07-29T03:53:21",
  "trx_id": "fccb23aedb924a172d75ec018b06a5540c3f8666",
  "trx_in_block": 0,
  "virtual_op": 0
}crypto.defragreplied to @midastouch / 20220716t101520715z2022/07/16 10:15:21
crypto.defragreplied to @midastouch / 20220716t101520715z
2022/07/16 10:15:21
| author | crypto.defrag |
| body | Your post was upvoted and resteemed on @crypto.defrag |
| json metadata | {"app":"repv0.1x"} |
| parent author | midastouch |
| parent permlink | july-14th-2022-bitcoin-relief-rally-in-the-summer |
| permlink | 20220716t101520715z |
| title | |
| Transaction Info | Block #65963011/Trx 74bc5a3aa9503551206e27c231da44a75cd98e52 |
View Raw JSON Data
{
  "block": 65963011,
  "op": [
    "comment",
    {
      "author": "crypto.defrag",
      "body": "Your post was upvoted and resteemed on @crypto.defrag",
      "json_metadata": "{\"app\":\"repv0.1x\"}",
      "parent_author": "midastouch",
      "parent_permlink": "july-14th-2022-bitcoin-relief-rally-in-the-summer",
      "permlink": "20220716t101520715z",
      "title": ""
    }
  ],
  "op_in_trx": 0,
  "timestamp": "2022-07-16T10:15:21",
  "trx_id": "74bc5a3aa9503551206e27c231da44a75cd98e52",
  "trx_in_block": 2,
  "virtual_op": 0
}midastouchupvoted (100.00%) @midastouch / july-14th-2022-bitcoin-relief-rally-in-the-summer2022/07/16 10:13:03
midastouchupvoted (100.00%) @midastouch / july-14th-2022-bitcoin-relief-rally-in-the-summer
2022/07/16 10:13:03
| author | midastouch |
| permlink | july-14th-2022-bitcoin-relief-rally-in-the-summer |
| voter | midastouch |
| weight | 10000 (100.00%) |
| Transaction Info | Block #65962965/Trx d3f4eefeaffacda6b19b6d20277402b5bec459b6 |
View Raw JSON Data
{
  "block": 65962965,
  "op": [
    "vote",
    {
      "author": "midastouch",
      "permlink": "july-14th-2022-bitcoin-relief-rally-in-the-summer",
      "voter": "midastouch",
      "weight": 10000
    }
  ],
  "op_in_trx": 0,
  "timestamp": "2022-07-16T10:13:03",
  "trx_id": "d3f4eefeaffacda6b19b6d20277402b5bec459b6",
  "trx_in_block": 1,
  "virtual_op": 0
}crypto.defragupvoted (1.11%) @midastouch / july-14th-2022-bitcoin-relief-rally-in-the-summer2022/07/16 10:10:45
crypto.defragupvoted (1.11%) @midastouch / july-14th-2022-bitcoin-relief-rally-in-the-summer
2022/07/16 10:10:45
| author | midastouch |
| permlink | july-14th-2022-bitcoin-relief-rally-in-the-summer |
| voter | crypto.defrag |
| weight | 111 (1.11%) |
| Transaction Info | Block #65962919/Trx 786b0c96f905dc720c277af2250d472255678791 |
View Raw JSON Data
{
  "block": 65962919,
  "op": [
    "vote",
    {
      "author": "midastouch",
      "permlink": "july-14th-2022-bitcoin-relief-rally-in-the-summer",
      "voter": "crypto.defrag",
      "weight": 111
    }
  ],
  "op_in_trx": 0,
  "timestamp": "2022-07-16T10:10:45",
  "trx_id": "786b0c96f905dc720c277af2250d472255678791",
  "trx_in_block": 7,
  "virtual_op": 0
}midastouchpublished a new post: july-14th-2022-bitcoin-relief-rally-in-the-summer2022/07/16 10:09:03
midastouchpublished a new post: july-14th-2022-bitcoin-relief-rally-in-the-summer
2022/07/16 10:09:03
| author | midastouch |
| body |  # [July 14th, 2022, Bitcoin – Relief rally in the summer?](https://www.midastouch-consulting.com/14072022-bitcoin-relief-rally-in-the-summer) A worldwide asset price meltdown is shaking up the minds of all investors & traders these days. Nothing seems safe anymore and the crypto sector was hit the hardest. Bitcoin – Relief rally in the summer? ### Review With the clear break of the support around 37,500 USD, the sell-off in the crypto sector intensified dramatically from the beginning of May and bitcoin prices plunged to 25,400 USD within just one week. Despite the already heavily oversold situation at that time, only a tentative recovery or countermovement succeeded afterwards, which already found its end at 32,375 USD. Starting June 6th, bears went directly into attack mode and pushed bitcoin prices within just 12 days down to 17,600 USD, the lowest level since December 2020. Following this crash, prices are once again only very slowly and tentatively getting back on their feet. So far, they have only managed to recover to 22,400 USD. The bottom line is that bitcoin has lost almost 75% from its all-time high around 69,000 USD on November 10th, 2021. Ethereum (-81.9%) and the larger altcoins such as Solana (-90%), Polygon (-89.2%), Chainlink (-89.6%), Cardano (-87%) were punished even more severely. The smaller altcoins, however, have almost all lost 90 – 99% across the board. #### Brutal wave of bankruptcies Overall, the crypto sector has been hit hard as the brutal wave of bankruptcies (Lunar, Celsius, Three Arrows Capital, Voyager Digital, BlockFi, Babel Finance, etc.) has been unfolding. The chaotic turmoil has wiped out more than 2 trillion USD in market capitalization and cost thousands of jobs in just a few months. An end to the shakeout is not yet in sight due to the opaque interconnections within the industry and the large number of fraudulent speculators or inexperienced players. When asset prices collapse or a counter-party defaults on a massive loan, the lender’s balance sheets are left with huge holes. The residual liquidation of collateral then leads to even more loans coming due, which leads to further liquidation of collateral. As a result, numerous trading venues have limited or blocked user withdrawals in recent weeks, further drying up liquidity. Retail investors who had trusted these lenders to protect their assets or, in particular, to generate high returns have, in some cases, lost everything. Add to this the fear of a global recession accompanied by the worst inflation in more than 40 years. Despite the huge losses, therefore, the end of the storm may not yet have been seen. ### Technical Analysis For Bitcoin in US-Dollar #### Bitcoin Weekly Chart – Opportunity for a recovery 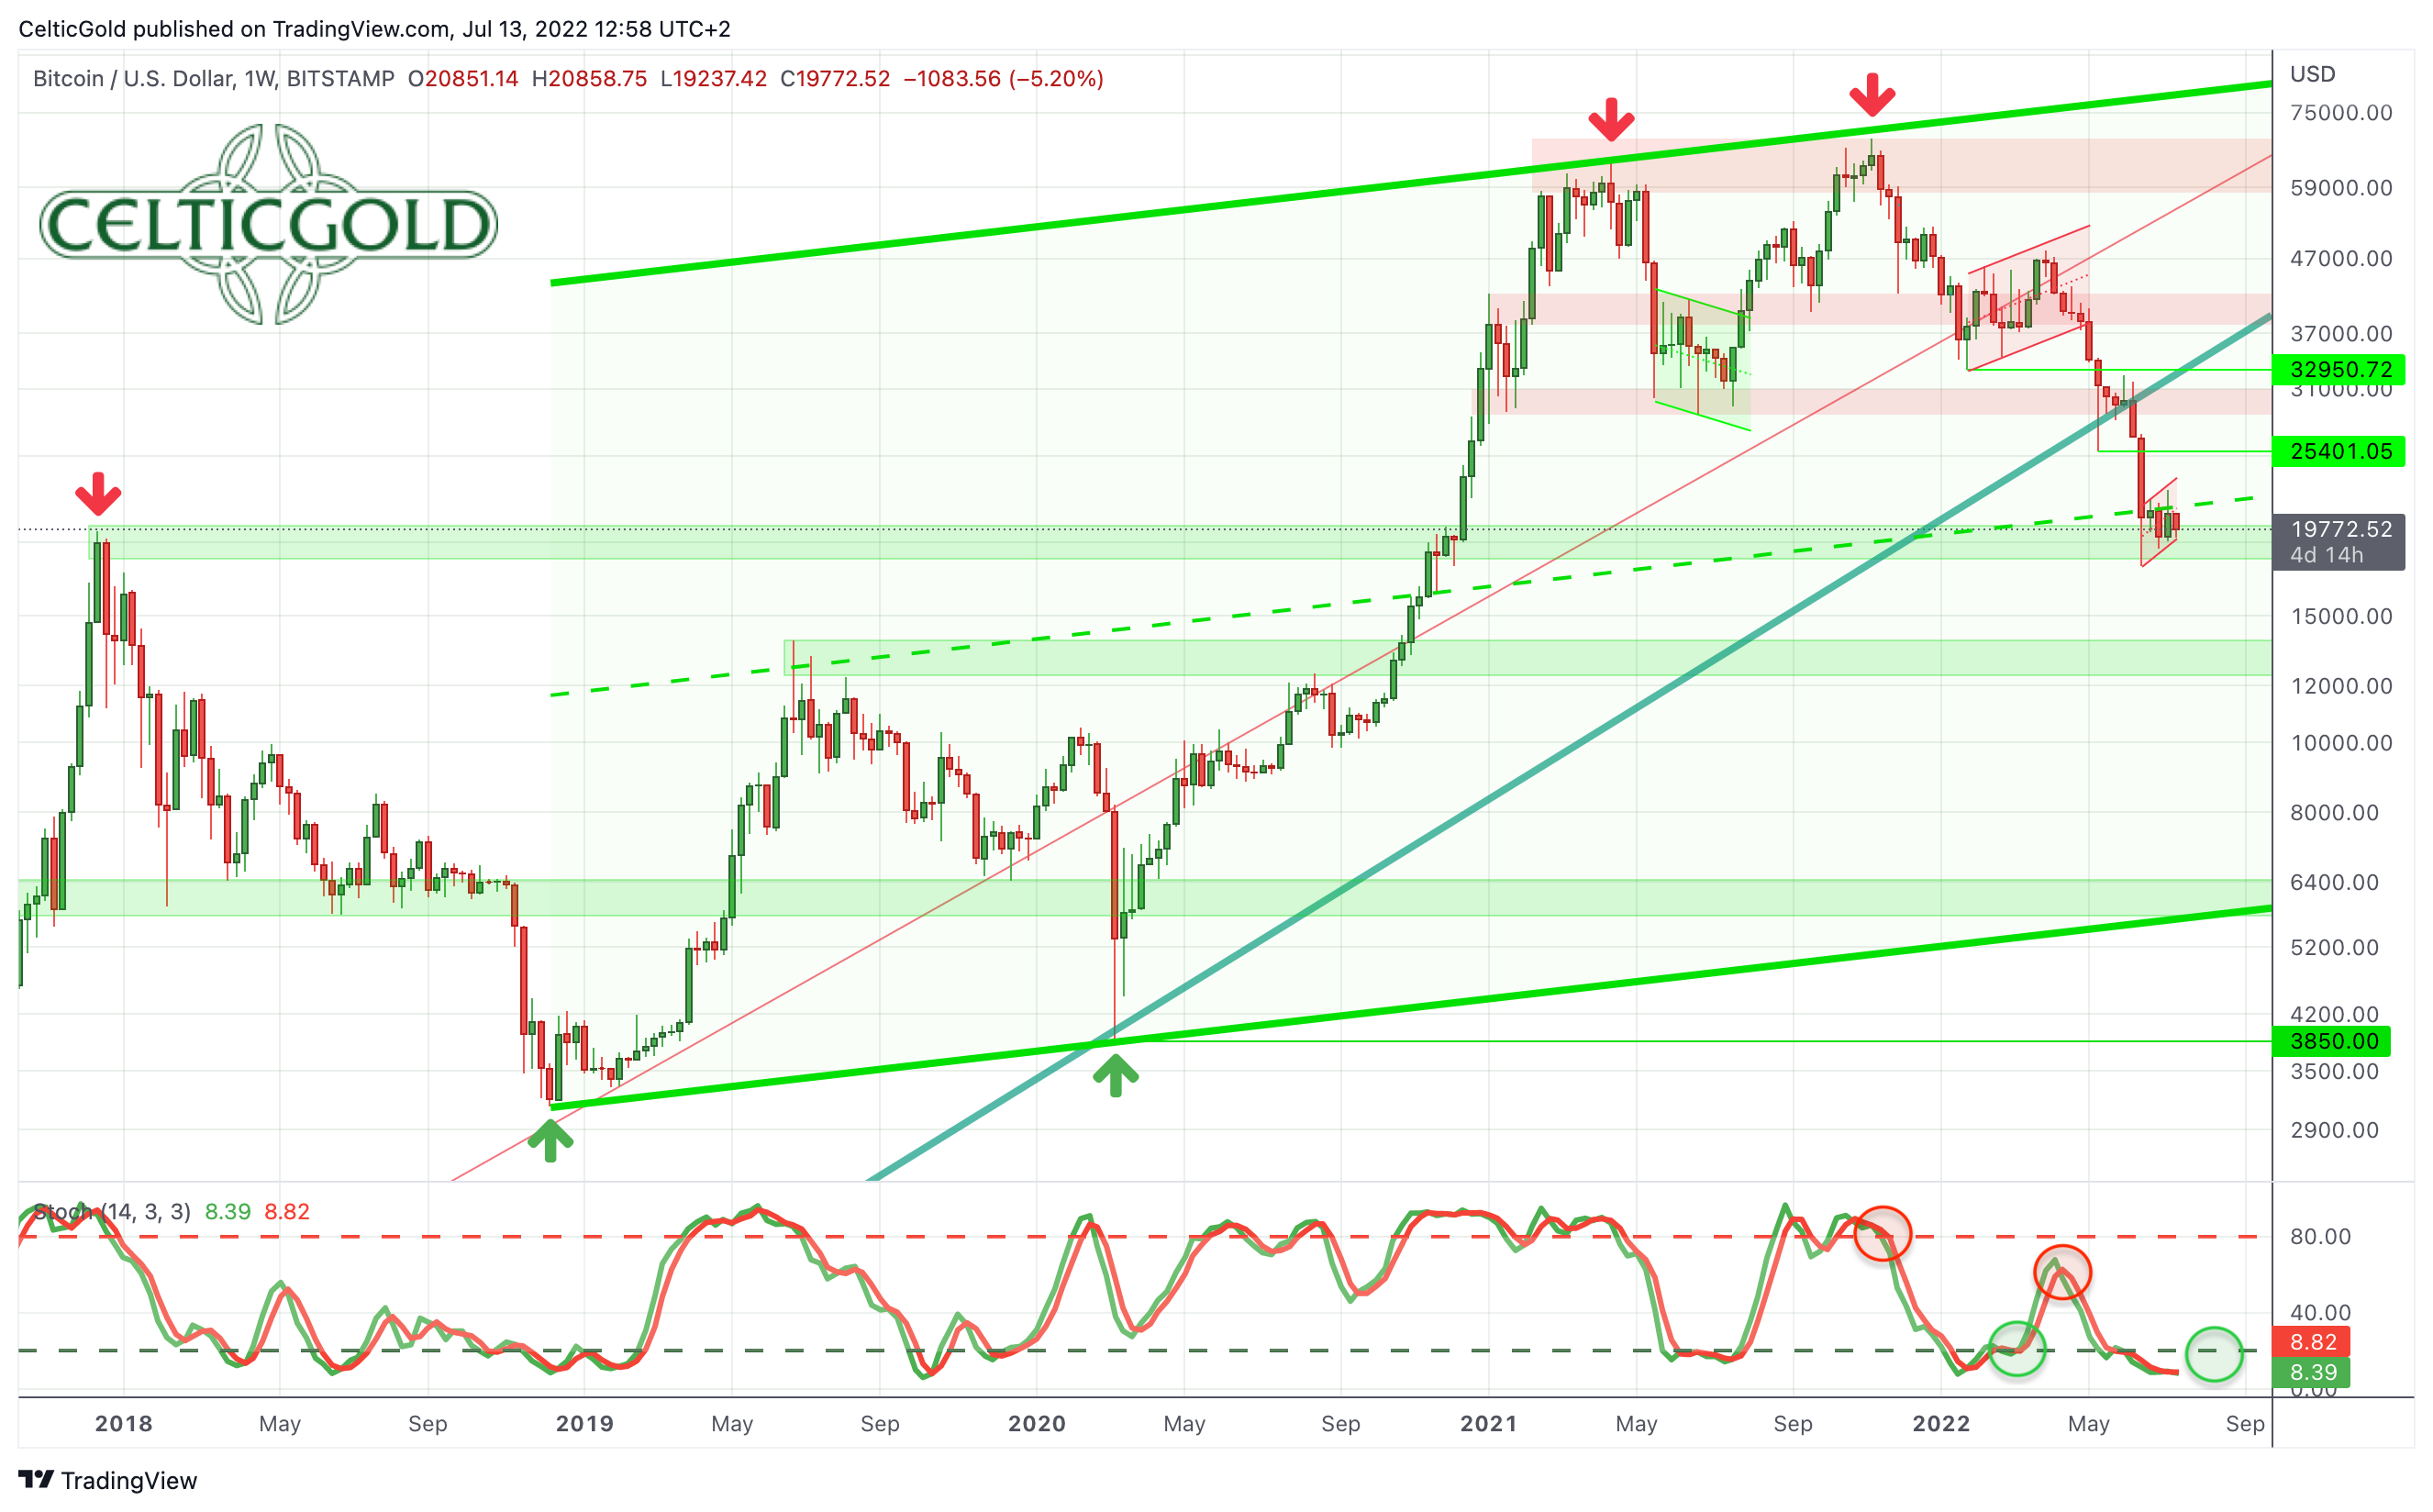 *Bitcoin in USD, weekly chart as of July 13th, 2022. Source: Tradingview* Bitcoin has been in a harsh correction for a little over eight months now. Apart from a somewhat extended rally in February and March, the bulls had hardly anything to offer in terms of resistance. Even the 10-year uptrend line (dark green) was ultimately an easy game for the bears. Now, bitcoin prices cling to the middle line of the overriding uptrend channel. This, together with the completely oversold stochastic oscillator and the previous all-time high around 20,000 USD, forms a certain support, which currently seems to hold. Overall, the weekly chart is still bearish for now, but the chances of a recovery might outweigh the gloomy picture in the coming weeks. As we know from the past, bear market rallies in bitcoin can be extreme. Realistic recovery targets are around 25,400 USD and maybe 29,750 USD as well. #### Bitcoin Daily Chart – Bollinger bands are tightening 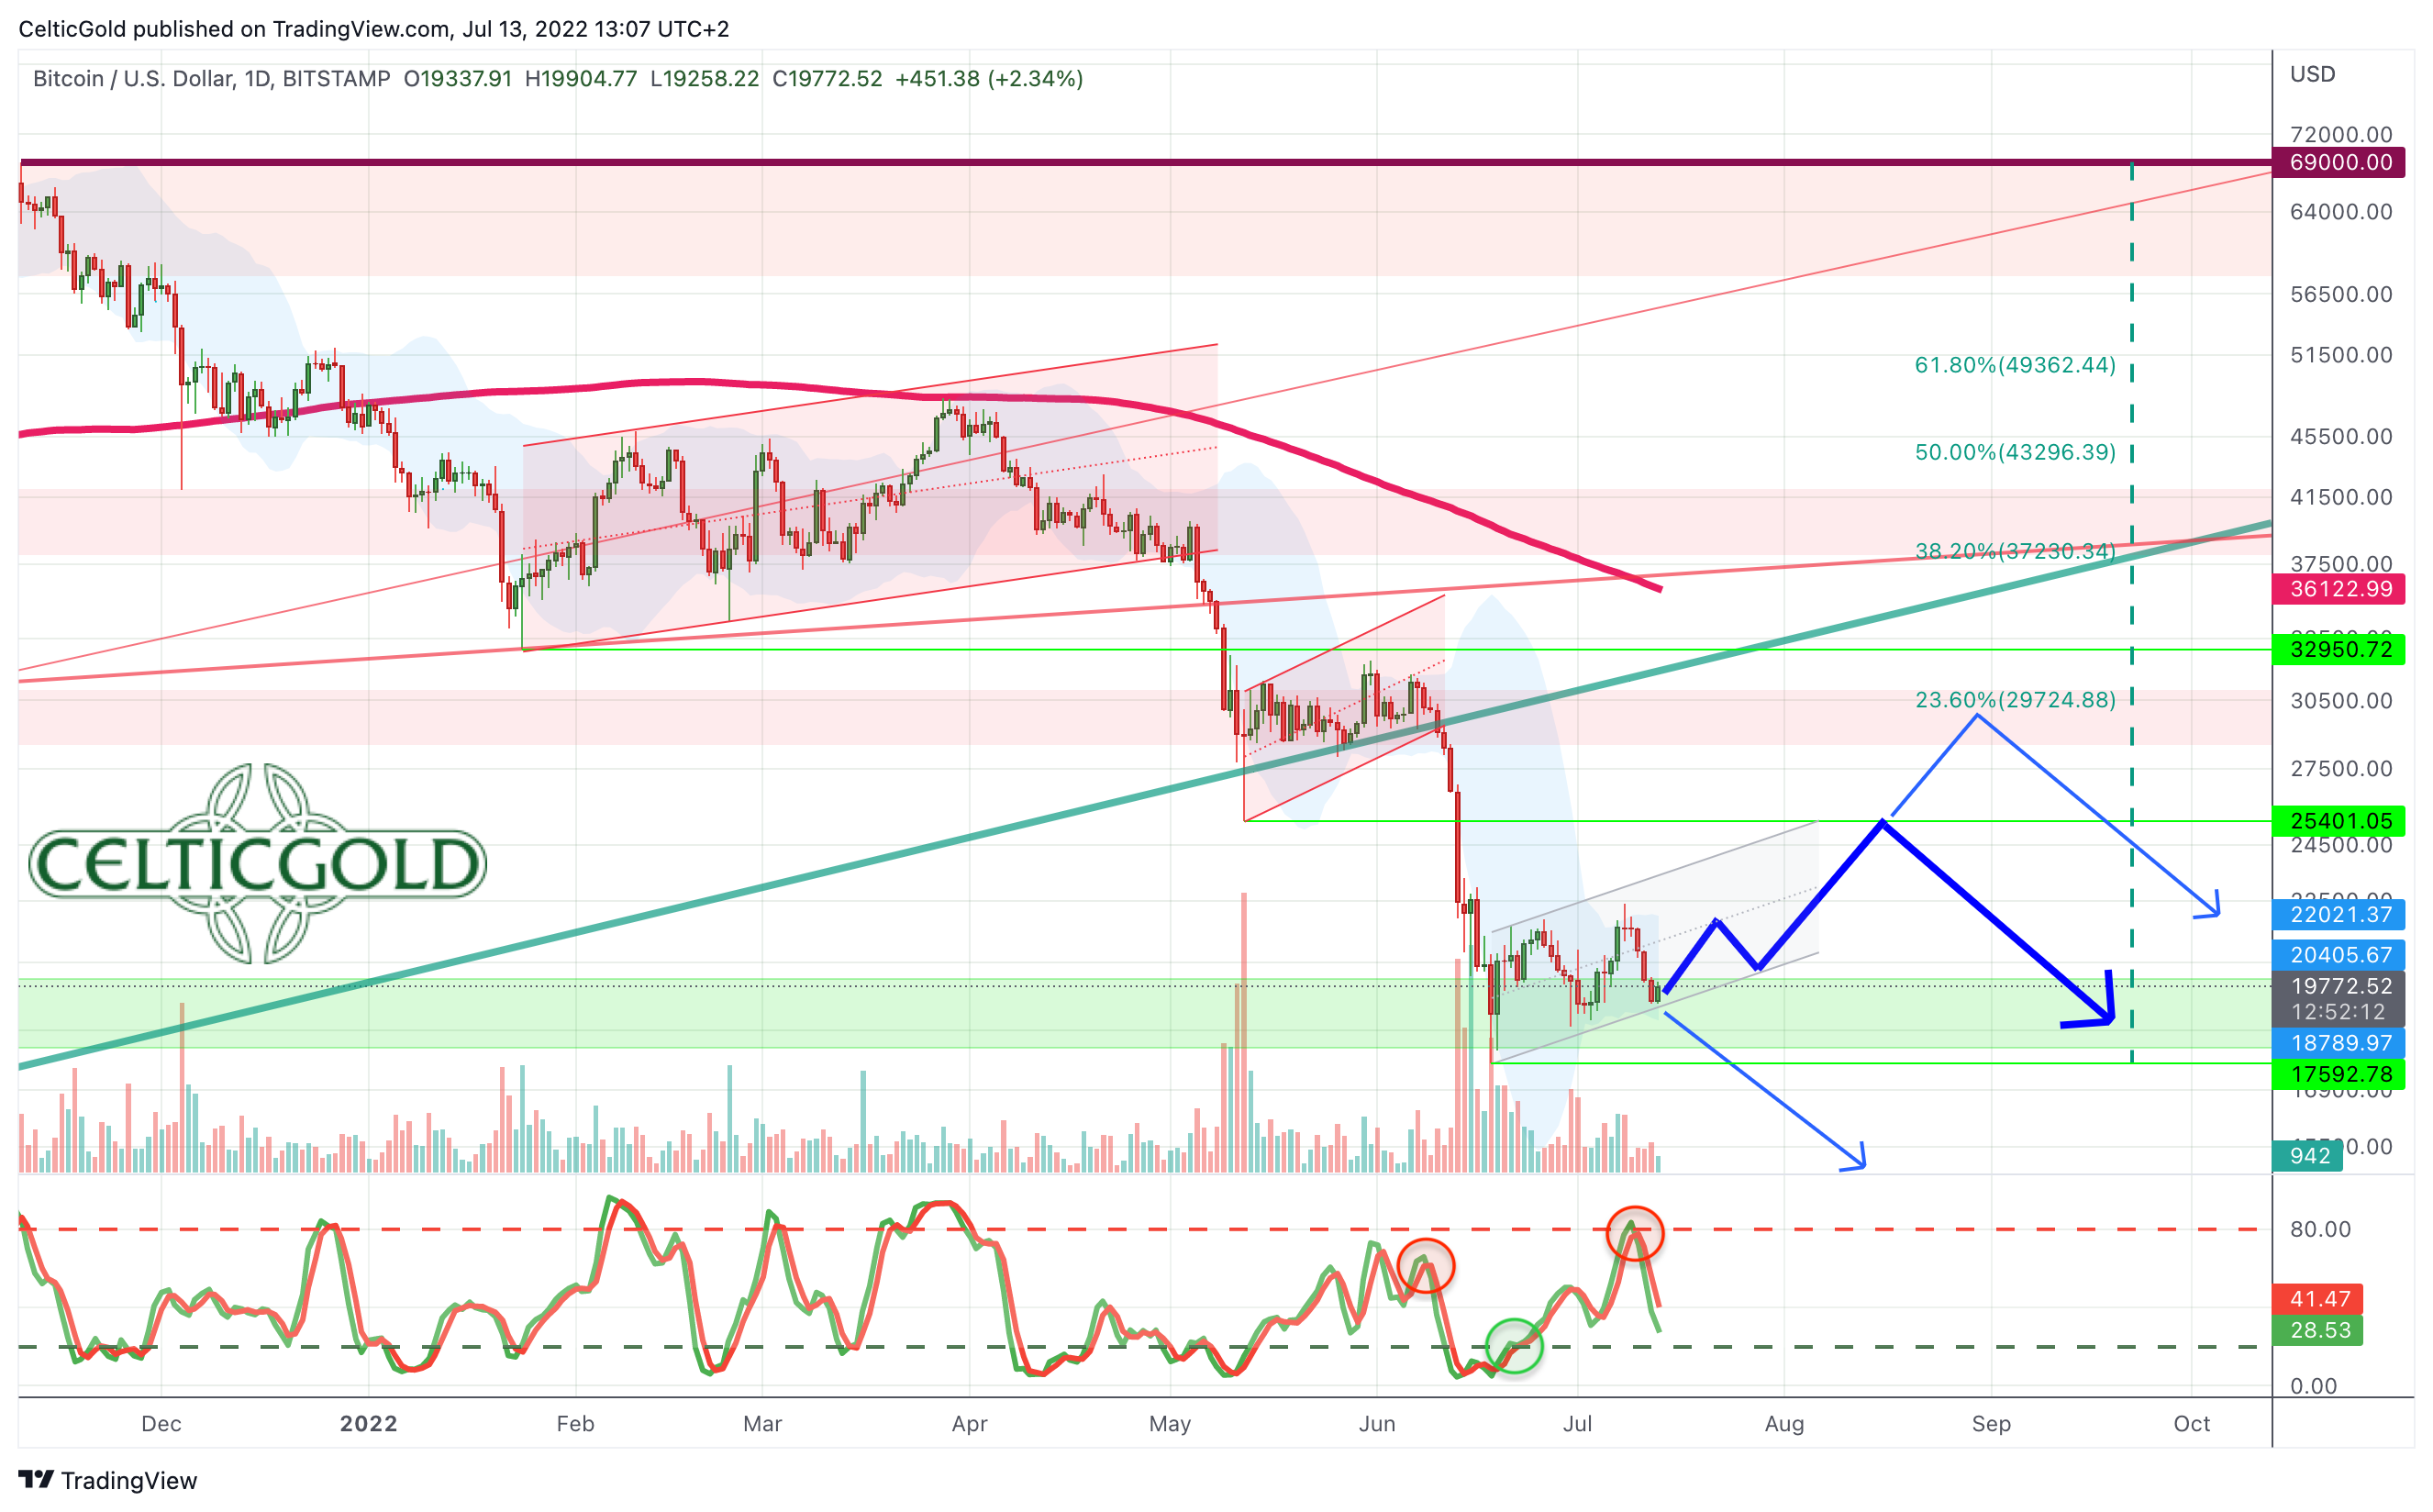 *Bitcoin in USD, daily chart as of July 13th, 2022. Source: Tradingview* On the daily chart, a consolidation has developed again since the low on June 18th, which could turn out to be a flag formation similar to the ones before. In any case, the low at 17,592 USD was not undercut in the last three and a half weeks. The stochastic still has an active sell signal, but the oscillator has already almost reached the oversold zone. If the stabilization around 20,000 USD succeeds at the same time, a recovery in the direction of the upper Bollinger band (22,021 USD) and up to the vicinity of the May low at 25,401 USD would be possible. In summary, the daily chart is currently still bearish. At the same time, some stabilization tendencies are visible between 19,000 USD and 21,500 USD. Together with the relatively large distance to the fast falling 200-day moving average (36,122 USD), there are some arguments for a relief rally in the summer on the table. ### Sentiment Bitcoin – Relief rally in the summer? 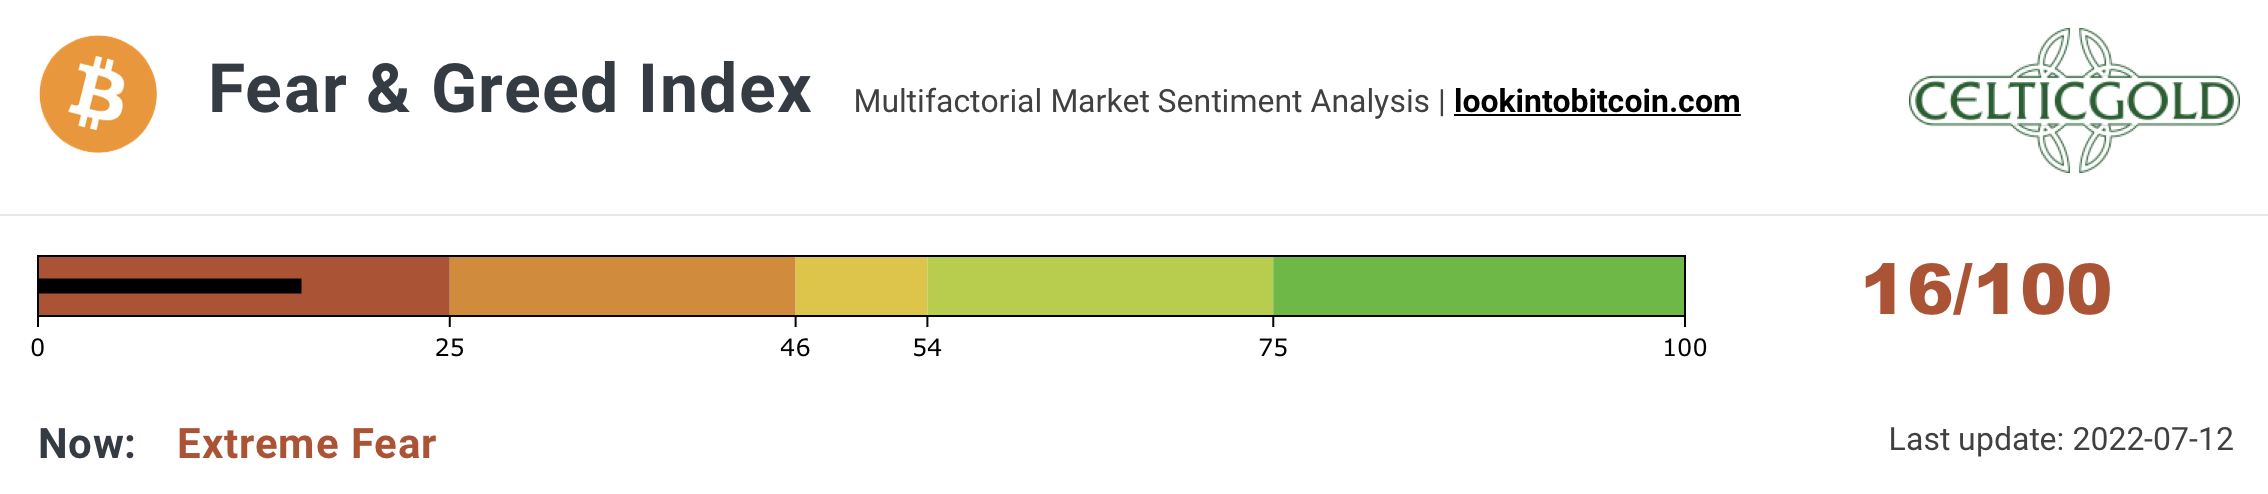 *Crypto Fear & Greed Index, as of July 12th, 2022. Source: Lookintobitcoin* The Crypto Fear & Greed Index has been trading in the deep dark red panic zone since the beginning of April, and thus for more than three months now. Hence, fear in the crypto sector runs very deep. 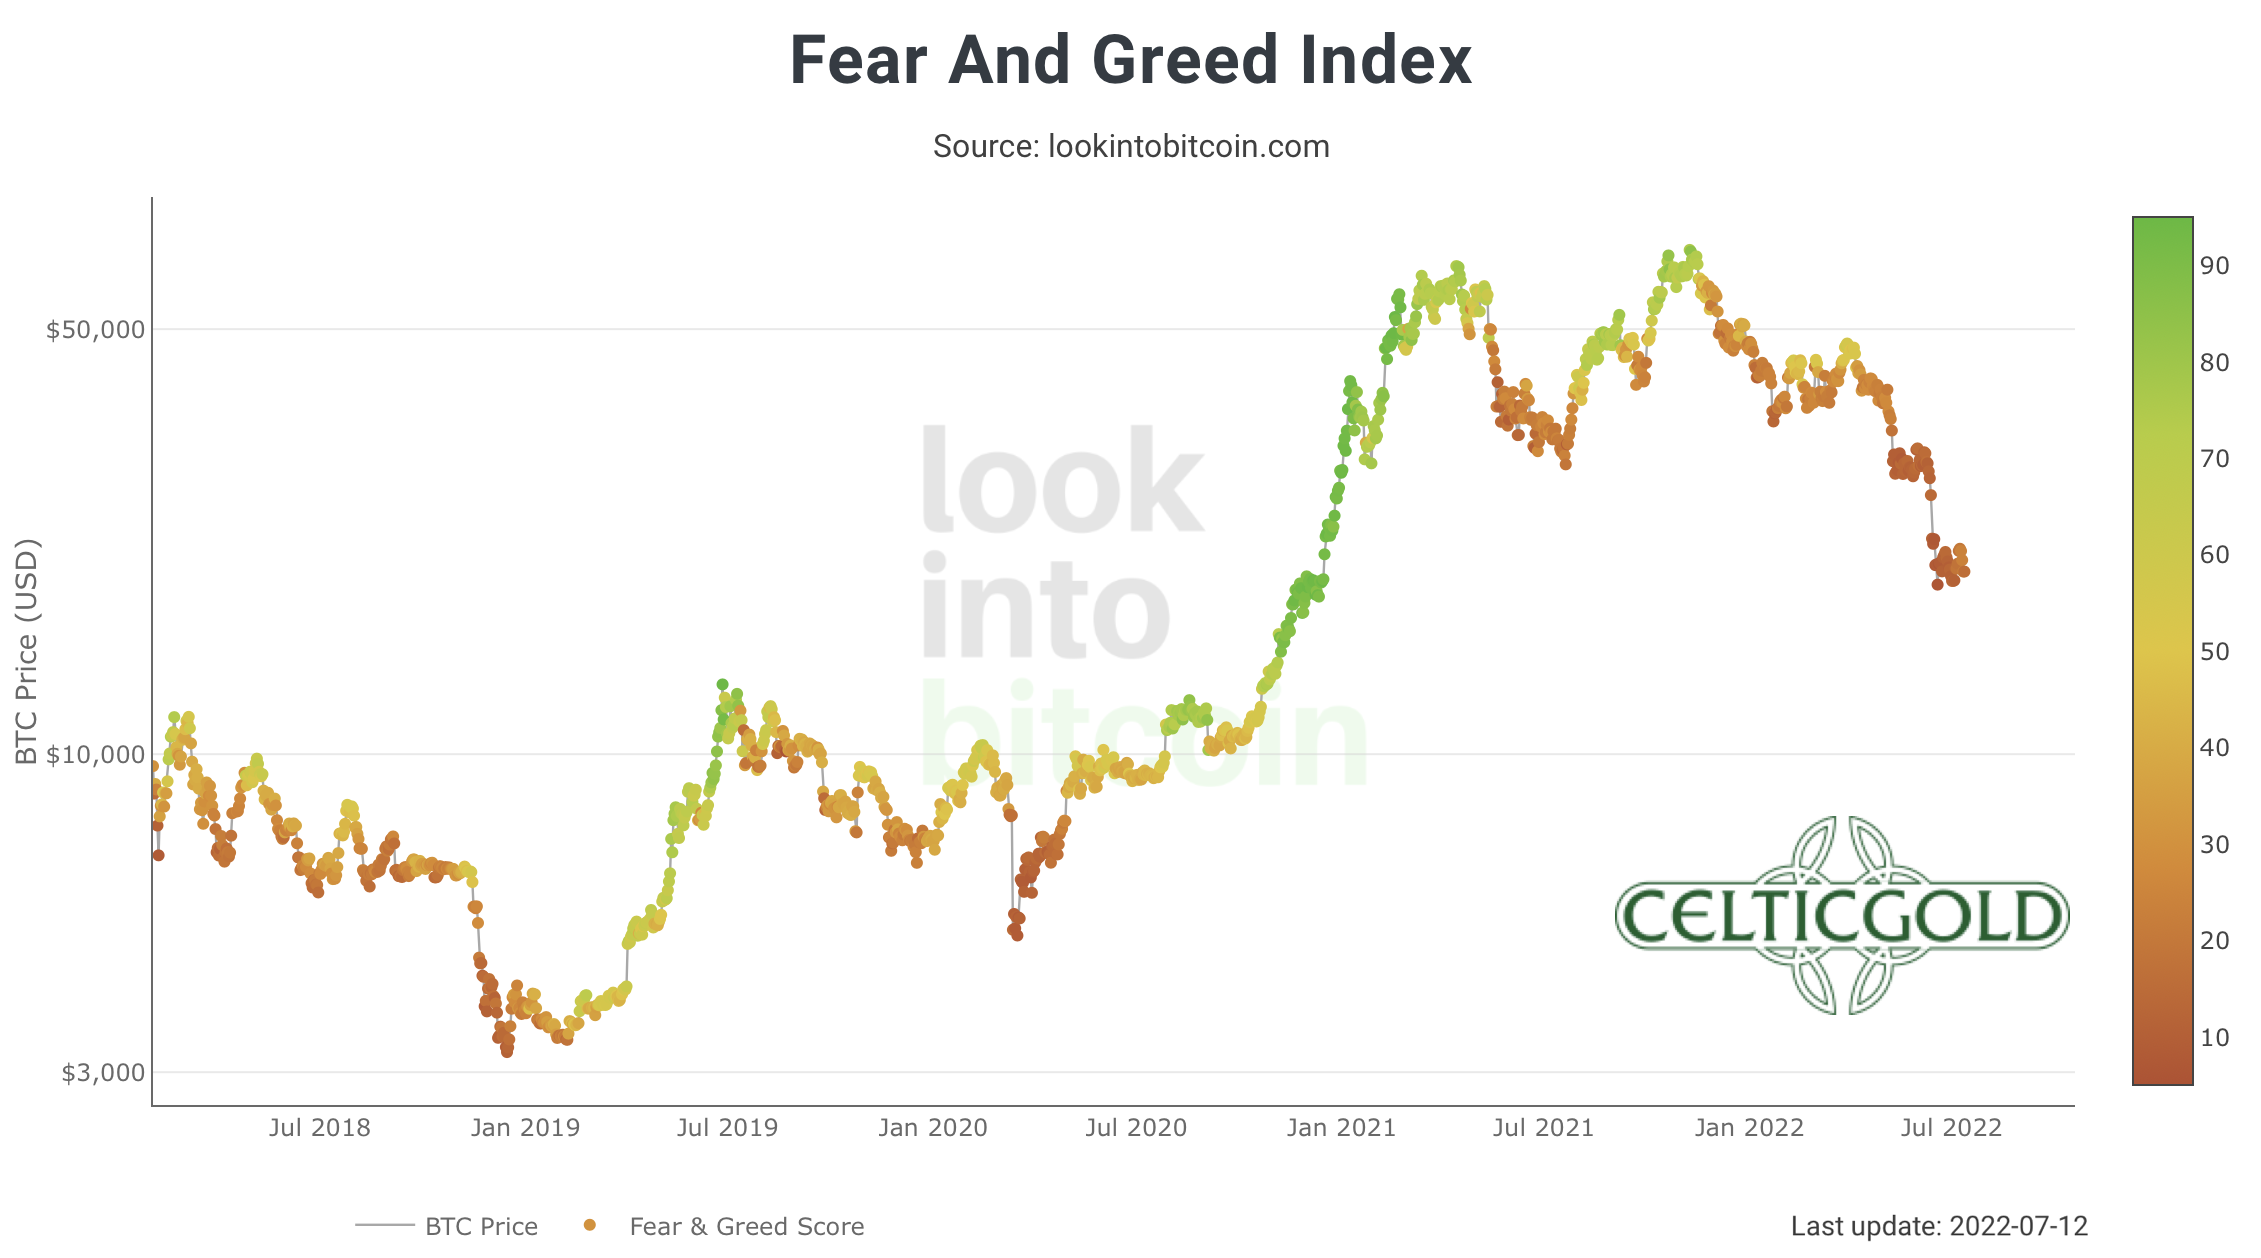 *Crypto Fear & Greed Index long term, as of July 12th, 2022. Source: Lookintobitcoin* In the big picture, the current dark red situation in the Crypto Fear & Greed Index resembles the setup from January 2019. Back then, the crypto winter had also hit brutally, and it took almost three months for bitcoin to get a massive recovery rally going. New lows were not seen in the bottoming phase back then. Overall, the beaten down panic sentiment provides the best contrarian buy signal in over two years! ### Seasonality Bitcoin 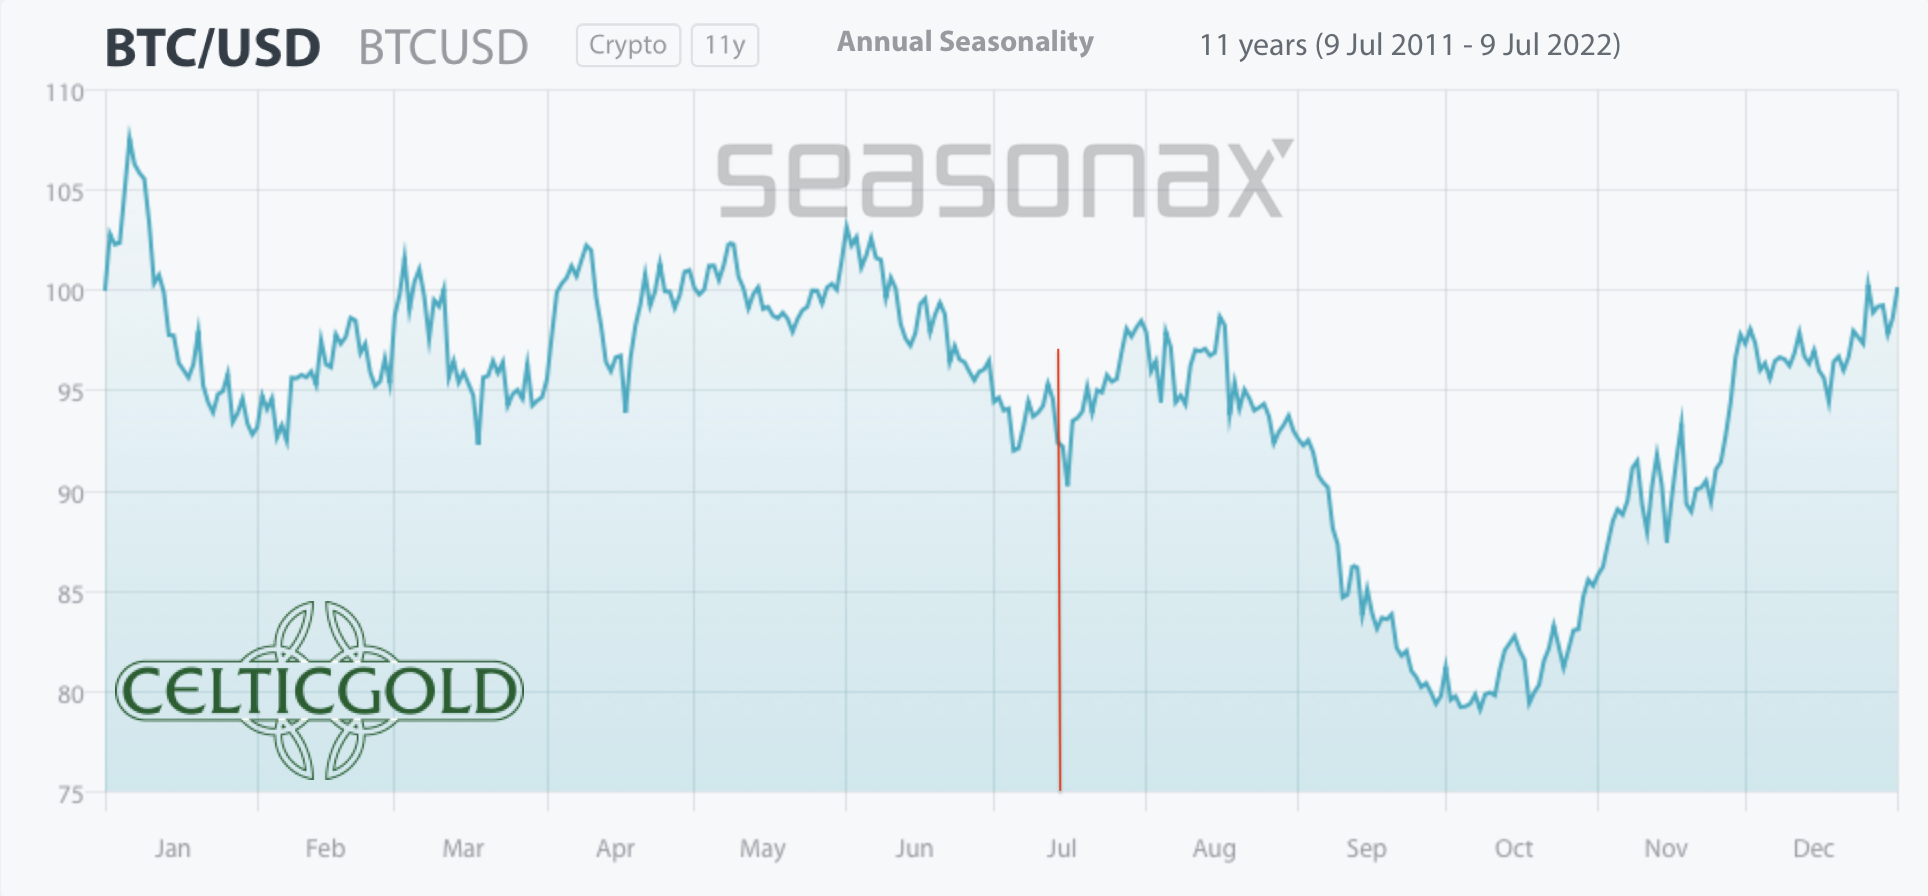 *Seasonality for bitcoin, as of July 11th, 2022. Source: Seasonax* Due to the weak price performance in the first six months of this year, the still young seasonal pattern for bitcoin has weakened or flattened significantly. Nevertheless, according to the statistics, there should be a wave down starting at the end of August, which could possibly run parallel to another sell-off in the stock markets. There, too, September has not earned itself a good name, but is traditionally regarded as the worst month of the year for the stock market. Until mid-August, however, the seasonal outlook does not stand in the way of a small recovery rally in the crypto sector. Overall, the seasonal component continues to urge patience and caution. The situation should not brighten up until mid/late October from a statistical perspective. A small summer rally, however, would be possible in the coming weeks. ### Sound Money: Bitcoin vs. Gold 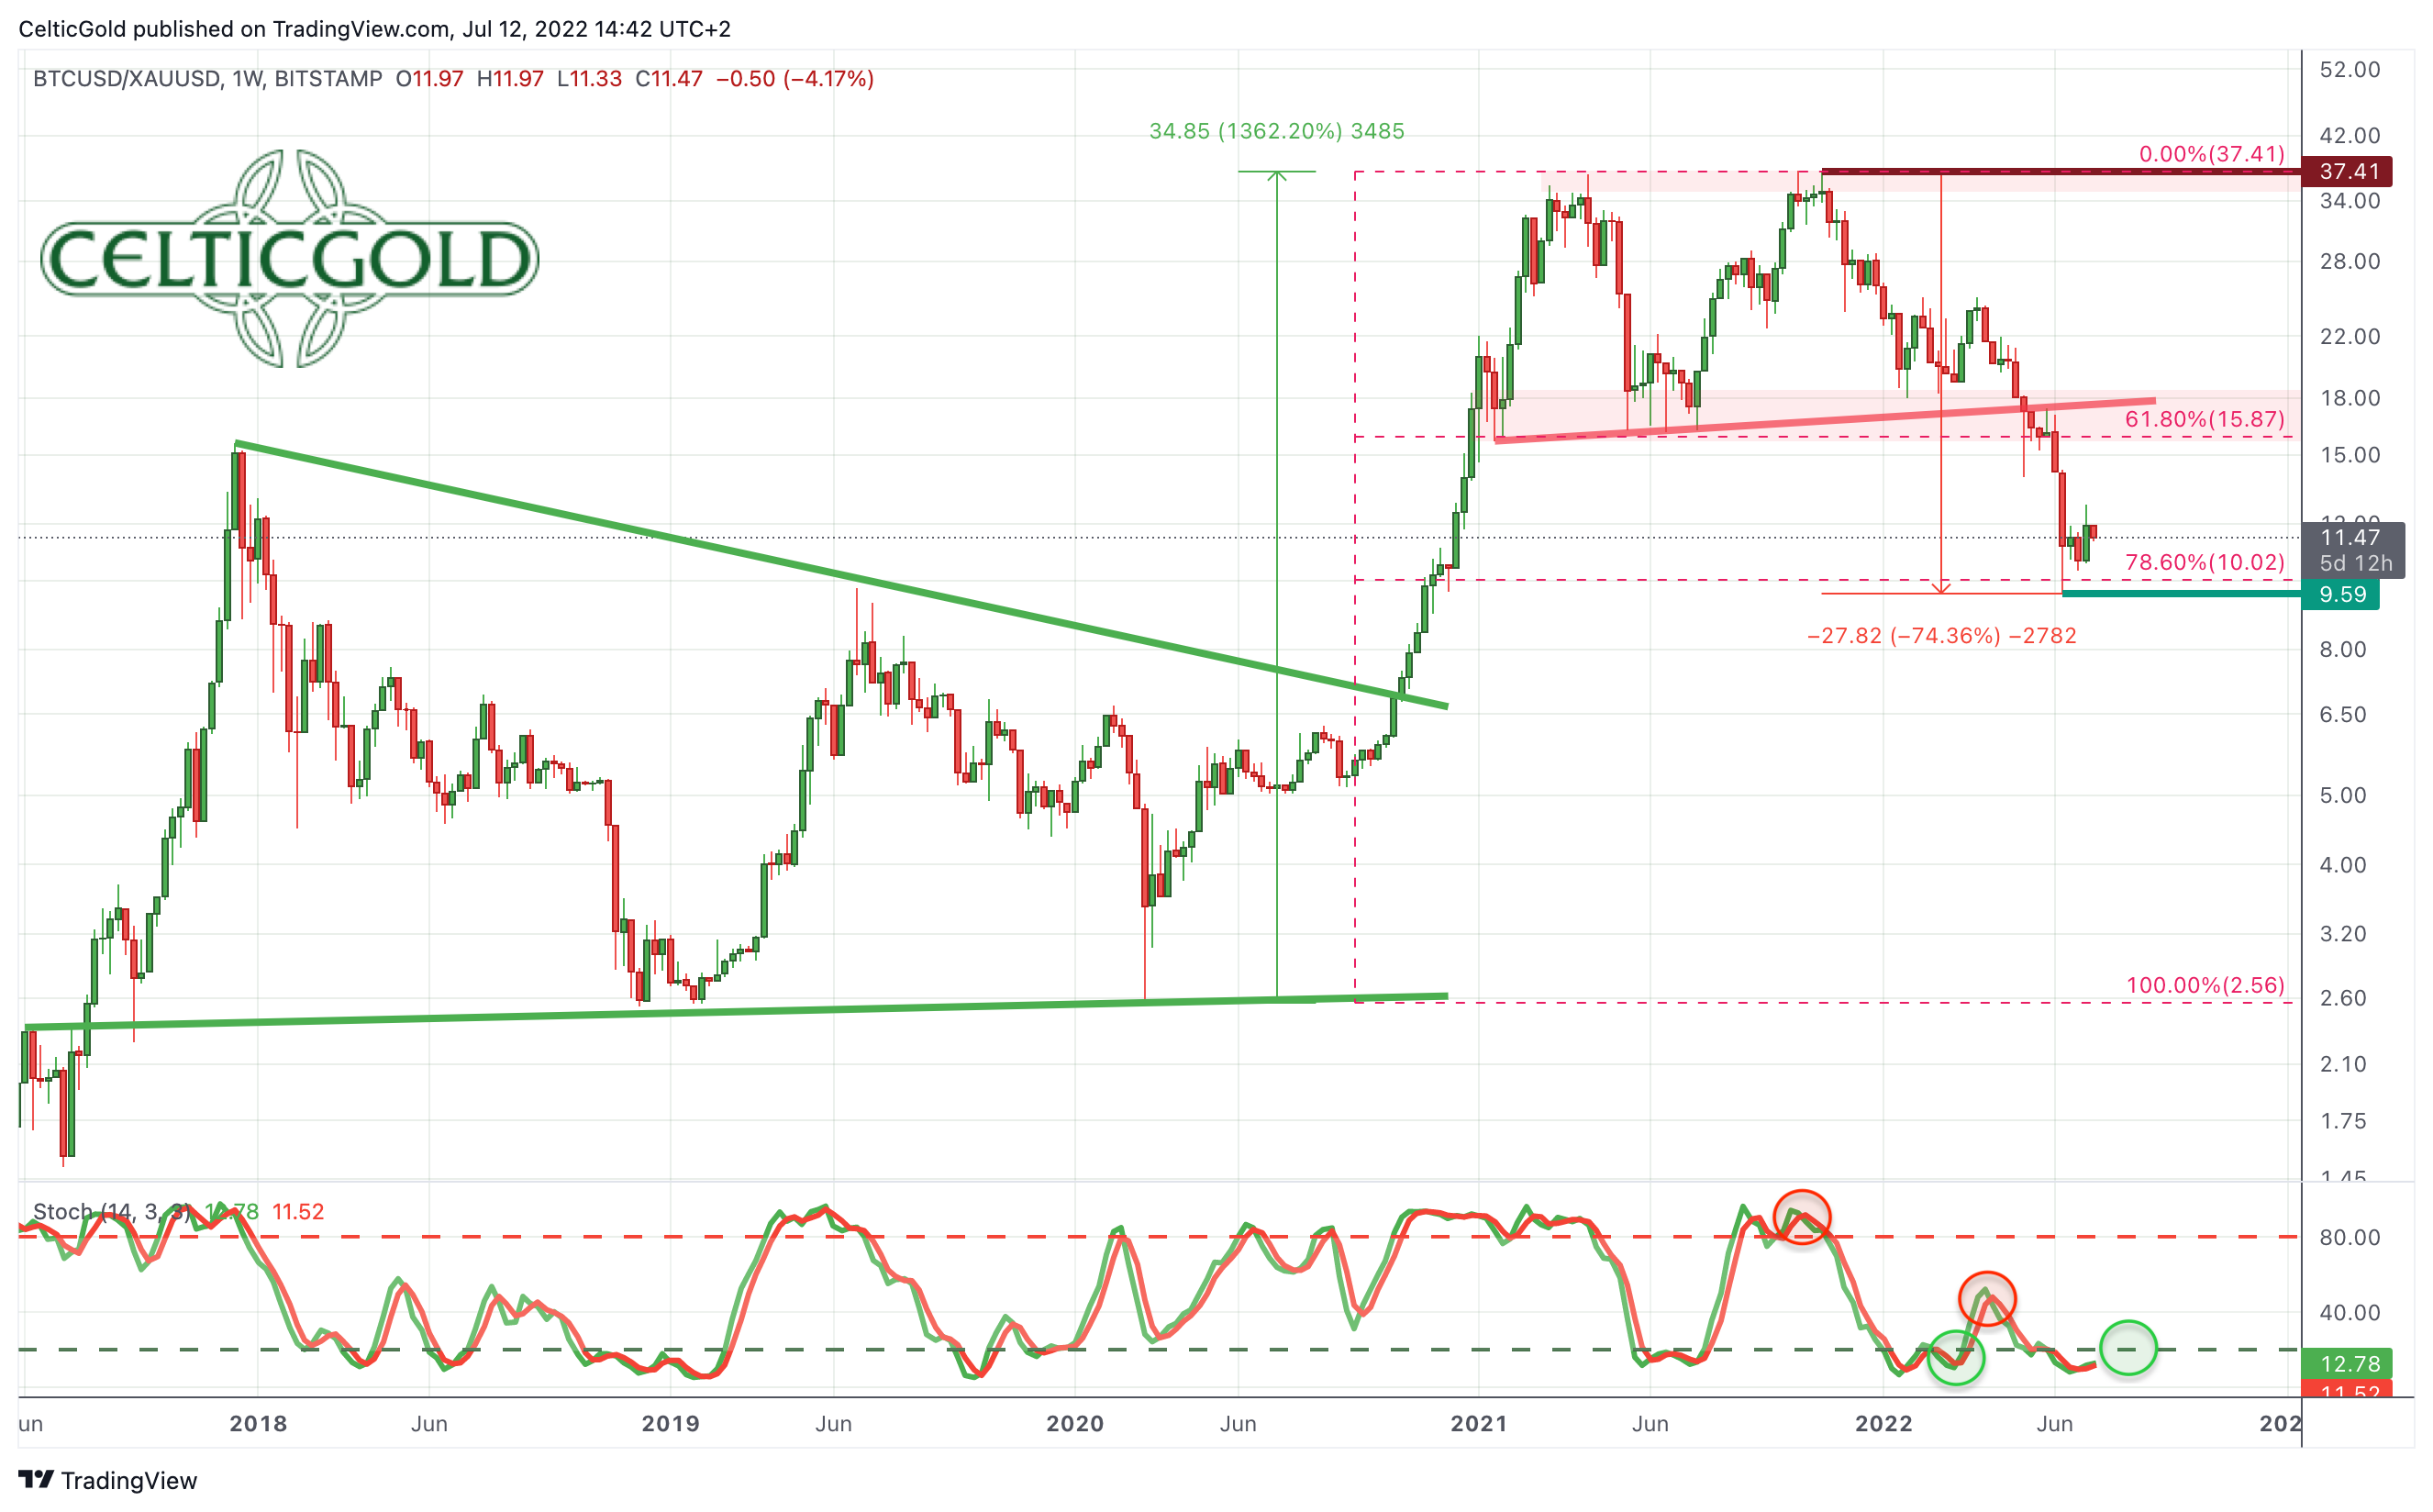 *Bitcoin/Gold-Ratio as of July 12th, 2022.Source: Tradingview* Analogous to the crash of bitcoin, the bitcoin/gold-ratio also fell in recent months and is currently trading around 11.5. Thus, Bitcoin has lost almost 75% against gold since November 2021! At current prices of around 20,000 USD for one Bitcoin and around 1,710 USD for a troy ounce of gold, one has to pay almost 11.5 ounces of gold for one bitcoin. Put another way, an ounce of gold currently costs about 0.085 bitcoin. Given the strongly oversold situation on the weekly chart near the 78.6% retracement, the chances for a countermovement or recovery are not bad at the moment. In the best case, a retracement to the broken support in the area around 15 to 16 would be conceivable. If bitcoin bears remain in control, however, the ratio could also be pushed directly down to around 5 to 6 in the coming months. #### Allocation of sound money Generally, buying and selling Bitcoin against gold only makes sense to the extent that one balances the allocation in those two asset classes! At least 10% up to a maximum of 25% of one’s total assets should be invested in precious metals physically, while in cryptos and especially in bitcoin one should hold at least 1% but max. 5%. If you are very familiar with cryptocurrencies and bitcoin, you can certainly allocate much higher percentages to bitcoin on an individual basis. For the average investor, who is primarily invested in equities and real estate, a maximum of 5% in the still highly speculative and highly volatile bitcoin is a good guideline! Overall, you want to own gold and bitcoin, since opposites complement each other. In our dualistic world of Yin and Yang, body and mind, up and down, warm and cold, we are bound by the necessary attraction of opposites. In this sense, you can view gold and bitcoin as such a pair of strength. With the physical component of gold and the pristine digital features of bitcoin, you have a complementary unit of a true safe haven for the 21st century. You want to own both! – Florian Grummes In summary, the bitcoin/gold-ratio suggests a recovery in favor of bitcoin in the coming weeks. One should not hope for too much given the difficult overall situation, but a rise to around 15 seems possible. While gold often lost out in 2020 and 2021, it was able to fully play out its conservative character this year and is the longed-for safe haven in the portfolio despite slight price declines. ### Macro Update – Panic & Recession of 2022 The world is changing faster than ever before. The political landscape is shifting rapidly around the world and becoming more unpredictable by the day. While technology is changing everything we do, tensions in society are increasing in almost every part of the world. Yet, an ounce of gold remains an ounce of gold. Likewise, one bitcoin remains one bitcoin. 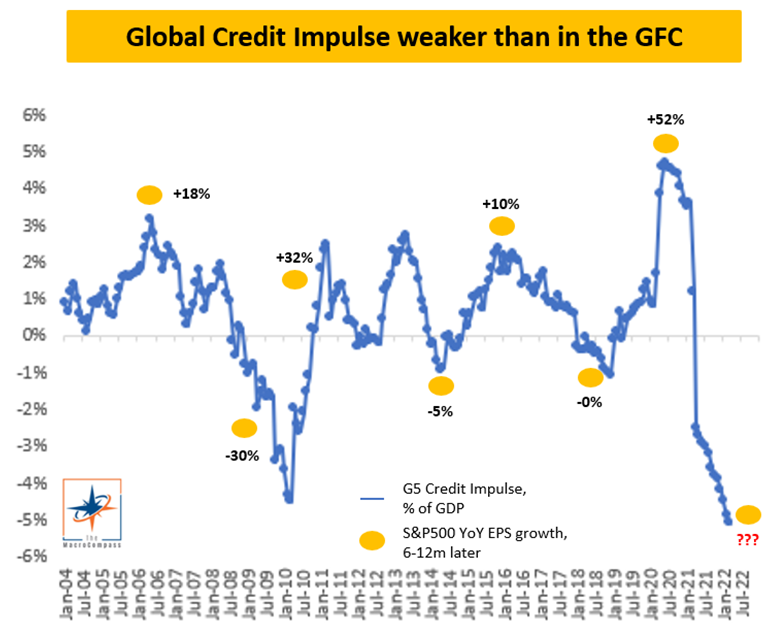 *Global Credit Impulse, as of July 7th, 2022. ©The Macro Compass & Alfonso Peccatiello* More than 50 years after Nixon repealed the gold standard, monetary policy has its back against the wall, as the Fed’s fight against inflation could soon plunge the world into a depressive abyss. Just two weeks after the start of its quantitative tightening program, the markets are already behaving like a junkie in withdrawal. Due to massive fiscal pressures as well as hesitant refinancing activity in the private sector, we are now witnessing a contraction in credit creation that is even faster than during the Great Financial Crisis of 2008! The Fed’s balancing act of fighting inflation without triggering severe dislocations in the markets is therefore doomed to fail. The vehemence of the tightening cycle that has just begun threatens to turn the “Everything Bubble” into an “Everything Crash.” #### When will the Fed end its tightening cycle? 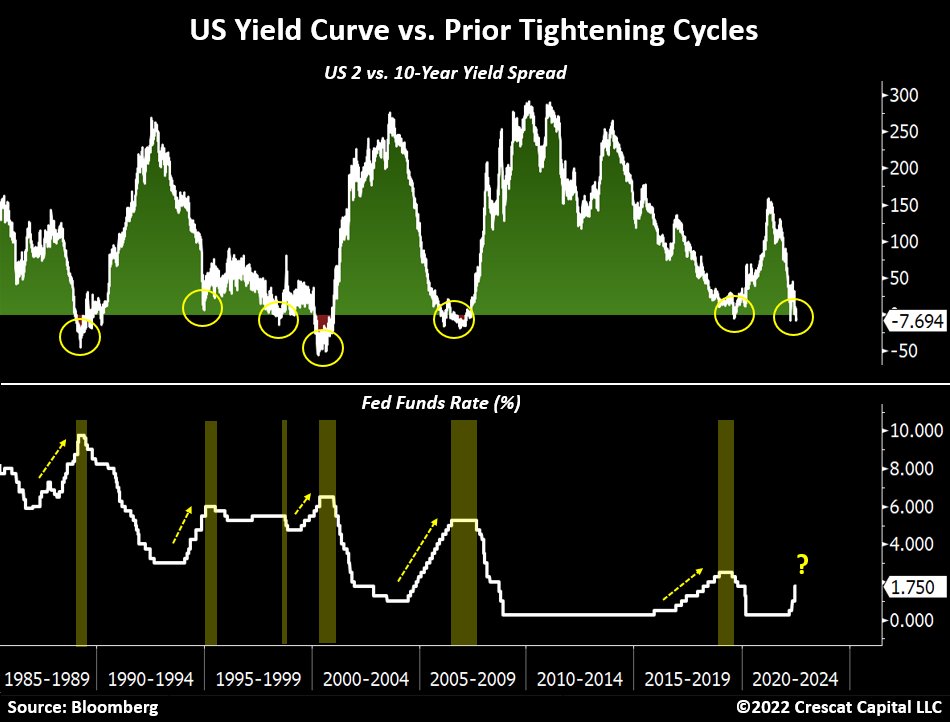 *US Yield Curve vs. Prior Tightening Cycles, as of July 12, 2022. ©Crescat Capital & Tavi Costa* It is therefore realistic to expect that US monetary policy will have to deviate from the current hawkish monetary policy stance sooner rather than later and make a U-turn. However, it cannot be ruled out that the FED will once again act far too late. Currently, the yield curve in the US is already turning. In the past 30 years, this constellation has forced the Fed to end its tightening cycle every time. Since the systemic risk is now greater than ever before in history, the Fed can no longer afford to make a wrong decision. 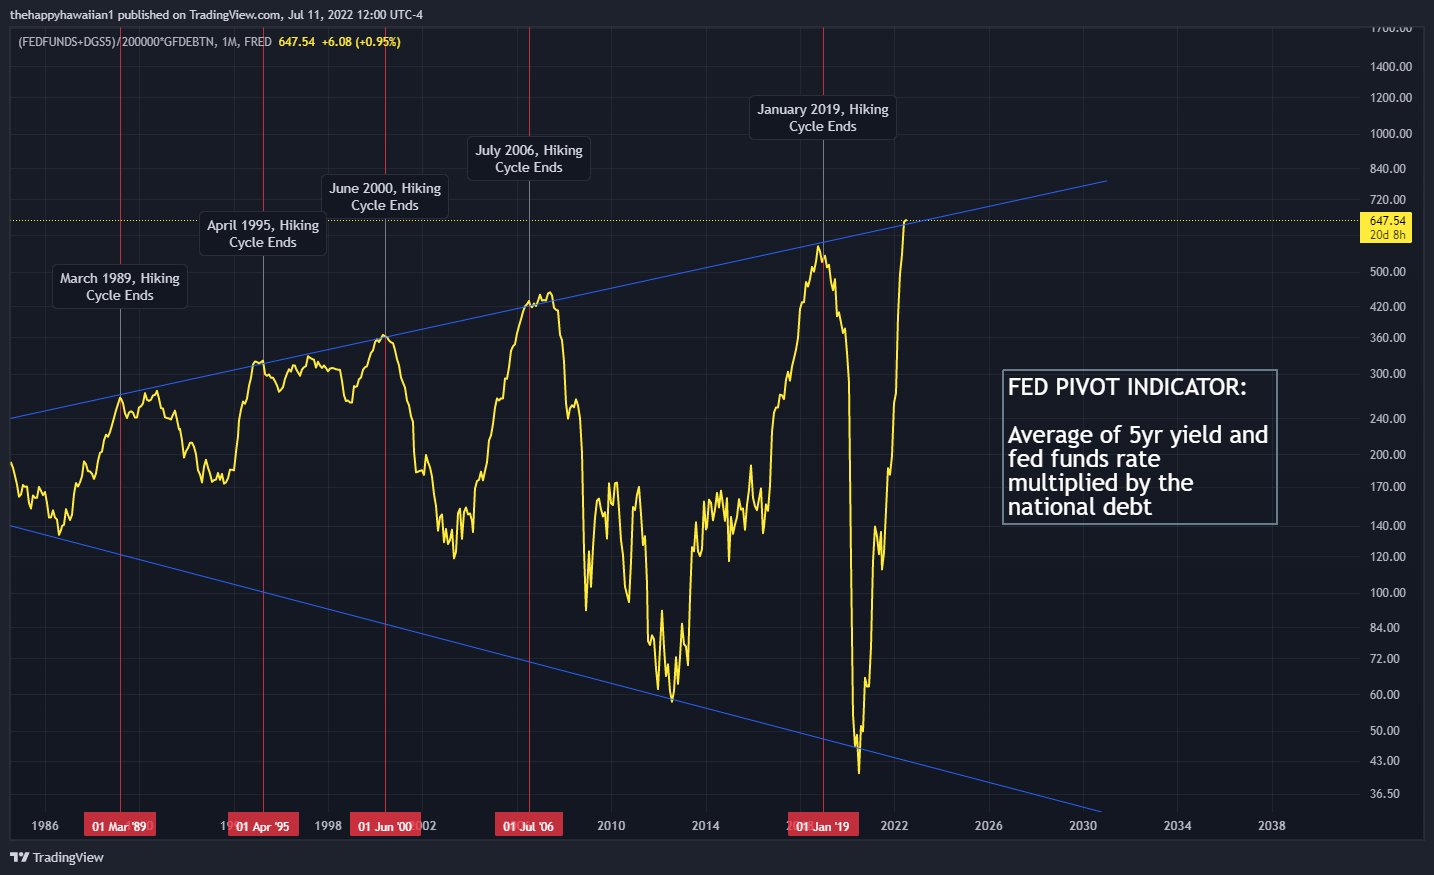 *Fed pivot indicator, as of July 11th, 2022. ©TheHappyHawaiian* In fact, some indications now suggest that the FED will have to react soon. With the next rate hike, the FED would presumably and knowingly blow up the financial system. Hence, even the verbal suggestion that rate hikes would be suspended or at least slowed down should therefore be enough at the moment to trigger a summer relief rally in all markets. Likewise, somewhat weaker U.S. inflation data is expected due to the global contraction, which the markets should also take with great relief. In addition, the U.S. dollar index has had a tremendous ride, rising almost uninterruptedly by a total of +21.25% over the past 14 months. A breather in the U.S. dollar should bring a sigh of relief in the equity, commodity, precious metals and crypto markets. Overall, the chances for a recovery in all markets during the coming summer weeks are therefore not bad. From mid-August or September at the latest, however, the bears are likely to come back. ### Conclusion: Bitcoin – Relief rally in the summer? After a month-long sell-off, including a nasty wave of bankruptcies, bitcoin is currently trading just below 20,000 USD. Eight months ago, very few people would have expected this. Now, however, bullish market participants are rare and numerous experts are coming up with renewed lower price targets for bitcoin. The bitcoin network itself, on the other hand, completely unimpressed by the “Lehman moment” in the crypto sector, continues to process any cryptographically legitimate payments via a computer network of equal computers (peer-to-peer) without any problems. In the context of the equity markets, which have also seen a severe correction and have correlated strongly with the crypto sector in recent months, a short-term recovery opportunity can be discerned due to the heavily oversold situation. In fact, a summer relief rally towards around 25,000 USD and maybe even close to around 30,000 USD could be possible, especially if inflation declines slightly and the Fed adopts a somewhat milder tone. Nevertheless, the end of the crypto winter is still likely to be a long time away. In any case, prices below 20,000 USD offer a good entry opportunity in the long run. But we believe that a bottom around 10,000 USD is more likely in the next 3 to 12 months. _Analysis sponsored and initially published on July 13th, 2022, by [www.celticgold.eu](https://celticgold.de/blog/gold-und-bitcoin-analysen-von-florian-grummes-32/bitcoin-erleichterungsrally-im-sommer-180). Translated into English and partially updated on July 14th, 2022._ _Feel free to join us in our free [Telegram channel](https://t.me/MidasTouchConsulting) for daily real time data and a great community._ _If you like to get regular updates on our gold model, precious metals, commodities, & cryptocurrencies you can subscribe to our [free newsletter](http://bit.ly/1EUdt2K)._ _Disclosure: This article and the content are for informational purposes only and do not contain investment advice or recommendations. Every investment and trading move involves risk, and readers should conduct their own research when making a decision. The views, thoughts and opinions expressed here are the author’s alone. They do not necessarily reflect or represent the views and opinions of Midas Touch Consulting._ |
| json metadata | {"tags":["bitcoin","crypto","leofinance","investing","gold"],"image":["https://cdn.steemitimages.com/DQmZntXw1JT1zkWmSUstf8z15qQYD5hKc2QQdHHSsHXB1QX/celtic-gold-midas-touch-bitcoin-update-header.jpg","https://cdn.steemitimages.com/DQmc7WL5HXL46UAhWGy1xirxnBk4xMYuuR2U3oNrGu1Wj6n/Chart%2001%20Bitcoin%20weekly%20chart%20130722.png","https://cdn.steemitimages.com/DQmaJi62NU2RHQXSGVX43GQVi46C1dLALAxVjnMTDyYyhir/Chart%2002%20Bitcoin%20daily%20chart%20130722.png","https://cdn.steemitimages.com/DQmU5TTHrEosjeaC436FwLEBiqkJsWfVENaLHPUr2E7qQvA/Chart%2003%20Crypto%20Fear%20&%20Greed%20Index%20120722.png","https://cdn.steemitimages.com/DQmbhDKhuZrui4gMNDVxWALWPpNP7FBfpUUwhhaUMJ1LN5T/Chart%2004%20Crypto%20Fear%20&%20Greed%20Index%20110722.png","https://cdn.steemitimages.com/DQmRGTXH49JWAW2xvqxSpgqgV4NPiNAy4UF3s56Cj7LnBMh/Chart%2005%20Bitcoin%20Seasonality%20110722.png","https://cdn.steemitimages.com/DQmVgZM2rbYr24MCdj1RdE7cnAgeR2jtBFC1RnR7XkAnCKY/Chart%2006%20Bitcoin:Gold-Ratio%20120722.png","https://cdn.steemitimages.com/DQmRVm1bGxPBX1WqHJeJjA3BfNatFgFND4tv7ZuoHDYFTEs/Chart%2007%20Global%20Credit%20Impulse%20070722.png","https://cdn.steemitimages.com/DQmQNrYmziHYBVDwytm7rJowyHY8NTERwXsoULsMzQTBpCs/Chart%2008%20US%20Yield%20Curve%20vs.%20Prior%20Tightening%20Cycles.jpeg","https://cdn.steemitimages.com/DQmXo5s7JyQL6SFp3MQHRrAZx74NLhdXra2BCfAjFqS6s41/Chart%2009%20Fed%20pivot%20indicator%20110722.jpeg"],"links":["https://www.midastouch-consulting.com/14072022-bitcoin-relief-rally-in-the-summer","https://celticgold.de/blog/gold-und-bitcoin-analysen-von-florian-grummes-32/bitcoin-erleichterungsrally-im-sommer-180","https://t.me/MidasTouchConsulting","http://bit.ly/1EUdt2K"],"app":"steemit/0.2","format":"markdown"} |
| parent author | |
| parent permlink | bitcoin |
| permlink | july-14th-2022-bitcoin-relief-rally-in-the-summer |
| title | July 14th, 2022, Bitcoin – Relief rally in the summer? |
| Transaction Info | Block #65962885/Trx 308da87d6dd01d65062e5a9fc14271144645967a |
View Raw JSON Data
{
"block": 65962885,
"op": [
"comment",
{
"author": "midastouch",
"body": "\n\n# [July 14th, 2022, Bitcoin – Relief rally in the summer?](https://www.midastouch-consulting.com/14072022-bitcoin-relief-rally-in-the-summer)\n\nA worldwide asset price meltdown is shaking up the minds of all investors & traders these days. Nothing seems safe anymore and the crypto sector was hit the hardest. Bitcoin – Relief rally in the summer?\n\n### Review\n\nWith the clear break of the support around 37,500 USD, the sell-off in the crypto sector intensified dramatically from the beginning of May and bitcoin prices plunged to 25,400 USD within just one week. Despite the already heavily oversold situation at that time, only a tentative recovery or countermovement succeeded afterwards, which already found its end at 32,375 USD.\n\nStarting June 6th, bears went directly into attack mode and pushed bitcoin prices within just 12 days down to 17,600 USD, the lowest level since December 2020. Following this crash, prices are once again only very slowly and tentatively getting back on their feet. So far, they have only managed to recover to 22,400 USD. The bottom line is that bitcoin has lost almost 75% from its all-time high around 69,000 USD on November 10th, 2021.\n\nEthereum (-81.9%) and the larger altcoins such as Solana (-90%), Polygon (-89.2%), Chainlink (-89.6%), Cardano (-87%) were punished even more severely. The smaller altcoins, however, have almost all lost 90 – 99% across the board.\n\n#### Brutal wave of bankruptcies\n\nOverall, the crypto sector has been hit hard as the brutal wave of bankruptcies (Lunar, Celsius, Three Arrows Capital, Voyager Digital, BlockFi, Babel Finance, etc.) has been unfolding. The chaotic turmoil has wiped out more than 2 trillion USD in market capitalization and cost thousands of jobs in just a few months. An end to the shakeout is not yet in sight due to the opaque interconnections within the industry and the large number of fraudulent speculators or inexperienced players.\n\nWhen asset prices collapse or a counter-party defaults on a massive loan, the lender’s balance sheets are left with huge holes. The residual liquidation of collateral then leads to even more loans coming due, which leads to further liquidation of collateral. As a result, numerous trading venues have limited or blocked user withdrawals in recent weeks, further drying up liquidity.\n\nRetail investors who had trusted these lenders to protect their assets or, in particular, to generate high returns have, in some cases, lost everything. Add to this the fear of a global recession accompanied by the worst inflation in more than 40 years. Despite the huge losses, therefore, the end of the storm may not yet have been seen.\n\n### Technical Analysis For Bitcoin in US-Dollar\n\n#### Bitcoin Weekly Chart – Opportunity for a recovery\n\n*Bitcoin in USD, weekly chart as of July 13th, 2022. Source: Tradingview*\n\nBitcoin has been in a harsh correction for a little over eight months now. Apart from a somewhat extended rally in February and March, the bulls had hardly anything to offer in terms of resistance. Even the 10-year uptrend line (dark green) was ultimately an easy game for the bears. Now, bitcoin prices cling to the middle line of the overriding uptrend channel. This, together with the completely oversold stochastic oscillator and the previous all-time high around 20,000 USD, forms a certain support, which currently seems to hold.\n\nOverall, the weekly chart is still bearish for now, but the chances of a recovery might outweigh the gloomy picture in the coming weeks. As we know from the past, bear market rallies in bitcoin can be extreme. Realistic recovery targets are around 25,400 USD and maybe 29,750 USD as well.\n\n#### Bitcoin Daily Chart – Bollinger bands are tightening\n\n*Bitcoin in USD, daily chart as of July 13th, 2022. Source: Tradingview*\n\nOn the daily chart, a consolidation has developed again since the low on June 18th, which could turn out to be a flag formation similar to the ones before. In any case, the low at 17,592 USD was not undercut in the last three and a half weeks. The stochastic still has an active sell signal, but the oscillator has already almost reached the oversold zone.\n\nIf the stabilization around 20,000 USD succeeds at the same time, a recovery in the direction of the upper Bollinger band (22,021 USD) and up to the vicinity of the May low at 25,401 USD would be possible.\n\nIn summary, the daily chart is currently still bearish. At the same time, some stabilization tendencies are visible between 19,000 USD and 21,500 USD. Together with the relatively large distance to the fast falling 200-day moving average (36,122 USD), there are some arguments for a relief rally in the summer on the table.\n\n### Sentiment Bitcoin – Relief rally in the summer?\n\n*Crypto Fear & Greed Index, as of July 12th, 2022. Source: Lookintobitcoin*\n\nThe Crypto Fear & Greed Index has been trading in the deep dark red panic zone since the beginning of April, and thus for more than three months now. Hence, fear in the crypto sector runs very deep.\n\n\n*Crypto Fear & Greed Index long term, as of July 12th, 2022. Source: Lookintobitcoin*\n\nIn the big picture, the current dark red situation in the Crypto Fear & Greed Index resembles the setup from January 2019. Back then, the crypto winter had also hit brutally, and it took almost three months for bitcoin to get a massive recovery rally going. New lows were not seen in the bottoming phase back then.\n\nOverall, the beaten down panic sentiment provides the best contrarian buy signal in over two years!\n\n### Seasonality Bitcoin\n\n*Seasonality for bitcoin, as of July 11th, 2022. Source: Seasonax*\n\nDue to the weak price performance in the first six months of this year, the still young seasonal pattern for bitcoin has weakened or flattened significantly. Nevertheless, according to the statistics, there should be a wave down starting at the end of August, which could possibly run parallel to another sell-off in the stock markets. There, too, September has not earned itself a good name, but is traditionally regarded as the worst month of the year for the stock market. Until mid-August, however, the seasonal outlook does not stand in the way of a small recovery rally in the crypto sector.\n\nOverall, the seasonal component continues to urge patience and caution. The situation should not brighten up until mid/late October from a statistical perspective. A small summer rally, however, would be possible in the coming weeks.\n\n### Sound Money: Bitcoin vs. Gold\n\n*Bitcoin/Gold-Ratio as of July 12th, 2022.Source: Tradingview*\n\nAnalogous to the crash of bitcoin, the bitcoin/gold-ratio also fell in recent months and is currently trading around 11.5. Thus, Bitcoin has lost almost 75% against gold since November 2021! At current prices of around 20,000 USD for one Bitcoin and around 1,710 USD for a troy ounce of gold, one has to pay almost 11.5 ounces of gold for one bitcoin. Put another way, an ounce of gold currently costs about 0.085 bitcoin.\n\nGiven the strongly oversold situation on the weekly chart near the 78.6% retracement, the chances for a countermovement or recovery are not bad at the moment. In the best case, a retracement to the broken support in the area around 15 to 16 would be conceivable. If bitcoin bears remain in control, however, the ratio could also be pushed directly down to around 5 to 6 in the coming months.\n\n#### Allocation of sound money\n\nGenerally, buying and selling Bitcoin against gold only makes sense to the extent that one balances the allocation in those two asset classes! At least 10% up to a maximum of 25% of one’s total assets should be invested in precious metals physically, while in cryptos and especially in bitcoin one should hold at least 1% but max. 5%. If you are very familiar with cryptocurrencies and bitcoin, you can certainly allocate much higher percentages to bitcoin on an individual basis. For the average investor, who is primarily invested in equities and real estate, a maximum of 5% in the still highly speculative and highly volatile bitcoin is a good guideline!\n\nOverall, you want to own gold and bitcoin, since opposites complement each other. In our dualistic world of Yin and Yang, body and mind, up and down, warm and cold, we are bound by the necessary attraction of opposites. In this sense, you can view gold and bitcoin as such a pair of strength. With the physical component of gold and the pristine digital features of bitcoin, you have a complementary unit of a true safe haven for the 21st century. You want to own both! – Florian Grummes\nIn summary, the bitcoin/gold-ratio suggests a recovery in favor of bitcoin in the coming weeks. One should not hope for too much given the difficult overall situation, but a rise to around 15 seems possible. While gold often lost out in 2020 and 2021, it was able to fully play out its conservative character this year and is the longed-for safe haven in the portfolio despite slight price declines.\n\n### Macro Update – Panic & Recession of 2022\n\nThe world is changing faster than ever before. The political landscape is shifting rapidly around the world and becoming more unpredictable by the day. While technology is changing everything we do, tensions in society are increasing in almost every part of the world. Yet, an ounce of gold remains an ounce of gold. Likewise, one bitcoin remains one bitcoin.\n\n\n*Global Credit Impulse, as of July 7th, 2022. ©The Macro Compass & Alfonso Peccatiello*\n\nMore than 50 years after Nixon repealed the gold standard, monetary policy has its back against the wall, as the Fed’s fight against inflation could soon plunge the world into a depressive abyss. Just two weeks after the start of its quantitative tightening program, the markets are already behaving like a junkie in withdrawal. Due to massive fiscal pressures as well as hesitant refinancing activity in the private sector, we are now witnessing a contraction in credit creation that is even faster than during the Great Financial Crisis of 2008!\n\nThe Fed’s balancing act of fighting inflation without triggering severe dislocations in the markets is therefore doomed to fail. The vehemence of the tightening cycle that has just begun threatens to turn the “Everything Bubble” into an “Everything Crash.”\n\n#### When will the Fed end its tightening cycle?\n\n*US Yield Curve vs. Prior Tightening Cycles, as of July 12, 2022. ©Crescat Capital & Tavi Costa*\n\nIt is therefore realistic to expect that US monetary policy will have to deviate from the current hawkish monetary policy stance sooner rather than later and make a U-turn. However, it cannot be ruled out that the FED will once again act far too late. Currently, the yield curve in the US is already turning. In the past 30 years, this constellation has forced the Fed to end its tightening cycle every time. Since the systemic risk is now greater than ever before in history, the Fed can no longer afford to make a wrong decision.\n\n\n*Fed pivot indicator, as of July 11th, 2022. ©TheHappyHawaiian*\n\nIn fact, some indications now suggest that the FED will have to react soon. With the next rate hike, the FED would presumably and knowingly blow up the financial system. Hence, even the verbal suggestion that rate hikes would be suspended or at least slowed down should therefore be enough at the moment to trigger a summer relief rally in all markets. Likewise, somewhat weaker U.S. inflation data is expected due to the global contraction, which the markets should also take with great relief.\n\nIn addition, the U.S. dollar index has had a tremendous ride, rising almost uninterruptedly by a total of +21.25% over the past 14 months. A breather in the U.S. dollar should bring a sigh of relief in the equity, commodity, precious metals and crypto markets. Overall, the chances for a recovery in all markets during the coming summer weeks are therefore not bad. From mid-August or September at the latest, however, the bears are likely to come back.\n\n### Conclusion: Bitcoin – Relief rally in the summer?\n\nAfter a month-long sell-off, including a nasty wave of bankruptcies, bitcoin is currently trading just below 20,000 USD. Eight months ago, very few people would have expected this. Now, however, bullish market participants are rare and numerous experts are coming up with renewed lower price targets for bitcoin. The bitcoin network itself, on the other hand, completely unimpressed by the “Lehman moment” in the crypto sector, continues to process any cryptographically legitimate payments via a computer network of equal computers (peer-to-peer) without any problems.\n\nIn the context of the equity markets, which have also seen a severe correction and have correlated strongly with the crypto sector in recent months, a short-term recovery opportunity can be discerned due to the heavily oversold situation. In fact, a summer relief rally towards around 25,000 USD and maybe even close to around 30,000 USD could be possible, especially if inflation declines slightly and the Fed adopts a somewhat milder tone. Nevertheless, the end of the crypto winter is still likely to be a long time away. In any case, prices below 20,000 USD offer a good entry opportunity in the long run. But we believe that a bottom around 10,000 USD is more likely in the next 3 to 12 months.\n\n_Analysis sponsored and initially published on July 13th, 2022, by [www.celticgold.eu](https://celticgold.de/blog/gold-und-bitcoin-analysen-von-florian-grummes-32/bitcoin-erleichterungsrally-im-sommer-180). Translated into English and partially updated on July 14th, 2022._ \n\n_Feel free to join us in our free [Telegram channel](https://t.me/MidasTouchConsulting) for daily real time data and a great community._\n\n_If you like to get regular updates on our gold model, precious metals, commodities, & cryptocurrencies you can subscribe to our [free newsletter](http://bit.ly/1EUdt2K)._\n\n_Disclosure:\nThis article and the content are for informational purposes only and do not contain investment advice or recommendations. Every investment and trading move involves risk, and readers should conduct their own research when making a decision. The views, thoughts and opinions expressed here are the author’s alone. They do not necessarily reflect or represent the views and opinions of Midas Touch Consulting._",
"json_metadata": "{\"tags\":[\"bitcoin\",\"crypto\",\"leofinance\",\"investing\",\"gold\"],\"image\":[\"https://cdn.steemitimages.com/DQmZntXw1JT1zkWmSUstf8z15qQYD5hKc2QQdHHSsHXB1QX/celtic-gold-midas-touch-bitcoin-update-header.jpg\",\"https://cdn.steemitimages.com/DQmc7WL5HXL46UAhWGy1xirxnBk4xMYuuR2U3oNrGu1Wj6n/Chart%2001%20Bitcoin%20weekly%20chart%20130722.png\",\"https://cdn.steemitimages.com/DQmaJi62NU2RHQXSGVX43GQVi46C1dLALAxVjnMTDyYyhir/Chart%2002%20Bitcoin%20daily%20chart%20130722.png\",\"https://cdn.steemitimages.com/DQmU5TTHrEosjeaC436FwLEBiqkJsWfVENaLHPUr2E7qQvA/Chart%2003%20Crypto%20Fear%20&%20Greed%20Index%20120722.png\",\"https://cdn.steemitimages.com/DQmbhDKhuZrui4gMNDVxWALWPpNP7FBfpUUwhhaUMJ1LN5T/Chart%2004%20Crypto%20Fear%20&%20Greed%20Index%20110722.png\",\"https://cdn.steemitimages.com/DQmRGTXH49JWAW2xvqxSpgqgV4NPiNAy4UF3s56Cj7LnBMh/Chart%2005%20Bitcoin%20Seasonality%20110722.png\",\"https://cdn.steemitimages.com/DQmVgZM2rbYr24MCdj1RdE7cnAgeR2jtBFC1RnR7XkAnCKY/Chart%2006%20Bitcoin:Gold-Ratio%20120722.png\",\"https://cdn.steemitimages.com/DQmRVm1bGxPBX1WqHJeJjA3BfNatFgFND4tv7ZuoHDYFTEs/Chart%2007%20Global%20Credit%20Impulse%20070722.png\",\"https://cdn.steemitimages.com/DQmQNrYmziHYBVDwytm7rJowyHY8NTERwXsoULsMzQTBpCs/Chart%2008%20US%20Yield%20Curve%20vs.%20Prior%20Tightening%20Cycles.jpeg\",\"https://cdn.steemitimages.com/DQmXo5s7JyQL6SFp3MQHRrAZx74NLhdXra2BCfAjFqS6s41/Chart%2009%20Fed%20pivot%20indicator%20110722.jpeg\"],\"links\":[\"https://www.midastouch-consulting.com/14072022-bitcoin-relief-rally-in-the-summer\",\"https://celticgold.de/blog/gold-und-bitcoin-analysen-von-florian-grummes-32/bitcoin-erleichterungsrally-im-sommer-180\",\"https://t.me/MidasTouchConsulting\",\"http://bit.ly/1EUdt2K\"],\"app\":\"steemit/0.2\",\"format\":\"markdown\"}",
"parent_author": "",
"parent_permlink": "bitcoin",
"permlink": "july-14th-2022-bitcoin-relief-rally-in-the-summer",
"title": "July 14th, 2022, Bitcoin – Relief rally in the summer?"
}
],
"op_in_trx": 0,
"timestamp": "2022-07-16T10:09:03",
"trx_id": "308da87d6dd01d65062e5a9fc14271144645967a",
"trx_in_block": 2,
"virtual_op": 0
}midastouchreceived 0.070 STEEM, 0.008 SBD, 0.113 SP author reward for @midastouch / may-29th-2022-silver-first-recovery-then-second-leg-to-stand-on2022/06/05 10:34:30
midastouchreceived 0.070 STEEM, 0.008 SBD, 0.113 SP author reward for @midastouch / may-29th-2022-silver-first-recovery-then-second-leg-to-stand-on
2022/06/05 10:34:30
| author | midastouch |
| permlink | may-29th-2022-silver-first-recovery-then-second-leg-to-stand-on |
| sbd payout | 0.008 SBD |
| steem payout | 0.070 STEEM |
| vesting payout | 183.415046 VESTS |
| Transaction Info | Block #64790207/Virtual Operation #4 |
View Raw JSON Data
{
  "block": 64790207,
  "op": [
    "author_reward",
    {
      "author": "midastouch",
      "permlink": "may-29th-2022-silver-first-recovery-then-second-leg-to-stand-on",
      "sbd_payout": "0.008 SBD",
      "steem_payout": "0.070 STEEM",
      "vesting_payout": "183.415046 VESTS"
    }
  ],
  "op_in_trx": 0,
  "timestamp": "2022-06-05T10:34:30",
  "trx_id": "0000000000000000000000000000000000000000",
  "trx_in_block": 4294967295,
  "virtual_op": 4
}2022/06/04 01:49:48
2022/06/04 01:49:48
| author | midastouch |
| permlink | may-29th-2022-silver-first-recovery-then-second-leg-to-stand-on |
| voter | pocket-change |
| weight | 10000 (100.00%) |
| Transaction Info | Block #64751061/Trx 4a57aa7ce46e8d141914b91200b7ccf9b1d71c5c |
View Raw JSON Data
{
  "block": 64751061,
  "op": [
    "vote",
    {
      "author": "midastouch",
      "permlink": "may-29th-2022-silver-first-recovery-then-second-leg-to-stand-on",
      "voter": "pocket-change",
      "weight": 10000
    }
  ],
  "op_in_trx": 0,
  "timestamp": "2022-06-04T01:49:48",
  "trx_id": "4a57aa7ce46e8d141914b91200b7ccf9b1d71c5c",
  "trx_in_block": 3,
  "virtual_op": 0
}pocket-changereplied to @midastouch / rcxjqk2022/06/04 01:49:33
pocket-changereplied to @midastouch / rcxjqk
2022/06/04 01:49:33
| author | pocket-change |
| body | I wonder which people are Buying Physical Silver and which people are Selling Paper Silver... Could they be the same people, doing both...??? |
| json metadata | {"app":"steemit/0.2"} |
| parent author | midastouch |
| parent permlink | may-29th-2022-silver-first-recovery-then-second-leg-to-stand-on |
| permlink | rcxjqk |
| title | |
| Transaction Info | Block #64751056/Trx 477c1854210ddef9bbdaef9c6414711455ddc42f |
View Raw JSON Data
{
  "block": 64751056,
  "op": [
    "comment",
    {
      "author": "pocket-change",
      "body": "I wonder which people are Buying Physical Silver and which people are Selling Paper Silver...  Could they be the same people, doing both...???",
      "json_metadata": "{\"app\":\"steemit/0.2\"}",
      "parent_author": "midastouch",
      "parent_permlink": "may-29th-2022-silver-first-recovery-then-second-leg-to-stand-on",
      "permlink": "rcxjqk",
      "title": ""
    }
  ],
  "op_in_trx": 0,
  "timestamp": "2022-06-04T01:49:33",
  "trx_id": "477c1854210ddef9bbdaef9c6414711455ddc42f",
  "trx_in_block": 4,
  "virtual_op": 0
}cve3upvoted (100.00%) @midastouch / may-29th-2022-silver-first-recovery-then-second-leg-to-stand-on2022/06/01 01:40:09
cve3upvoted (100.00%) @midastouch / may-29th-2022-silver-first-recovery-then-second-leg-to-stand-on
2022/06/01 01:40:09
| author | midastouch |
| permlink | may-29th-2022-silver-first-recovery-then-second-leg-to-stand-on |
| voter | cve3 |
| weight | 10000 (100.00%) |
| Transaction Info | Block #64664780/Trx 19e352dc42ba73b23c332c0f290f6f3ece219456 |
View Raw JSON Data
{
  "block": 64664780,
  "op": [
    "vote",
    {
      "author": "midastouch",
      "permlink": "may-29th-2022-silver-first-recovery-then-second-leg-to-stand-on",
      "voter": "cve3",
      "weight": 10000
    }
  ],
  "op_in_trx": 0,
  "timestamp": "2022-06-01T01:40:09",
  "trx_id": "19e352dc42ba73b23c332c0f290f6f3ece219456",
  "trx_in_block": 0,
  "virtual_op": 0
}midastouchupvoted (100.00%) @midastouch / may-29th-2022-silver-first-recovery-then-second-leg-to-stand-on2022/05/29 10:34:57
midastouchupvoted (100.00%) @midastouch / may-29th-2022-silver-first-recovery-then-second-leg-to-stand-on
2022/05/29 10:34:57
| author | midastouch |
| permlink | may-29th-2022-silver-first-recovery-then-second-leg-to-stand-on |
| voter | midastouch |
| weight | 10000 (100.00%) |
| Transaction Info | Block #64589359/Trx 40b65bfa6ca206b6e3b795918d324278f7ce959d |
View Raw JSON Data
{
  "block": 64589359,
  "op": [
    "vote",
    {
      "author": "midastouch",
      "permlink": "may-29th-2022-silver-first-recovery-then-second-leg-to-stand-on",
      "voter": "midastouch",
      "weight": 10000
    }
  ],
  "op_in_trx": 0,
  "timestamp": "2022-05-29T10:34:57",
  "trx_id": "40b65bfa6ca206b6e3b795918d324278f7ce959d",
  "trx_in_block": 3,
  "virtual_op": 0
}midastouchpublished a new post: may-29th-2022-silver-first-recovery-then-second-leg-to-stand-on2022/05/29 10:34:30
midastouchpublished a new post: may-29th-2022-silver-first-recovery-then-second-leg-to-stand-on
2022/05/29 10:34:30
| author | midastouch |
| body |  # [May 29th 2022, Silver – First recovery, then second leg to stand on](https://www.midastouch-consulting.com/precious-metals-analysis-29052022-silver-first-recovery-then-second-leg-to-stand-on) As suspected four weeks ago, silver prices continued to sell-off further amidst a panicked market environment. Despite record high inflation data, the strong U.S. dollar together with the collapsing stock markets also caused tremendous selling pressure in the precious metals sector. It was not until May 13th that a panic low of US$20.46 was reached. Since then, silver prices we able to recover by 8.5% to US$ 22.20. This recovery has still likely more room to move higher. However, the seasonal component remains unfavorable until mid-summer. Hence, after the completion of the ongoing recovery wave, low or even lower prices must be expected once again. Silver – First recovery, then second leg to stand on. ### Gold/Silver-ratio points to a reversal in favor of silver 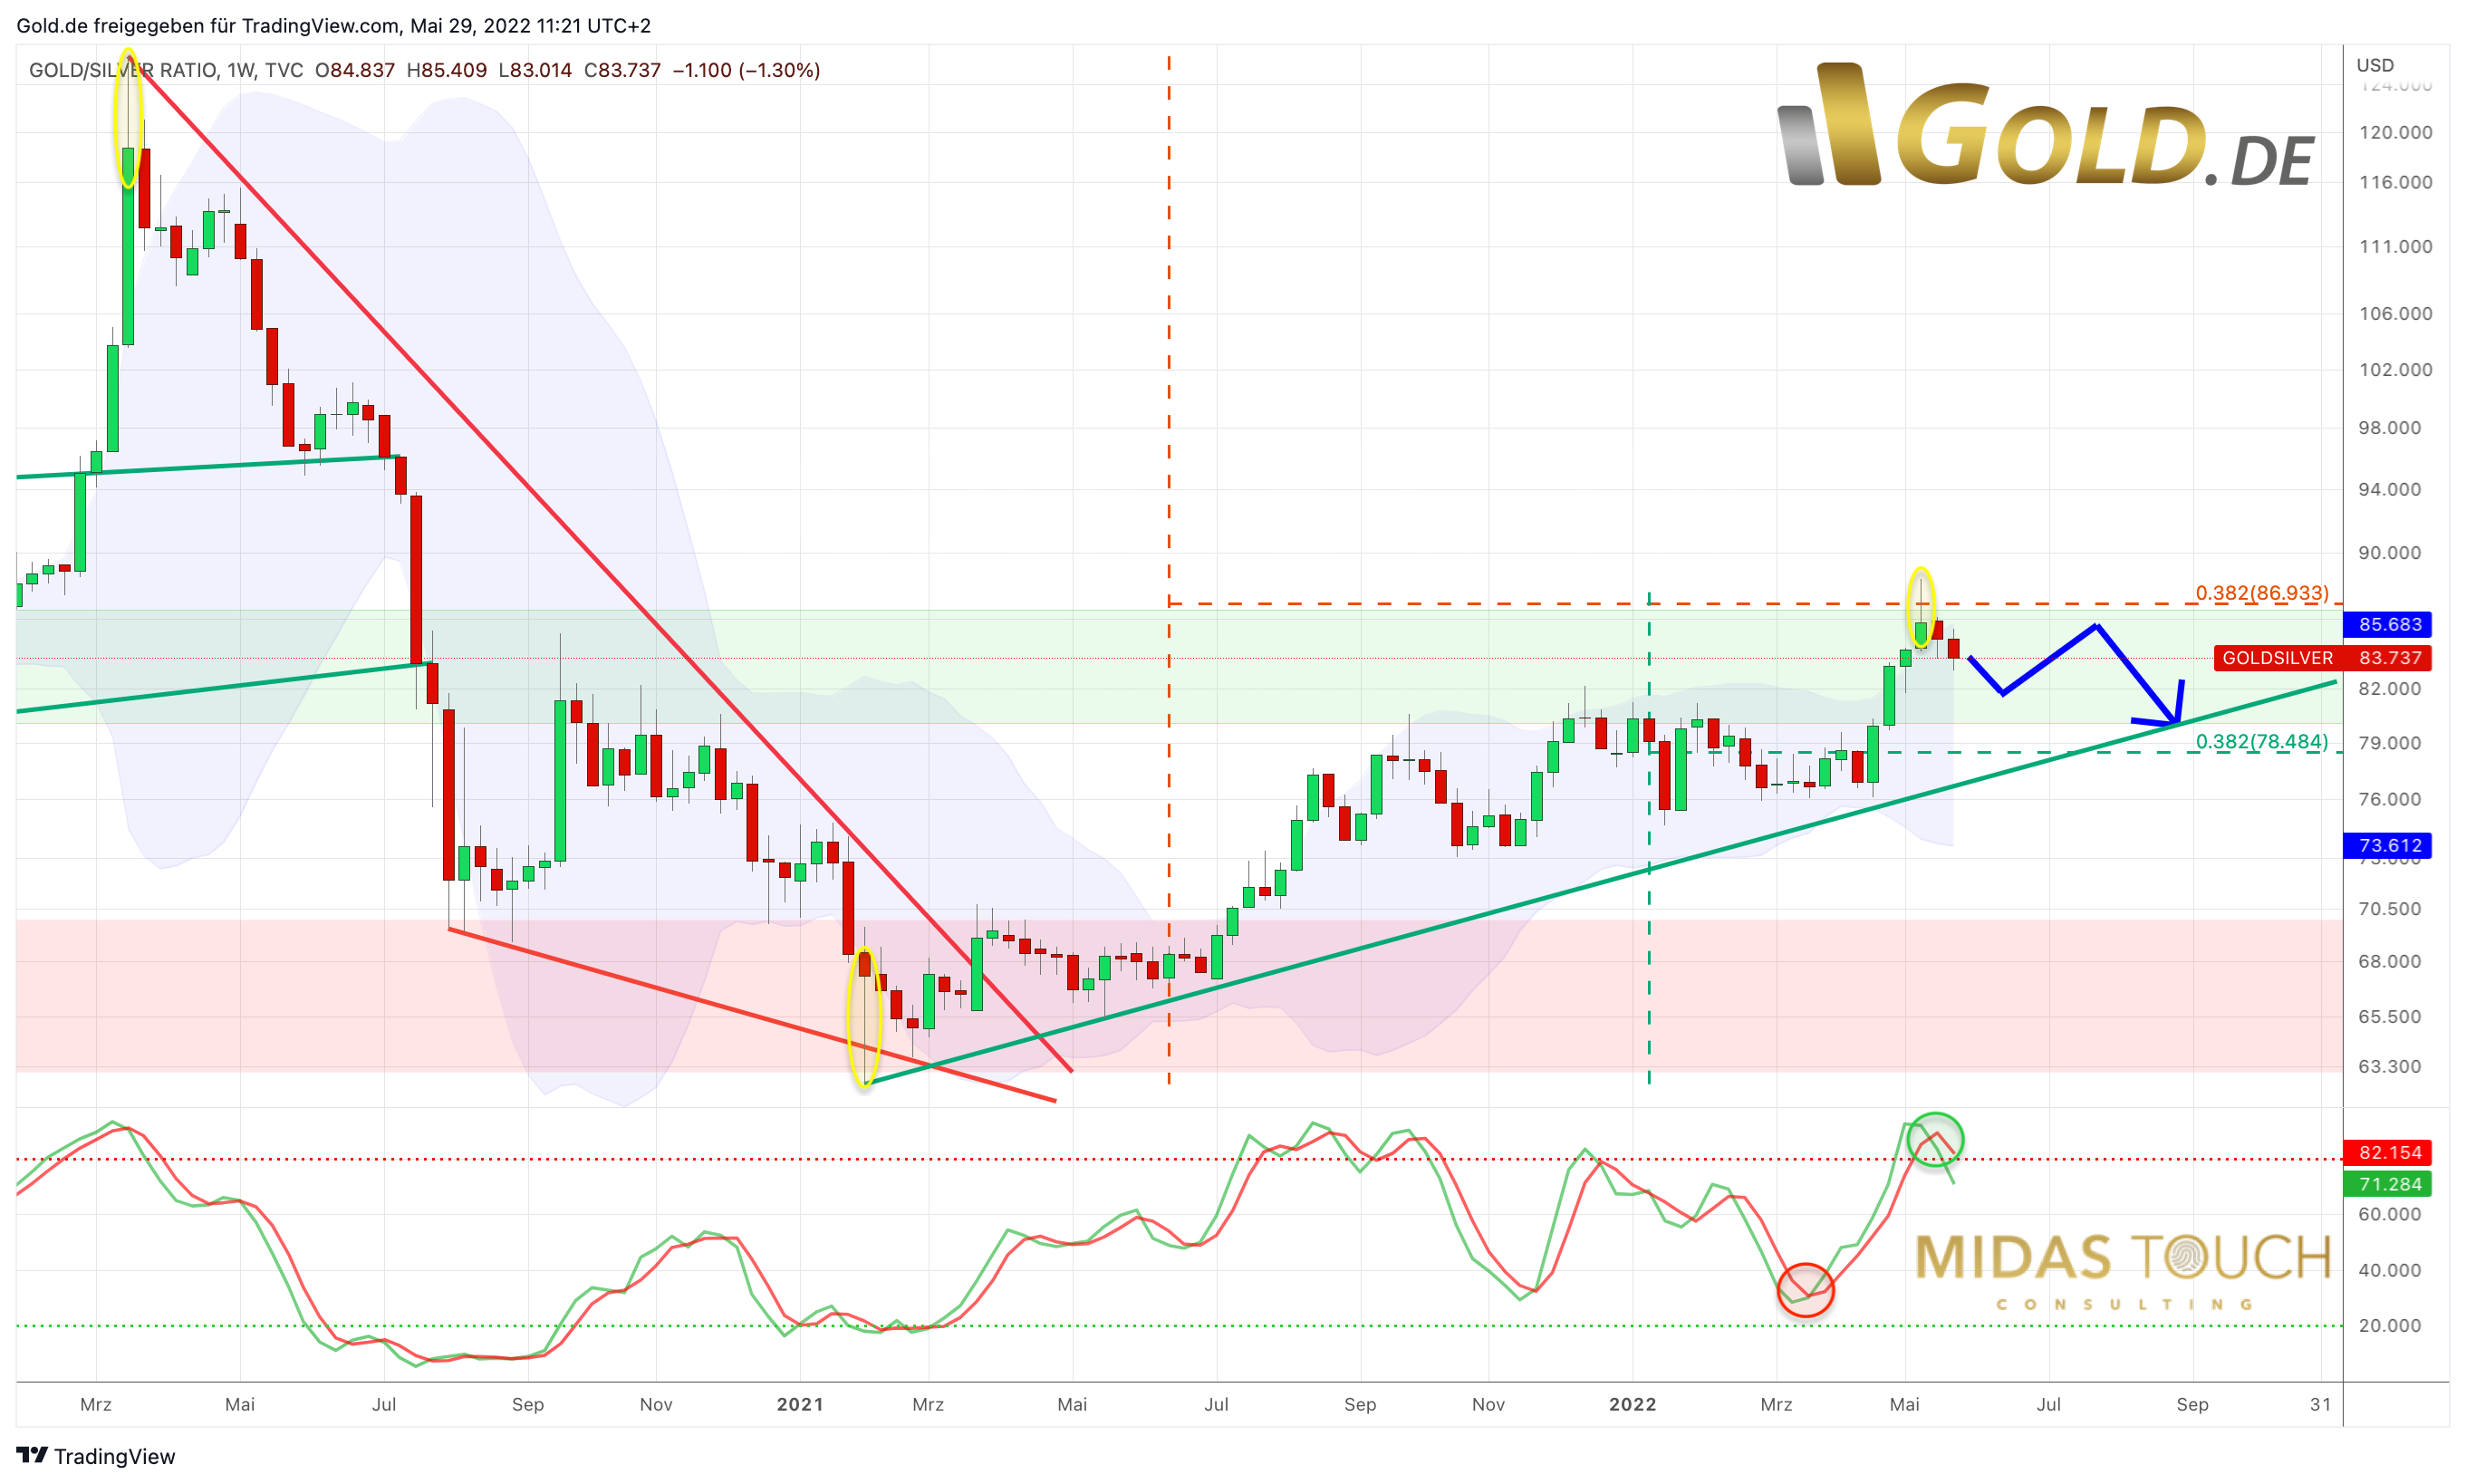 *Gold/Silver-ratio, weekly chart as of May 29th, 2022. ©Gold.de & Midas Touch Consulting* Since February 1st, 2021, silver investors have hardly had any reason to celebrate, as the silver price never managed to keep up with the good development of the gold price. Thus, the gold/silver-ratio rose within 15 months from a low of 62.51 to a high of 88.35. While gold only slightly missed its all-time high at the beginning of March, silver instead mostly pushed tenaciously through its large sideways range between roughly speaking US$21 and US$30. Last year’s high at around US$30 could not be reached at any time. Instead, in May, in a classic bull trap, silver also temporarily undershot its broad support zone between US$21.50 and US$23.00. Thus, the sensitive silver increasingly anticipated already since February 2021 the global liquidity tightening that caused havoc in all markets in recent months! Since May 12th, however, the gold/silver-ratio now signals a possible trend reversal in favor of the silver price. At least the ratio has reacted to the 38.2% retracement and formed a reversal candle on the weekly chart. Only the coming weeks and months will show whether this can develop into some more positive. Nevertheless, the chance that silver investors will finally be rewarded for their patience in the coming years remains undoubtely there. However, this will require a stabilization in the financial markets. Given the bombed-out sentiment, the chances for a major recovery in the coming weeks are pretty good. Of course, precious metals will also benefit from this, as they typically begin to price in a change of course in monetary policies at an early stage. A correction in the strongly overbought U.S. dollar might also give precious metals support & momentum in the medium term. ### Assume only a temporary recovery in financial markets Nevertheless, the situation remains tense for the time being, because so far the crash in stocks has unfolded rather gradually. An extreme panic peak has not been observed so far. Typically, however, it takes such a capitulation to bring a correction or a bear market to a sustainable end. In this respect, one is currently well advised to assume only a temporary recovery in the financial markets. For precious metals, this initially means the chance of a continued recovery. But subsequently, there should be another significant pullback in July or August, which could provide the second leg to stand on. It could also take another one or two months longer, since a final crash in stock markets towards September is likely and could pull down all sector in the markets once again. Generally speaking, silver prices below US$20 would open up significantly greater downside potential. ### Silver in US-Dollar – At best, a recovery towards its 200-MA 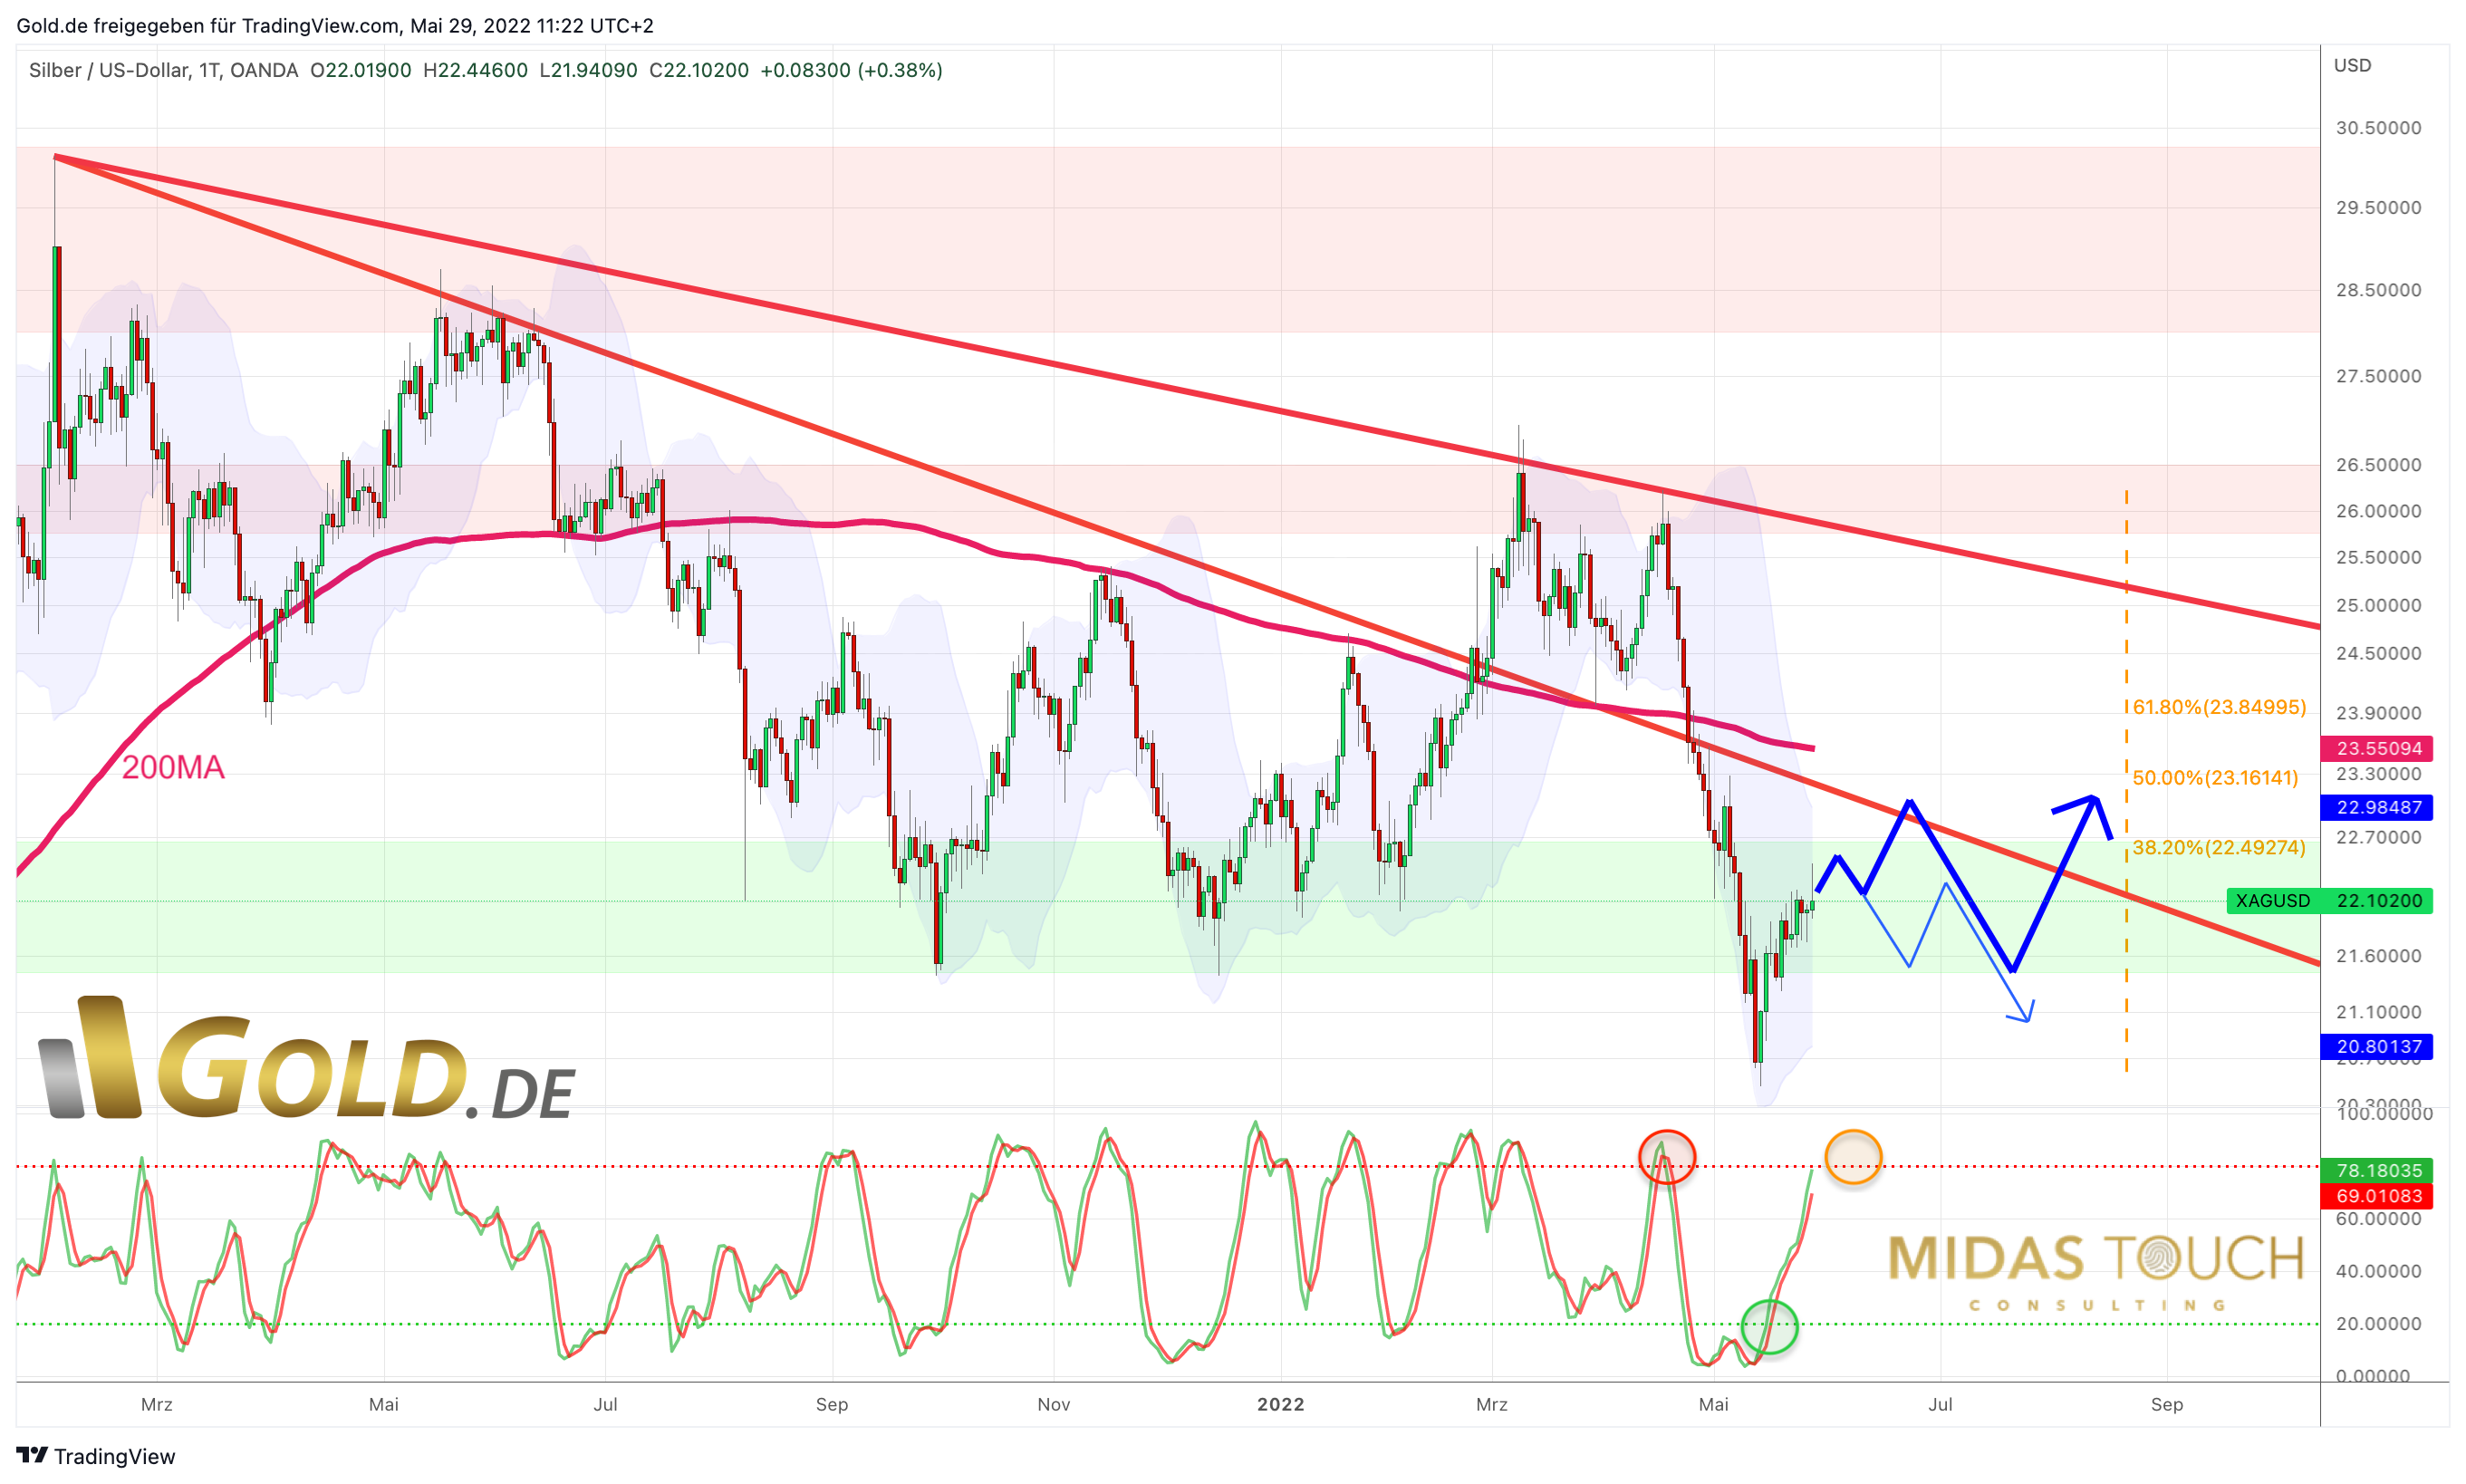 *Silver in US-Dollar, daily chart as of May 29th, 2022. ©Gold.de & Midas Touch Consulting* With a low at US$20.45 on May 13, silver briefly undercut all the lows of the past two years and thus probably once again shook off many weak hands. Following this bull trap, silver prices were able to recover back to the broad support zone over the last two weeks. However, this recovery has not yet reached its minimum target (the 38.2% retracement of the last wave down) around US$22.50. Yet, the daily stochastic has already started to reach its overbought zone again and thus provides a first warning signal regarding the sustainability of this bounce. Given the high pessimism as well as the relatively favorable situation in the futures market (CoT report), a more or less direct recovery towards the falling 200-day moving average (US$23.55) would also be quite possible. But don’t forget, the seasonal trend for silver only eases from July/August onwards. In summary, the silver price is still in its large sideways range between approx. 20.50 and approx. 30 US dollars. The recovery that has started still has room in the short term. Until midsummer, however, a second foothold in the range around 21 U.S. dollars or somewhat lower would not be a surprise. In the medium and especially in the long term, the silver price “only” has to sustainably clear the $30 mark, in order to then be able to quickly take off in the direction of the all-time high around $50. Until then, however, silver fans will have to be patient. ### Silver in Euro – New buy limit at 20.20 EUR The seasonal pattern for silver typically delivers an important low somewhere between June and August. Hence, a buy limit for silver finally makes sense again. With a bit of luck, silver will come back towards at least the US$21 level or somewhat lower. Due to the correcting US-Dollar we could see silver slightly below 20 EUR. We therefore place a new buy limit at 20.20 EUR, to make sure we get during the summer lows. Those who still need to increase their physical precious metal holdings significantly (recommendation min. 5% and max. 25% of total assets) do find good prices at current levels already. In the end, it is not the best price that matters, but only the fact that you hold it in your own hands. ------ _Analysis initially published on May 27th, 2022, by www.gold.de. Translated into English and partially updated on May 29th, 2022._ _Feel free to join us in our free [Telegram channel](https://t.me/MidasTouchConsulting) for daily real time data and a great community._ _If you like to get regular updates on our gold model, precious metals and cryptocurrencies you can subscribe to our [free newsletter](http://bit.ly/1EUdt2K)._ _This article does not contain investment advice or recommendations. Every investment and trading move involves risk, and readers should conduct their own research when making a decision._ |
| json metadata | {"tags":["silvergoldstackers","steemsilvergold","silver","gold","preciousmetals","trading","investing","usdollar"],"image":["https://cdn.steemitimages.com/DQmdNN1c4ZbUH2uVBmFNZLwbYbiafqhaKsicH4giDUCqxxE/blog-header-gold-de-EN.jpg","https://cdn.steemitimages.com/DQmcSyD3X7k95or1w3t6aJ2ffbSi3cxkqByzvNFtFmAmRNz/197%20Chart%201%20Gold:Silver-Ratio%20in%20USD%20weekly%20chart%2029052022.png","https://cdn.steemitimages.com/DQmZDLggypoM75N2jPLu8nGtfoN1YJmH9fg96THvhxMsCTW/197%20Chart%202%20Silver%20in%20USD%20daily%20chart%2029052022.png"],"links":["https://www.midastouch-consulting.com/precious-metals-analysis-29052022-silver-first-recovery-then-second-leg-to-stand-on","https://t.me/MidasTouchConsulting","http://bit.ly/1EUdt2K"],"app":"steemit/0.2","format":"markdown"} |
| parent author | |
| parent permlink | silvergoldstackers |
| permlink | may-29th-2022-silver-first-recovery-then-second-leg-to-stand-on |
| title | May 29th 2022, Silver – First recovery, then second leg to stand on |
| Transaction Info | Block #64589350/Trx 775785b99db3ee9eb88a5ed97e083fe192479399 |
View Raw JSON Data
{
"block": 64589350,
"op": [
"comment",
{
"author": "midastouch",
"body": "\n\n# [May 29th 2022, Silver – First recovery, then second leg to stand on](https://www.midastouch-consulting.com/precious-metals-analysis-29052022-silver-first-recovery-then-second-leg-to-stand-on)\n\nAs suspected four weeks ago, silver prices continued to sell-off further amidst a panicked market environment. Despite record high inflation data, the strong U.S. dollar together with the collapsing stock markets also caused tremendous selling pressure in the precious metals sector. It was not until May 13th that a panic low of US$20.46 was reached. Since then, silver prices we able to recover by 8.5% to US$ 22.20. This recovery has still likely more room to move higher. However, the seasonal component remains unfavorable until mid-summer. Hence, after the completion of the ongoing recovery wave, low or even lower prices must be expected once again. Silver – First recovery, then second leg to stand on.\n\n### Gold/Silver-ratio points to a reversal in favor of silver\n\n*Gold/Silver-ratio, weekly chart as of May 29th, 2022. ©Gold.de & Midas Touch Consulting*\n\nSince February 1st, 2021, silver investors have hardly had any reason to celebrate, as the silver price never managed to keep up with the good development of the gold price. Thus, the gold/silver-ratio rose within 15 months from a low of 62.51 to a high of 88.35. While gold only slightly missed its all-time high at the beginning of March, silver instead mostly pushed tenaciously through its large sideways range between roughly speaking US$21 and US$30. Last year’s high at around US$30 could not be reached at any time. Instead, in May, in a classic bull trap, silver also temporarily undershot its broad support zone between US$21.50 and US$23.00. Thus, the sensitive silver increasingly anticipated already since February 2021 the global liquidity tightening that caused havoc in all markets in recent months!\n\nSince May 12th, however, the gold/silver-ratio now signals a possible trend reversal in favor of the silver price. At least the ratio has reacted to the 38.2% retracement and formed a reversal candle on the weekly chart. Only the coming weeks and months will show whether this can develop into some more positive. Nevertheless, the chance that silver investors will finally be rewarded for their patience in the coming years remains undoubtely there. However, this will require a stabilization in the financial markets. Given the bombed-out sentiment, the chances for a major recovery in the coming weeks are pretty good. Of course, precious metals will also benefit from this, as they typically begin to price in a change of course in monetary policies at an early stage. A correction in the strongly overbought U.S. dollar might also give precious metals support & momentum in the medium term.\n\n### Assume only a temporary recovery in financial markets\n\nNevertheless, the situation remains tense for the time being, because so far the crash in stocks has unfolded rather gradually. An extreme panic peak has not been observed so far. Typically, however, it takes such a capitulation to bring a correction or a bear market to a sustainable end. In this respect, one is currently well advised to assume only a temporary recovery in the financial markets. For precious metals, this initially means the chance of a continued recovery. But subsequently, there should be another significant pullback in July or August, which could provide the second leg to stand on. It could also take another one or two months longer, since a final crash in stock markets towards September is likely and could pull down all sector in the markets once again. Generally speaking, silver prices below US$20 would open up significantly greater downside potential.\n\n### Silver in US-Dollar – At best, a recovery towards its 200-MA\n\n*Silver in US-Dollar, daily chart as of May 29th, 2022. ©Gold.de & Midas Touch Consulting*\n\nWith a low at US$20.45 on May 13, silver briefly undercut all the lows of the past two years and thus probably once again shook off many weak hands. Following this bull trap, silver prices were able to recover back to the broad support zone over the last two weeks. However, this recovery has not yet reached its minimum target (the 38.2% retracement of the last wave down) around US$22.50. Yet, the daily stochastic has already started to reach its overbought zone again and thus provides a first warning signal regarding the sustainability of this bounce. Given the high pessimism as well as the relatively favorable situation in the futures market (CoT report), a more or less direct recovery towards the falling 200-day moving average (US$23.55) would also be quite possible. But don’t forget, the seasonal trend for silver only eases from July/August onwards.\n\nIn summary, the silver price is still in its large sideways range between approx. 20.50 and approx. 30 US dollars. The recovery that has started still has room in the short term. Until midsummer, however, a second foothold in the range around 21 U.S. dollars or somewhat lower would not be a surprise. In the medium and especially in the long term, the silver price “only” has to sustainably clear the $30 mark, in order to then be able to quickly take off in the direction of the all-time high around $50. Until then, however, silver fans will have to be patient.\n\n### Silver in Euro – New buy limit at 20.20 EUR\n\nThe seasonal pattern for silver typically delivers an important low somewhere between June and August. Hence, a buy limit for silver finally makes sense again. With a bit of luck, silver will come back towards at least the US$21 level or somewhat lower. Due to the correcting US-Dollar we could see silver slightly below 20 EUR. We therefore place a new buy limit at 20.20 EUR, to make sure we get during the summer lows.\n\nThose who still need to increase their physical precious metal holdings significantly (recommendation min. 5% and max. 25% of total assets) do find good prices at current levels already. In the end, it is not the best price that matters, but only the fact that you hold it in your own hands.\n\n------\n_Analysis initially published on May 27th, 2022, by www.gold.de. Translated into English and partially updated on May 29th, 2022._\n\n_Feel free to join us in our free [Telegram channel](https://t.me/MidasTouchConsulting) for daily real time data and a great community._ _If you like to get regular updates on our gold model, precious metals and cryptocurrencies you can subscribe to our [free newsletter](http://bit.ly/1EUdt2K)._ \n\n_This article does not contain investment advice or recommendations. Every investment and trading move involves risk, and readers should conduct their own research when making a decision._",
"json_metadata": "{\"tags\":[\"silvergoldstackers\",\"steemsilvergold\",\"silver\",\"gold\",\"preciousmetals\",\"trading\",\"investing\",\"usdollar\"],\"image\":[\"https://cdn.steemitimages.com/DQmdNN1c4ZbUH2uVBmFNZLwbYbiafqhaKsicH4giDUCqxxE/blog-header-gold-de-EN.jpg\",\"https://cdn.steemitimages.com/DQmcSyD3X7k95or1w3t6aJ2ffbSi3cxkqByzvNFtFmAmRNz/197%20Chart%201%20Gold:Silver-Ratio%20in%20USD%20weekly%20chart%2029052022.png\",\"https://cdn.steemitimages.com/DQmZDLggypoM75N2jPLu8nGtfoN1YJmH9fg96THvhxMsCTW/197%20Chart%202%20Silver%20in%20USD%20daily%20chart%2029052022.png\"],\"links\":[\"https://www.midastouch-consulting.com/precious-metals-analysis-29052022-silver-first-recovery-then-second-leg-to-stand-on\",\"https://t.me/MidasTouchConsulting\",\"http://bit.ly/1EUdt2K\"],\"app\":\"steemit/0.2\",\"format\":\"markdown\"}",
"parent_author": "",
"parent_permlink": "silvergoldstackers",
"permlink": "may-29th-2022-silver-first-recovery-then-second-leg-to-stand-on",
"title": "May 29th 2022, Silver – First recovery, then second leg to stand on"
}
],
"op_in_trx": 0,
"timestamp": "2022-05-29T10:34:30",
"trx_id": "775785b99db3ee9eb88a5ed97e083fe192479399",
"trx_in_block": 0,
"virtual_op": 0
}midastouchupvoted (100.00%) @midastouch / may-20th-2022-gold-first-signs-of-stabilization2022/05/29 10:32:24
midastouchupvoted (100.00%) @midastouch / may-20th-2022-gold-first-signs-of-stabilization
2022/05/29 10:32:24
| author | midastouch |
| permlink | may-20th-2022-gold-first-signs-of-stabilization |
| voter | midastouch |
| weight | 10000 (100.00%) |
| Transaction Info | Block #64589308/Trx 618654a96c2bd68c0fa4911917549f35add9680f |
View Raw JSON Data
{
  "block": 64589308,
  "op": [
    "vote",
    {
      "author": "midastouch",
      "permlink": "may-20th-2022-gold-first-signs-of-stabilization",
      "voter": "midastouch",
      "weight": 10000
    }
  ],
  "op_in_trx": 0,
  "timestamp": "2022-05-29T10:32:24",
  "trx_id": "618654a96c2bd68c0fa4911917549f35add9680f",
  "trx_in_block": 2,
  "virtual_op": 0
}midastouchupvoted (100.00%) @midastouch / may-15th-2022-the-midas-touch-gold-model-tm-update2022/05/29 10:32:21
midastouchupvoted (100.00%) @midastouch / may-15th-2022-the-midas-touch-gold-model-tm-update
2022/05/29 10:32:21
| author | midastouch |
| permlink | may-15th-2022-the-midas-touch-gold-model-tm-update |
| voter | midastouch |
| weight | 10000 (100.00%) |
| Transaction Info | Block #64589307/Trx 818d93a591687303ce95be8ee375e3d5d9814539 |
View Raw JSON Data
{
  "block": 64589307,
  "op": [
    "vote",
    {
      "author": "midastouch",
      "permlink": "may-15th-2022-the-midas-touch-gold-model-tm-update",
      "voter": "midastouch",
      "weight": 10000
    }
  ],
  "op_in_trx": 0,
  "timestamp": "2022-05-29T10:32:21",
  "trx_id": "818d93a591687303ce95be8ee375e3d5d9814539",
  "trx_in_block": 0,
  "virtual_op": 0
}cve3upvoted (100.00%) @midastouch / may-20th-2022-gold-first-signs-of-stabilization2022/05/23 02:43:39
cve3upvoted (100.00%) @midastouch / may-20th-2022-gold-first-signs-of-stabilization
2022/05/23 02:43:39
| author | midastouch |
| permlink | may-20th-2022-gold-first-signs-of-stabilization |
| voter | cve3 |
| weight | 10000 (100.00%) |
| Transaction Info | Block #64408142/Trx 6f84ab8e397dc32562525a376f40074515f11f2d |
View Raw JSON Data
{
  "block": 64408142,
  "op": [
    "vote",
    {
      "author": "midastouch",
      "permlink": "may-20th-2022-gold-first-signs-of-stabilization",
      "voter": "cve3",
      "weight": 10000
    }
  ],
  "op_in_trx": 0,
  "timestamp": "2022-05-23T02:43:39",
  "trx_id": "6f84ab8e397dc32562525a376f40074515f11f2d",
  "trx_in_block": 4,
  "virtual_op": 0
}cve3upvoted (100.00%) @midastouch / may-15th-2022-the-midas-touch-gold-model-tm-update2022/05/23 02:43:33
cve3upvoted (100.00%) @midastouch / may-15th-2022-the-midas-touch-gold-model-tm-update
2022/05/23 02:43:33
| author | midastouch |
| permlink | may-15th-2022-the-midas-touch-gold-model-tm-update |
| voter | cve3 |
| weight | 10000 (100.00%) |
| Transaction Info | Block #64408140/Trx c4f390c8a62db3d4401a6869f3e079b7dd0813bb |
View Raw JSON Data
{
  "block": 64408140,
  "op": [
    "vote",
    {
      "author": "midastouch",
      "permlink": "may-15th-2022-the-midas-touch-gold-model-tm-update",
      "voter": "cve3",
      "weight": 10000
    }
  ],
  "op_in_trx": 0,
  "timestamp": "2022-05-23T02:43:33",
  "trx_id": "c4f390c8a62db3d4401a6869f3e079b7dd0813bb",
  "trx_in_block": 0,
  "virtual_op": 0
}pocket-changereplied to @midastouch / rcba022022/05/23 01:12:03
pocket-changereplied to @midastouch / rcba02
2022/05/23 01:12:03
| author | pocket-change |
| body | You sure put a lot of work into your posts... |
| json metadata | {"app":"steemit/0.2"} |
| parent author | midastouch |
| parent permlink | may-20th-2022-gold-first-signs-of-stabilization |
| permlink | rcba02 |
| title | |
| Transaction Info | Block #64406313/Trx 5de05f720792eae6253fa988f6cbf52dc774c542 |
View Raw JSON Data
{
  "block": 64406313,
  "op": [
    "comment",
    {
      "author": "pocket-change",
      "body": "You sure put a lot of work into your posts...",
      "json_metadata": "{\"app\":\"steemit/0.2\"}",
      "parent_author": "midastouch",
      "parent_permlink": "may-20th-2022-gold-first-signs-of-stabilization",
      "permlink": "rcba02",
      "title": ""
    }
  ],
  "op_in_trx": 0,
  "timestamp": "2022-05-23T01:12:03",
  "trx_id": "5de05f720792eae6253fa988f6cbf52dc774c542",
  "trx_in_block": 7,
  "virtual_op": 0
}midastouchpublished a new post: may-20th-2022-gold-first-signs-of-stabilization2022/05/22 13:46:36
midastouchpublished a new post: may-20th-2022-gold-first-signs-of-stabilization
2022/05/22 13:46:36
| author | midastouch |
| body |  # [May 20th, 2022: Gold – First signs of stabilization](https://www.midastouch-consulting.com/20052022-gold-first-signs-of-stabilization) The last five months have been quite a rollercoaster in the gold market. First gold managed to stage an impressive rally from US$1,750 up to US$2,070. Then it came all the way back down to a low of US$1,787 a week ago. Since then, a first bounce has brought it back to slightly below US$1,850. Gold – First signs of stabilization. ## Review With its most recent high at US$1,998, gold prices failed just below the round mark of US$2,000 on Easter Monday. Since then, along with an implosion in the entire financial market, a brutal wave down made its way in the gold market. Without much resistance and within just four weeks, gold prices fell by 10.5% from US$1,998 to US$1,787. However, since the beginning of this week, gold is now showing first signs of stabilization. The 200-day moving average (US$ 1,838) as well as the important multi-year uptrend line around US$1,820 have been reconquered in the short-term at least. In particular, the strength of the U.S. dollar affected the gold price in recent weeks. In a deep red market environment, the U.S. dollar played out its function as a “safe haven” to the fullest. But here, too, there have been signs of at least a small countermovement, which provided support for precious metals. 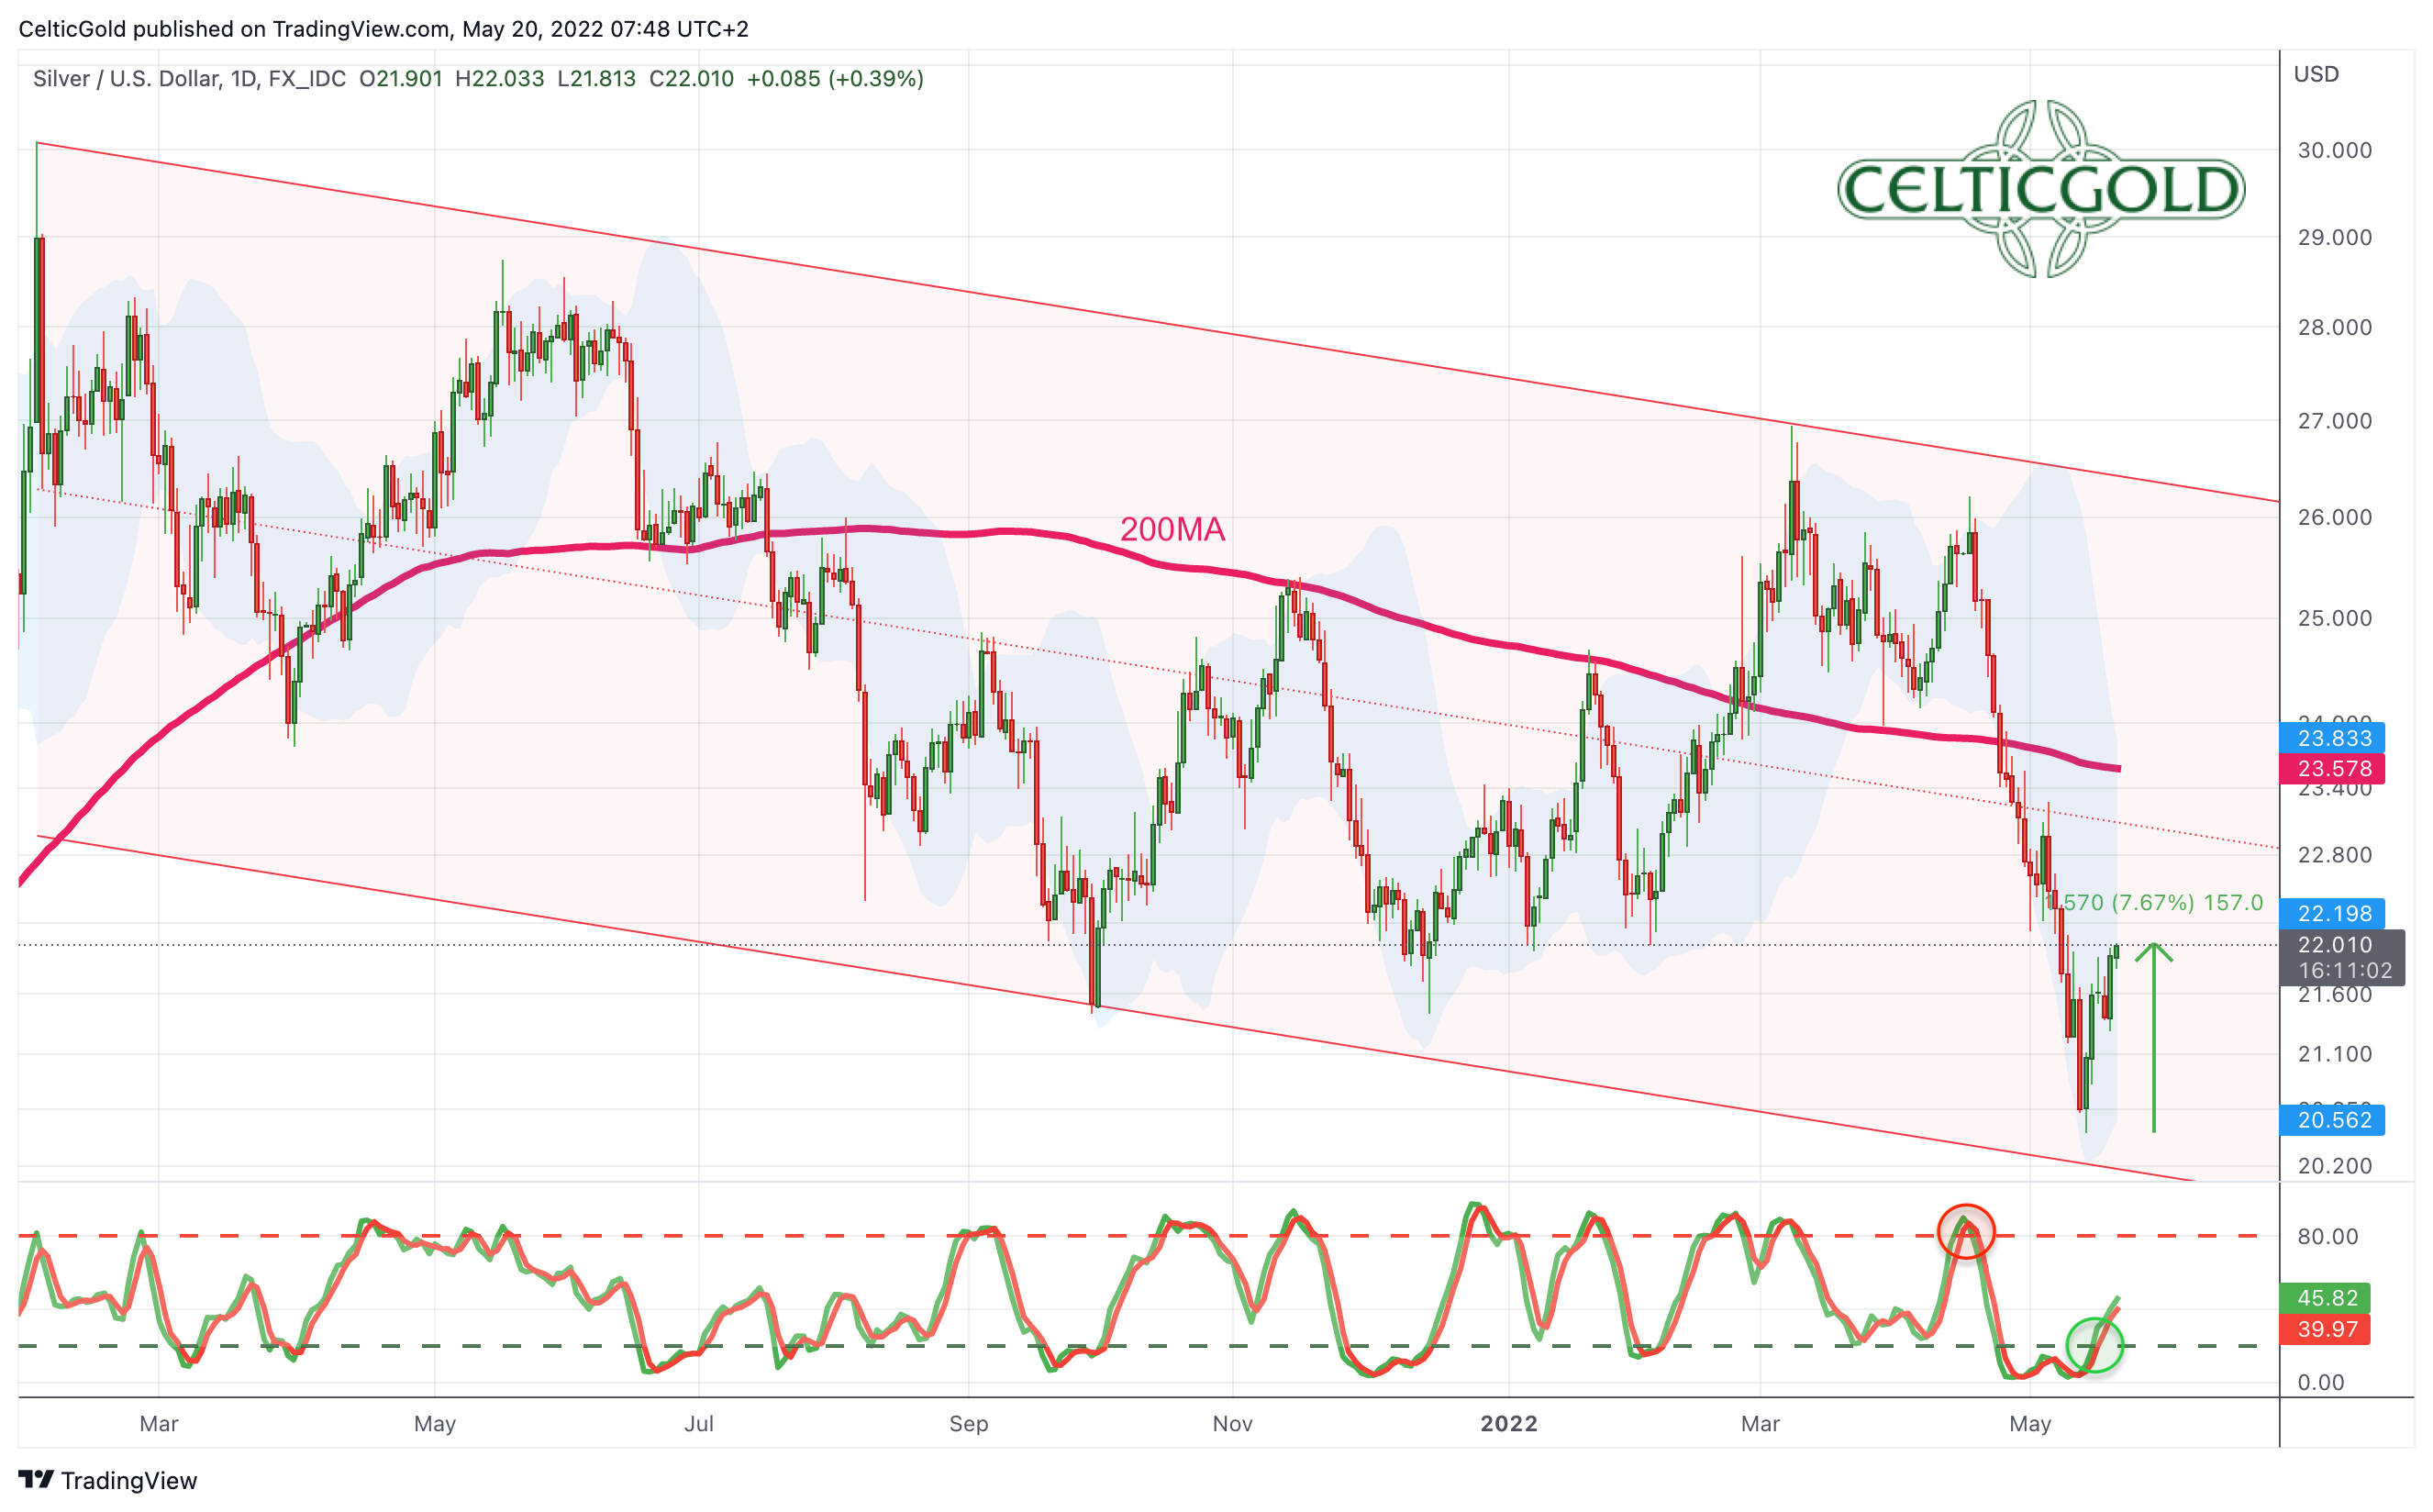 *Silver in US-Dollars, daily chart as of May 20th, 2022. Source: Tradingview* Since May 12th, the somewhat surprising relative strength of silver is also worth noting. The little brother of gold had no easy stand since February 2021 and could never keep up with the development of gold. The gradual easing of COVID restrictions in China, which is now in prospect, seems to have boosted demand for industrial metals somewhat, hence prices for silver, copper, and platinum were initially able to recover better than gold in recent days. Overall, the current situation in the financial markets is extremely shaky and difficult. Despite the increasingly emerging bargains, one is still well advised for the time being to drive on sight and primarily hold liquidity on the sidelines. ## Technical Analysis: Gold in US-Dollar ### Weekly Chart – Recovery towards US$1,855 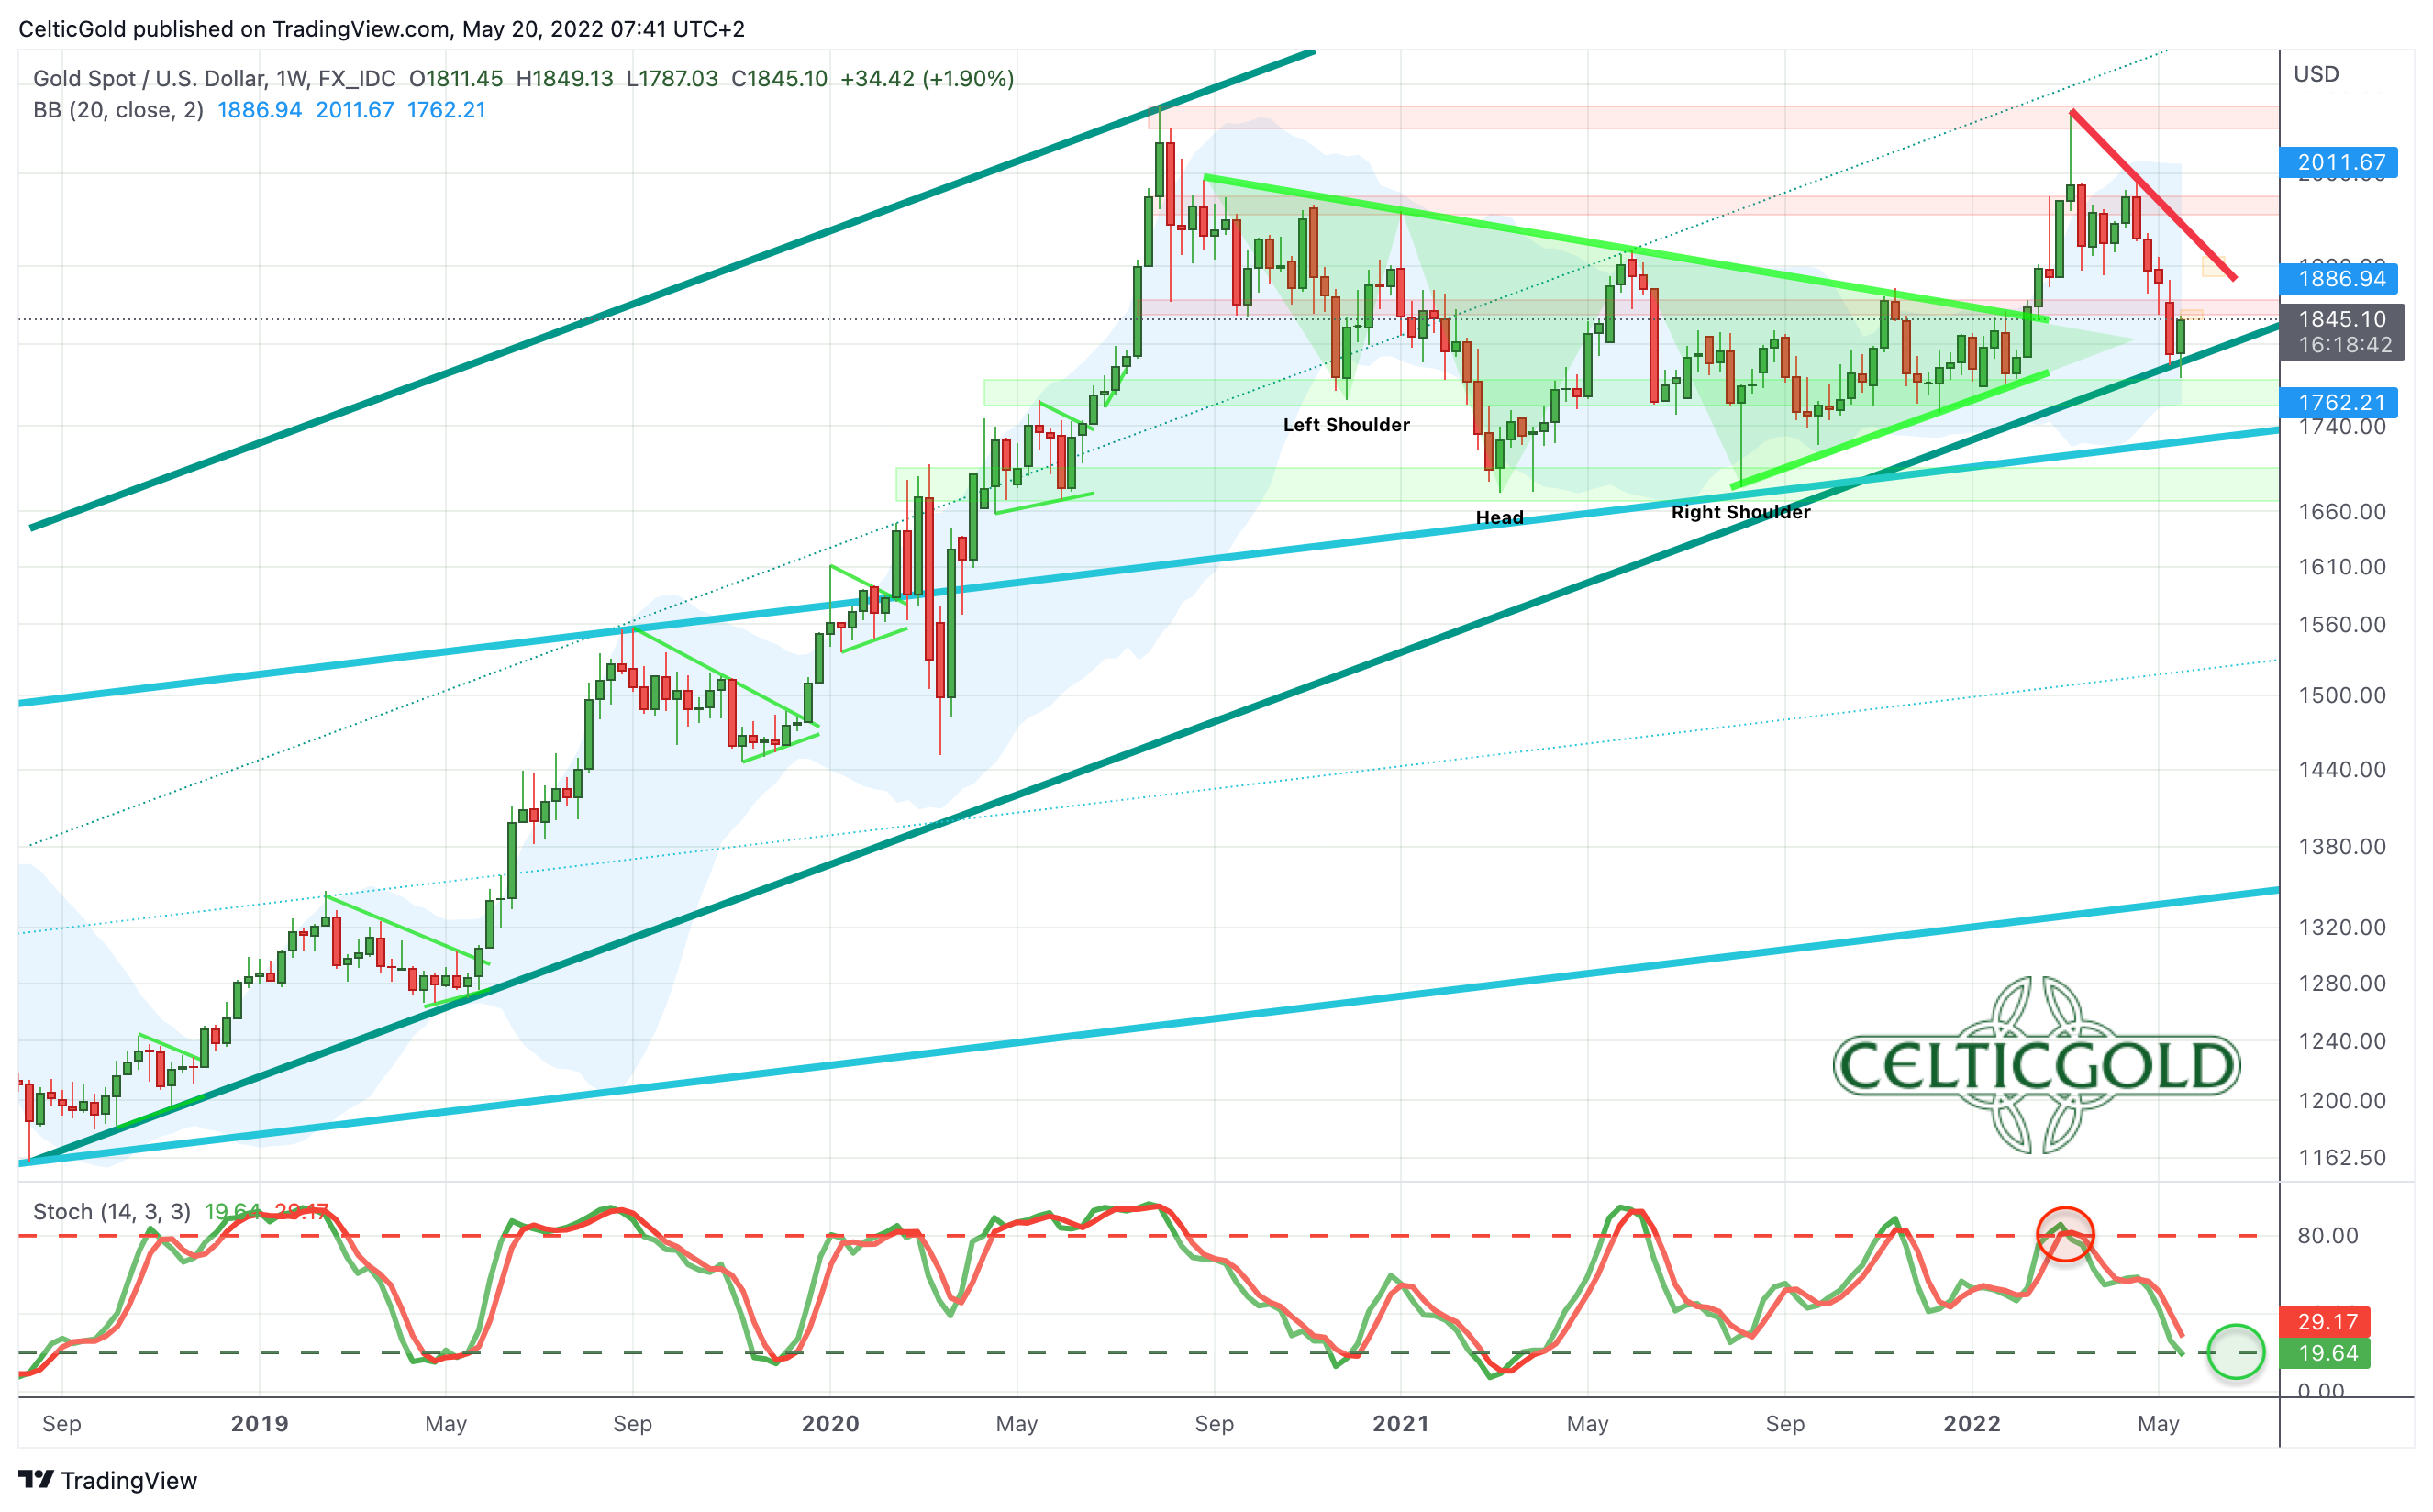 *Gold in US-Dollars, weekly chart as of May 20th, 2022. Source: Tradingview* On the weekly chart, the sharp pullback over the last weeks has led to a reunion with the long-term uptrend line. This supporting uptrend line originated in August 2018 and has now been approached again for the first time since May 2019. Moreover, since gold has mostly oscillated around the US$1,800 mark over the past thirteen months, the bears are encountering very solid support here. On top, the weekly stochastic has also reached its oversold zone. The probabilities that gold continues to correct directly further to the south in terms of price are therefore rather low. A bottom formation including a first bounce seems to have higher probabilities. Nevertheless, the technical picture has been damaged. The double top around US$2,075 and US$2,070 could well have initiated an even deeper correction. However, and if at all, this should unfold only in the medium term and could lead to gold prices correcting further to around US$1,740. On the other hand, as the bulls seem to use the support around US$1,800 for a sizable bounce, a first resistance zone on the weekly chart is waiting around approx. US$1,850. Above that, the downtrend line of the last two and a half months is waiting in the area around US$1,900. All in all, the weekly chart is still bearish. However, initial stabilization tendencies indicate that the US$1,800 mark will hold for the time being on a weekly closing price basis and that gold has started a bounce. However, the medium-term picture for gold only brightens up significantly with prices above US$1,920. ### Daily Chart – Stochastic with a new buying signal 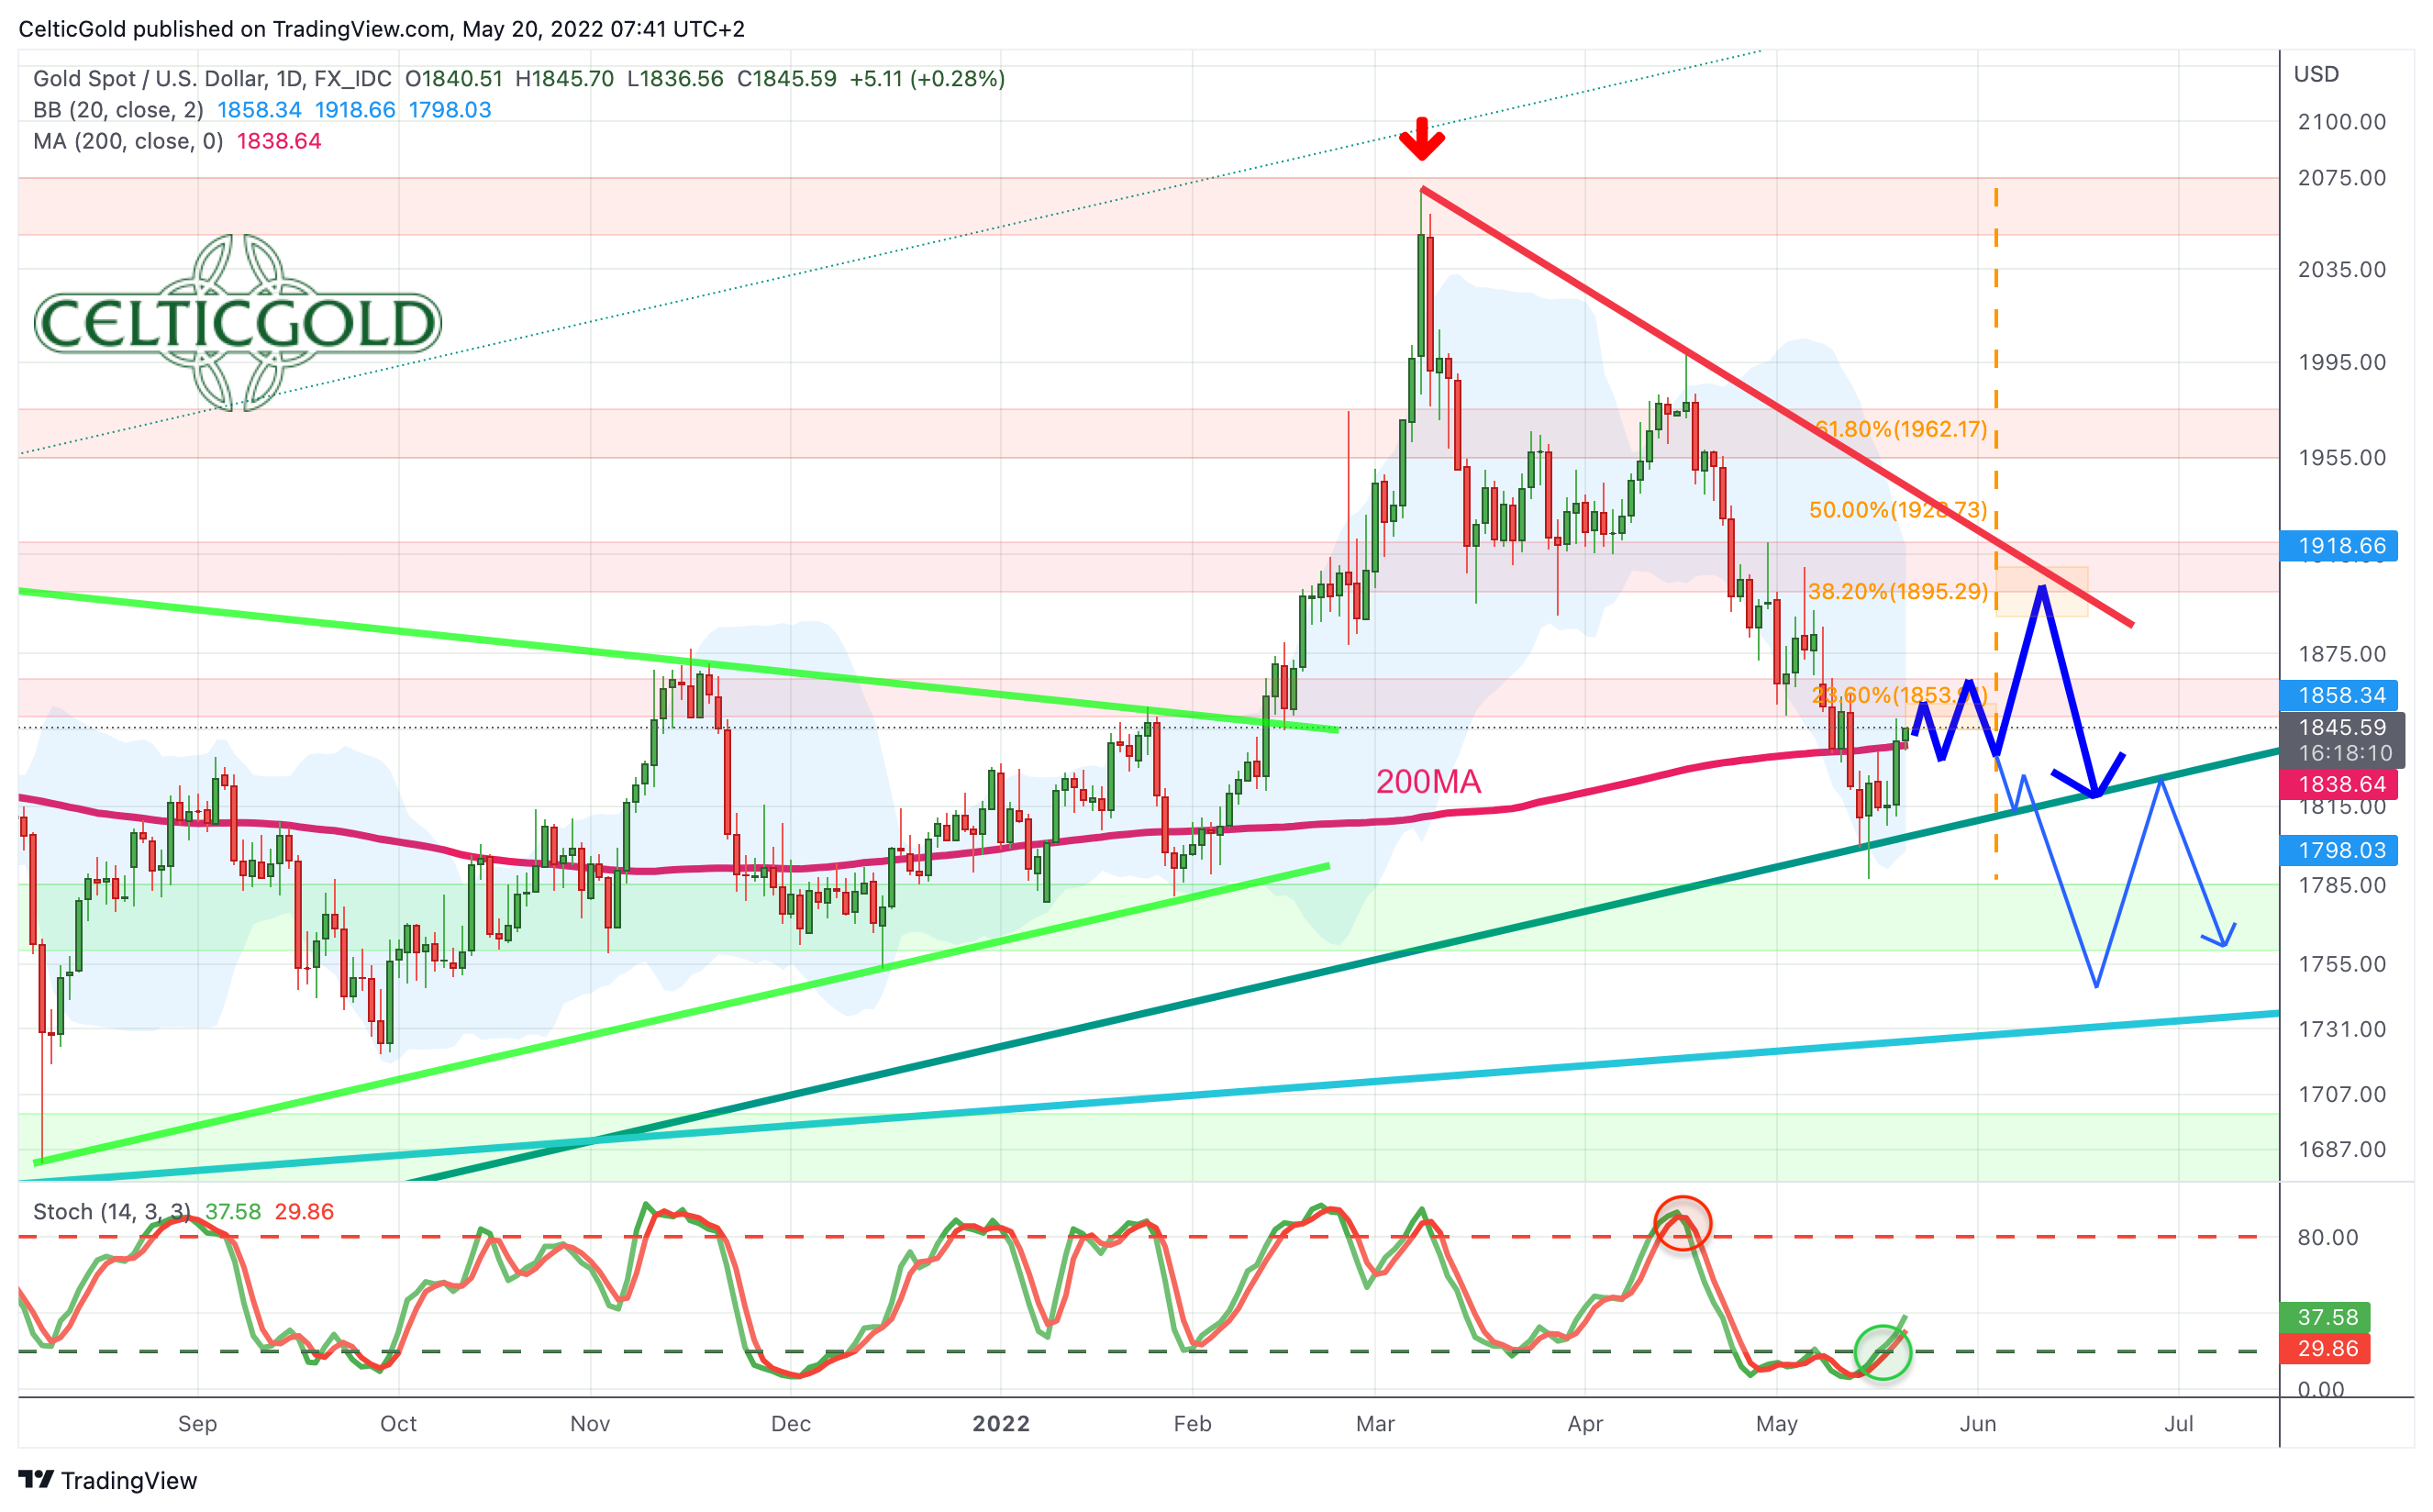 *Gold in US-Dollars, daily chart as of May 20th, 2022. Source: Tradingview* On the daily chart, a first reversal occurred last Friday, which, however, was immediately negated with a new low (US$1,787) the following Monday. Since this new low, however, gold so far has rallied more than US$50 and generated a first small series of higher lows and higher highs. In particular, the stochastic oscillator has freed itself from the bearish embeddedness and now convinces with a new buying signal. Above the 200-day moving average (US$1,838), there would be room to approx. US$1,850 to US$1,855 in the short term. However, the current market environment can end the ambitions of the bulls at any time. In addition, gold usually stands better on two legs better. Hence, even if a major bounce to around US$1,900 would unfold now, we have to expect at least another pullback towards around US$1,835 and somewhat lower by midsummer. Overall, the daily chart has switched to bullish and thus opens up the chance for a recovery to at least US$1,855. In the best case, a run to around US$1,900 is also conceivable. However, not much more can be forecasted in the current market environment until midsummer. A daily closing price below US$1,800, on the other hand, would already mark the end of the recovery and activate further downside potential in the direction of around US$1,740. ## Commitments of Traders for Gold – First signs of stabilization 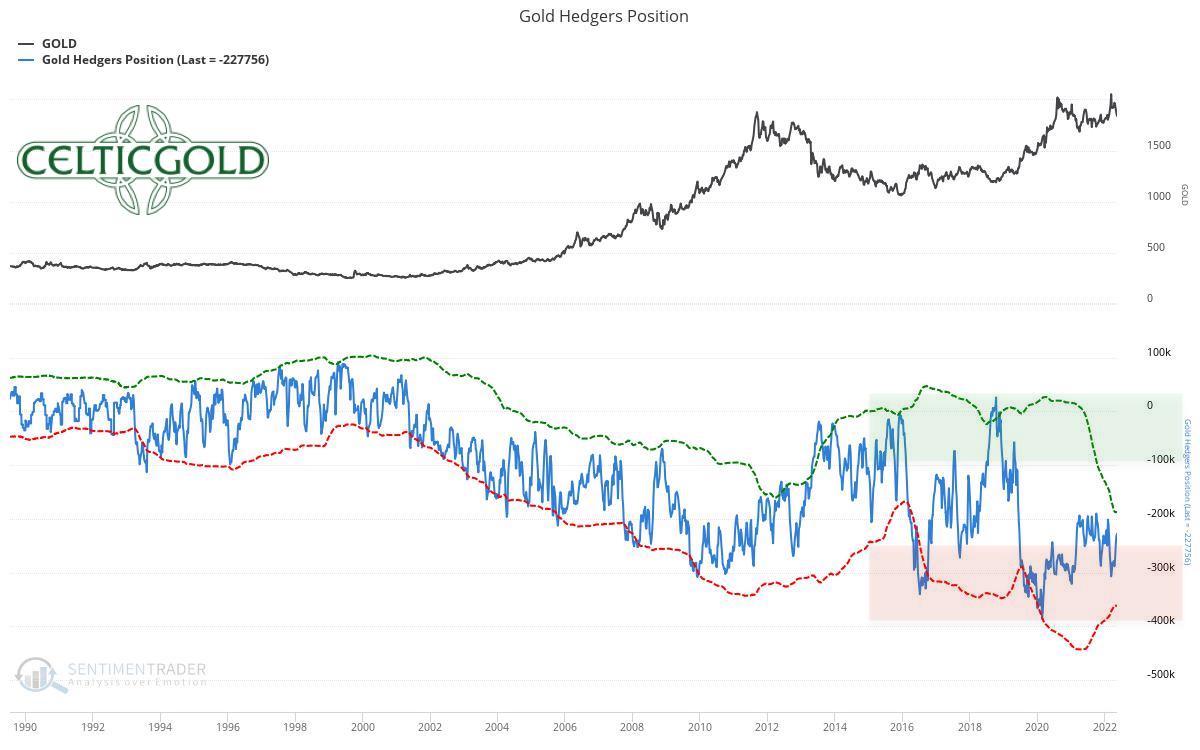 *Commitments of Traders for Gold as of May 18th, 2022. Source: Sentimentrader* The commercial net short position in the gold futures market has improved significantly to “only” 227,756 contracts sold short due to the significant correction in the gold market. In a long-term comparison, however, this constellation still does not provide a contrarian buy signal. Up to an ideal contrarian bottleneck, this short position would have to be at least halved again. Obviously, this will only be possible via lower gold prices. In summary, the CoT report therefore still provides a sell signal, albeit an increasingly weaker one. Only below a commercial short position of cumulated 100,000 contracts or fewer, the futures market would be more or less cleared. In August 2018, for example, commercial market participants were actually “long” in aggregate for the first time in 25 years. As a result, the gold price was able to rally from US$1,160 to US$2,070 within just two years. ## Sentiment for Gold – First signs of stabilization 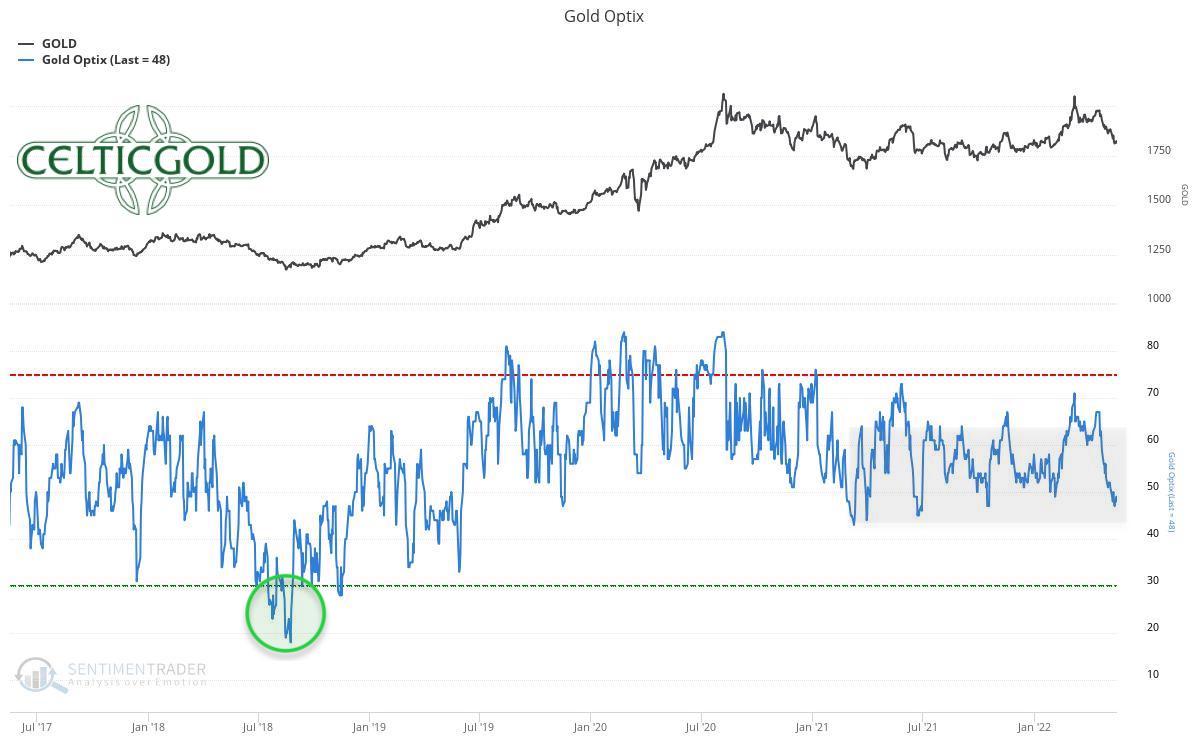 *Sentiment Optix for Gold as of May 18th, 2022. Source: Sentimentrader* There is no doubt that the mood in the financial markets is currently very depressed. Panic and a “giving up” sentiment are going hand in hand. In the gold market, sentiment has fallen to its lowest level since August 2021. However, one cannot (yet) speak of a real panic. Here, too, it is worth recalling August 2018, when the Sentiment Optix for gold fell to its lowest level since 2001, with values well below 20. Currently, this Sentiment Optix is quoted at 48 sitting rather in a neutral position. Therefore, sentiment for gold remains at neutral. ## Seasonality for Gold – First signs of stabilization 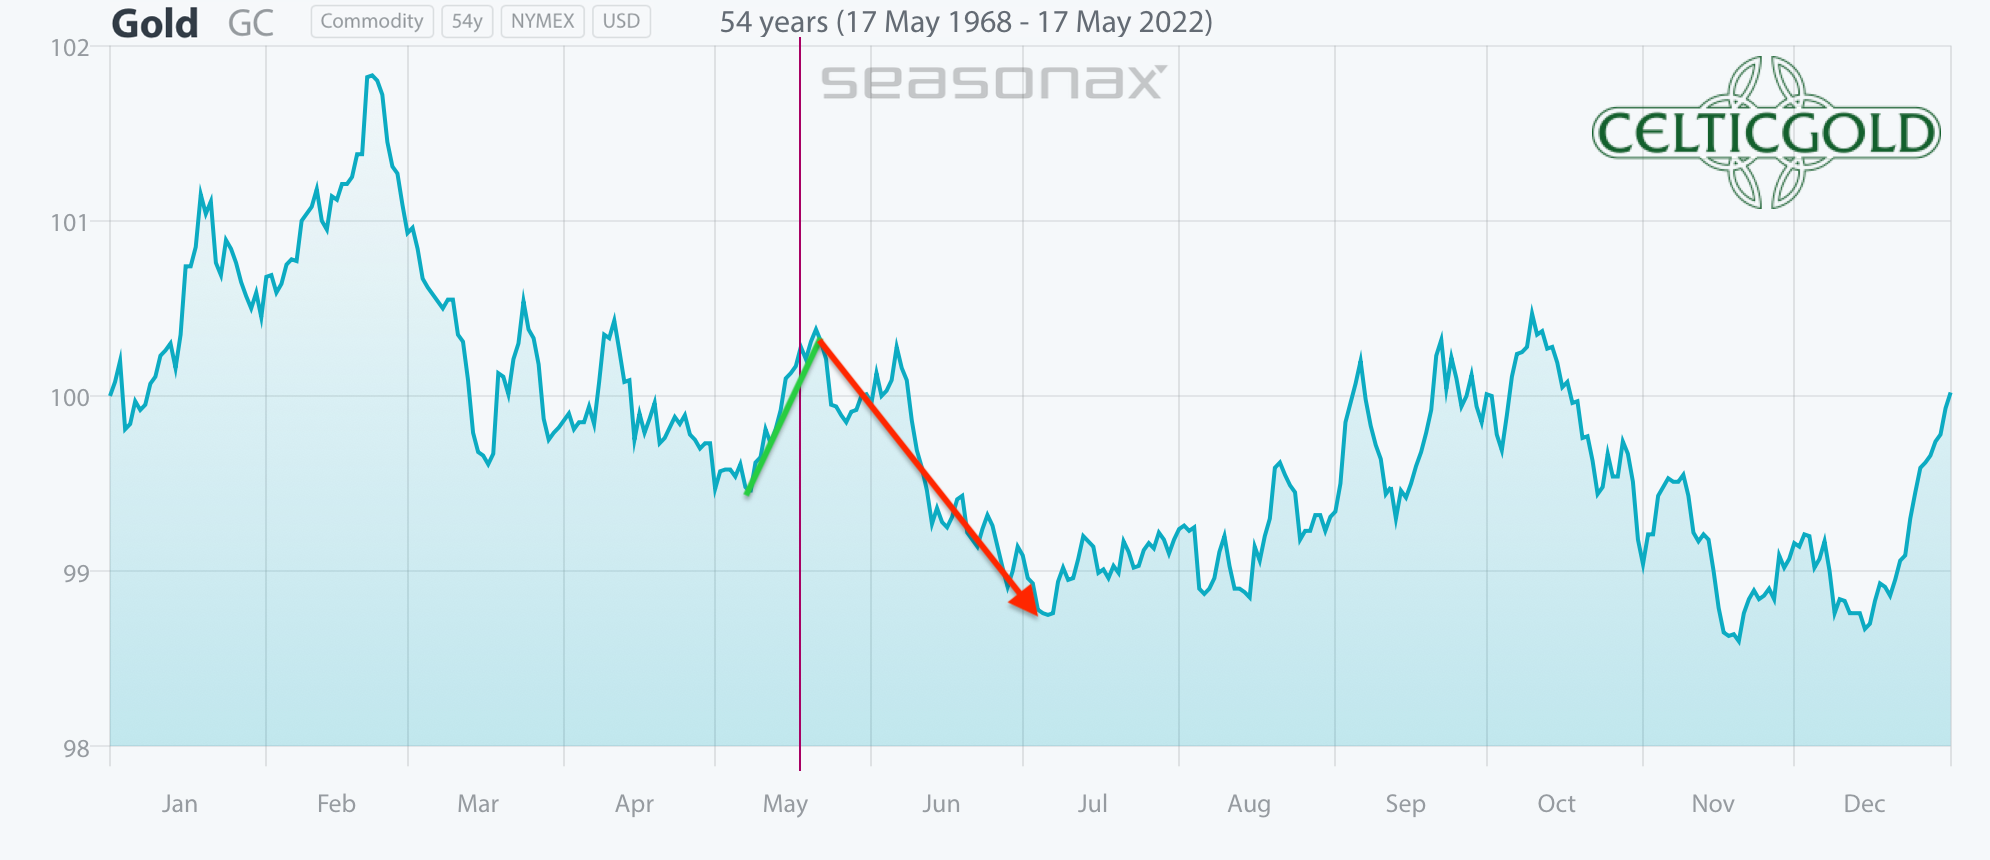 *Seasonality for Gold over the last 53-years as of May 18th, 2022. Source: Sentimentrader* The seasonal component continues to be unfavorable for gold at this point. Although statistically there is often a temporary recovery or small bounce in May, sustainable rallies were extremely rare in the past. Only from July or August onwards, seasonality changes back to green. Until then, patience, caution and restraint are the best recommendations for gold bugs. In summary, from a seasonal perspective, the gold market probably still has two to three rather difficult months ahead of it. From mid-August, however, one should be fully positioned again. ## Macro update: 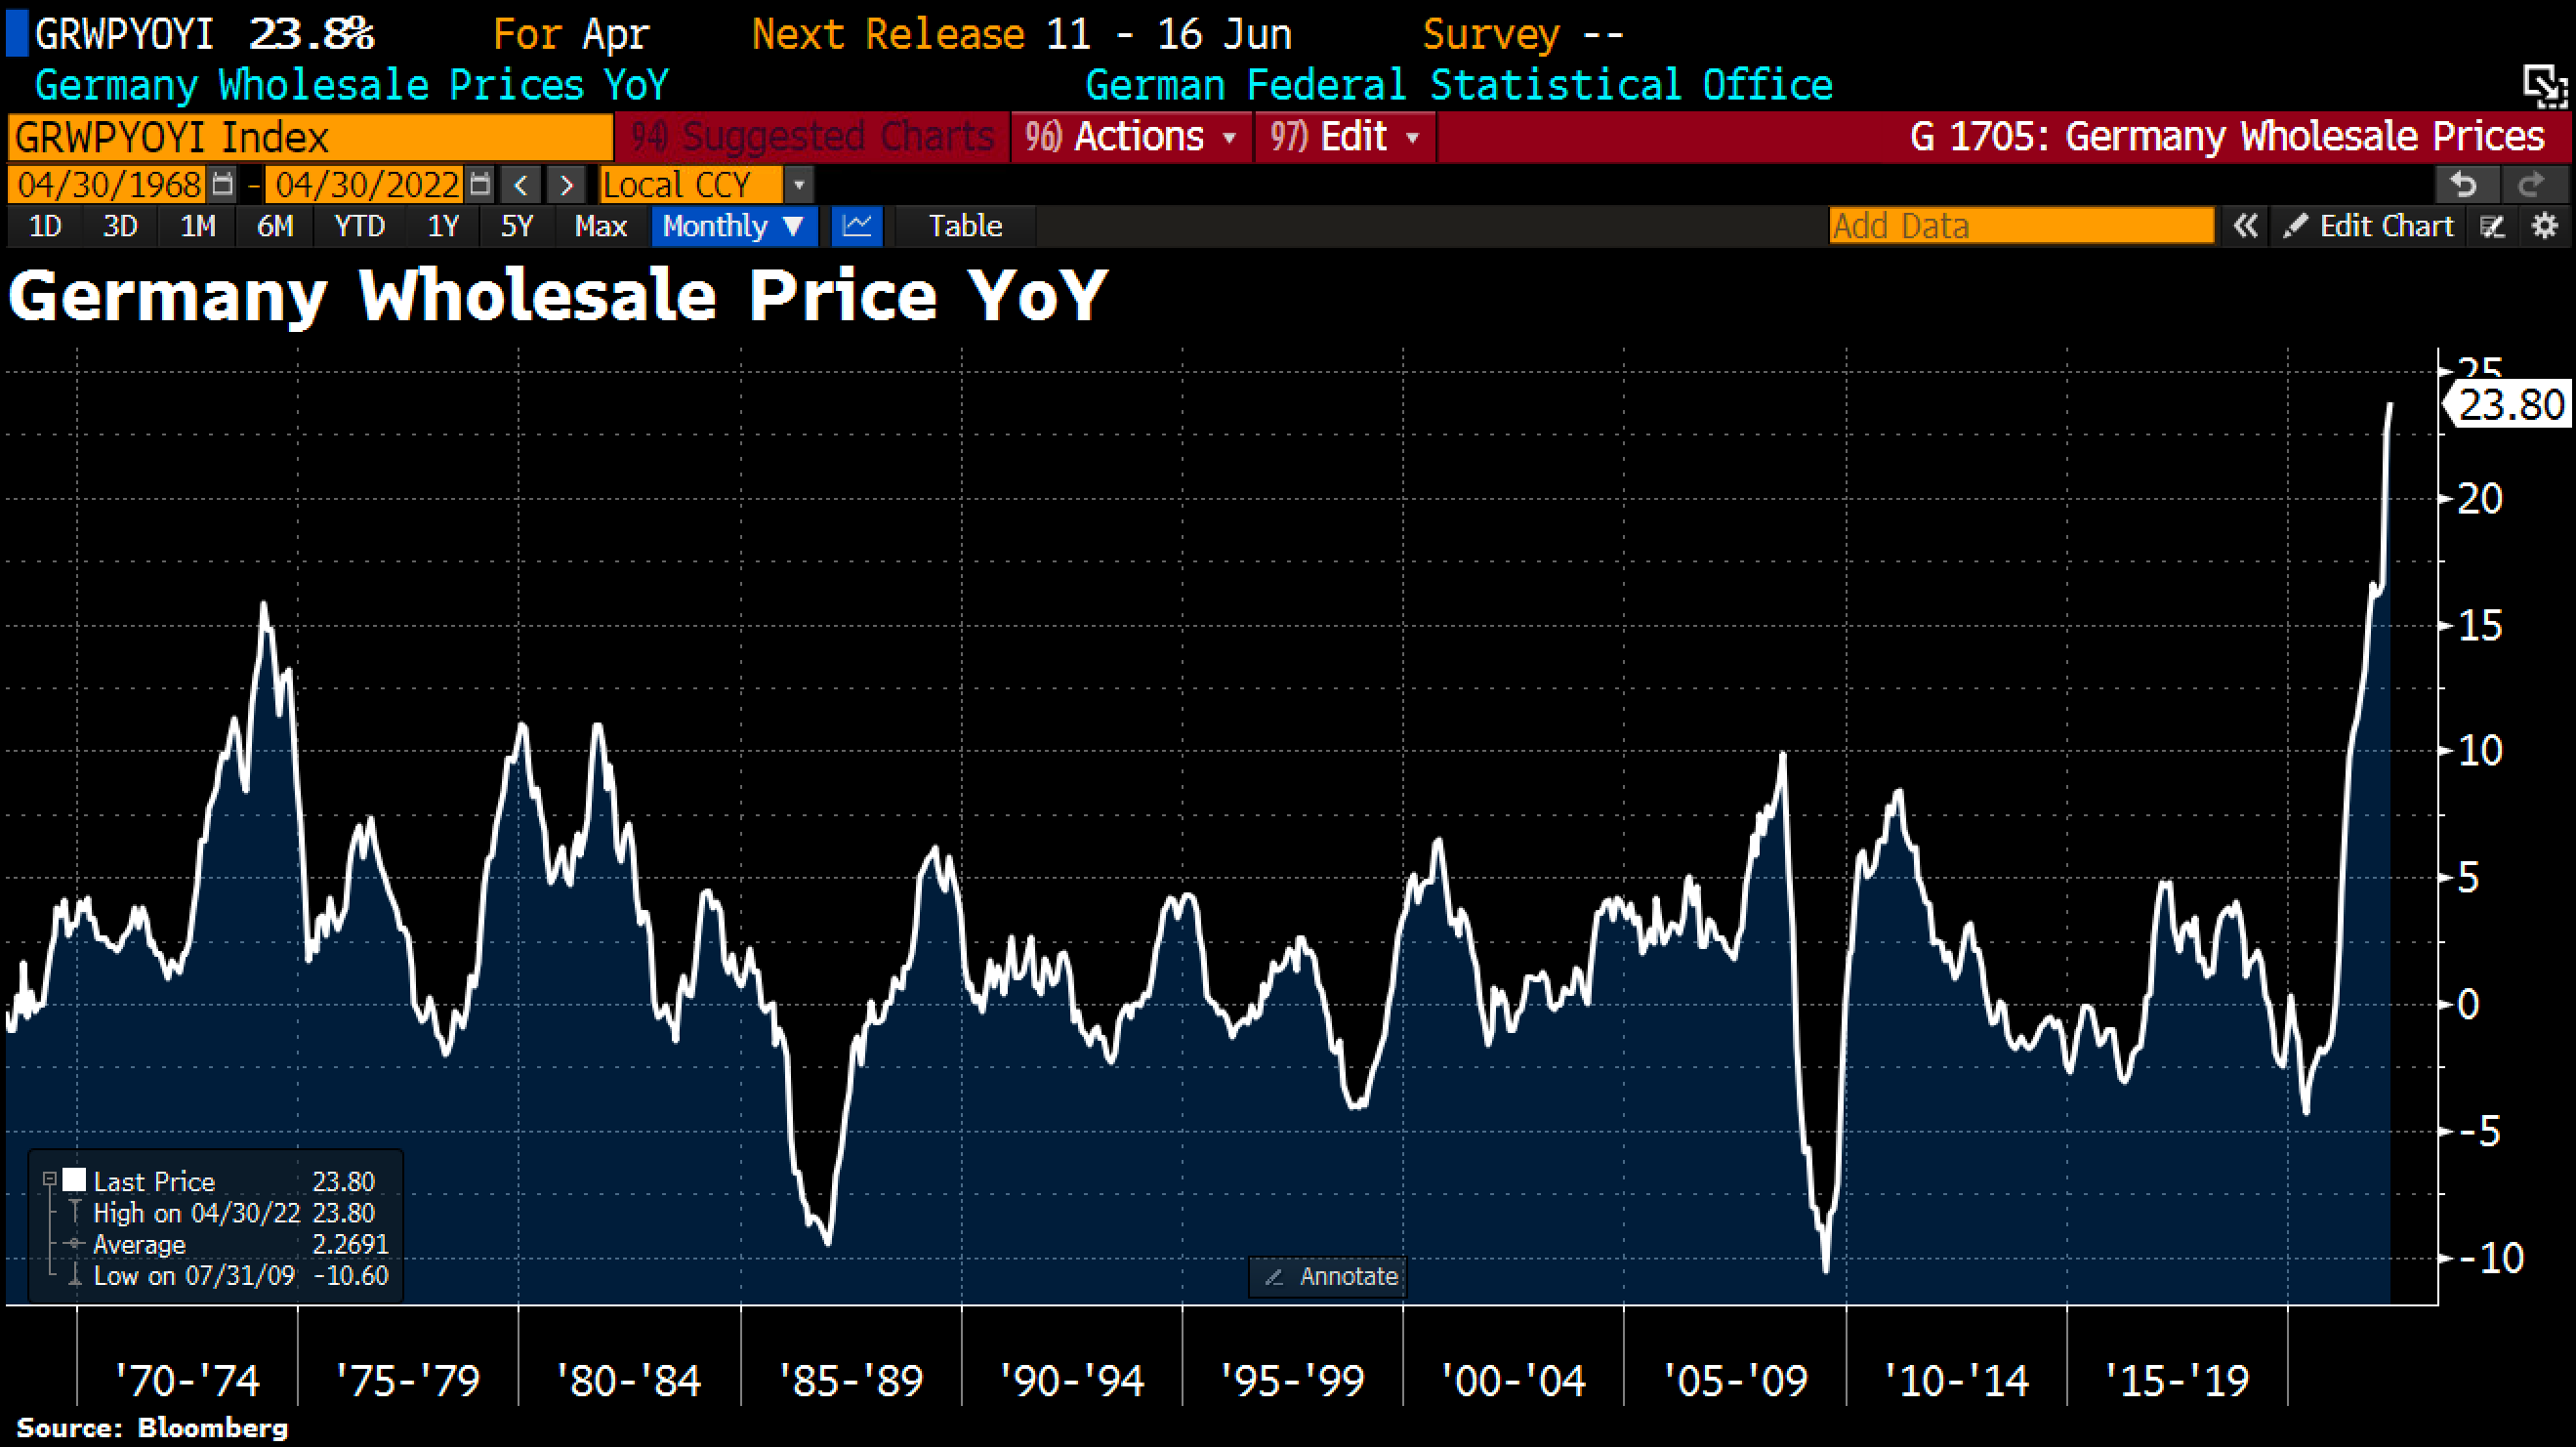 *German wholesale prices as of May 16th, 2022 ©Holger Zschaepitz* In Germany, wholesale prices jumped by 23.8% year-on-year in April. This is the highest annual rate of change since wholesale price indexes began being calculated in 1962. These wholesale prices are driven mainly by raw materials and commodity prices, as well as intermediate goods. 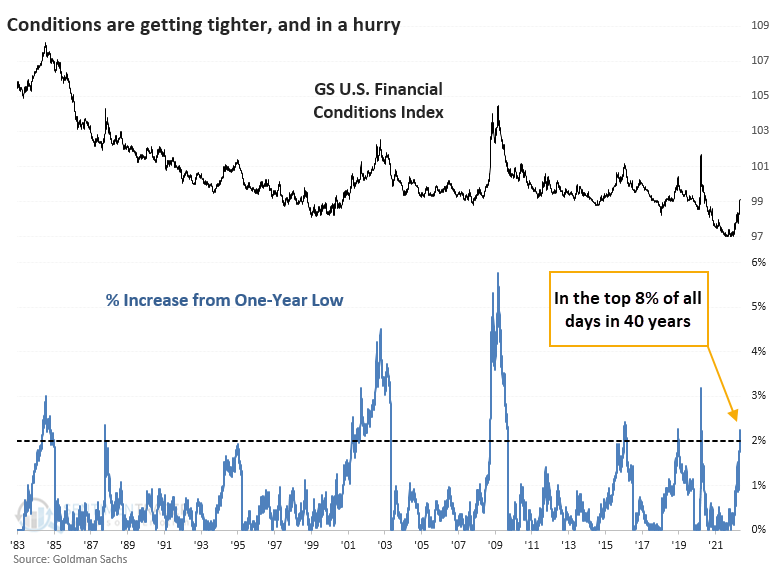 *Financial conditions tighten, from May 9, 2022. ©Sentimentrader* In the fight against high inflation, the FED therefore wants to continue its extreme and never-before-seen tightening of monetary policy. As a result, financial markets worldwide have already been under tremendous pressure for months, while the U.S. dollar index recently rose to its highest level since January 2003. However, the collapsing stock markets due to the sharp rise in interest rates are slowly but surely destroying demand. At the same time, de-globalization as well as the geopolitical drama in Ukraine and the still constrained supply chains continue to provide inflationary pressure. The hopefully soon ending lockdown in China, on the other hand, is strongly deflationary. Presumably, the FED will have to at least pause its so-called “quantitative tightening” after June in order to not completely destroy the economy.  In the further course of the year, we can therefore assume that the Fed will again change course in the direction of quantitative easing. As a result, the battered stock markets are likely to recover significantly from early summer or, at the latest, in fall. For the precious metals sector, the end of monetary tightening would be even more bullish. Until that happens, however, things are likely to remain dangerous and uncomfortable in the financial markets. Nevertheless, gold should be one of the first to start pricing in the monetary policy change in the coming months. ## Conclusion: Gold – First signs of stabilization First signs of stabilization can currently be seen in the gold market. This could certainly lead to a somewhat larger recovery. However, as seasonality remains unfavorable until July/August, we currently do not expect a sustainable recovery rally. Prices around US$1,855 seem realistic, while a rally to around US$1,900 would be very optimistic already. The probability of a merely intermediary recovery within the larger correction is also high in view of the difficult situation in financial markets. This bearish scenario is activated with a daily close below US$1,800. To conclude, an overly bullish expectation is unlikely to pay off, at least until midsummer. However, from August onwards, the start of a new multi-month uptrend in the precious metals sector would be conceivable. _Analysis initially published on May 19th, 2022, by www.celticgold.de. Translated into English and partially updated on May 20th, 2022._ _Feel free to join us in our free [Telegram channel](https://t.me/MidasTouchConsulting) for daily real time data and a great community._ _If you like to get regular updates on our gold model, precious metals and cryptocurrencies you can subscribe to our [free newsletter](http://bit.ly/1EUdt2K)._ |
| json metadata | {"tags":["silvergoldstackers","steemsilvergold","silver","gold","preciousmetals","trading","investing","exploration"],"image":["https://cdn.steemitimages.com/DQmTuxCfYepzkx31kFWAo7aRRsbSBP7cZCcrjdyL4jq2zxW/blog-header-gold-celticgold.jpg","https://cdn.steemitimages.com/DQmdfS3d6TdxEorQd8m8cgDM7AgkmXL6mTQ21XBdNnprPwr/Chart%2001%20Silver%20in%20USD%20daily%20chart%20200522.png","https://cdn.steemitimages.com/DQmfNTQi3qzTFPST83ryUu1o8wi5DTBKwgSdfJUQxqYFAVF/Chart%2002%20Gold%20in%20USD%20weekly%20chart%20200522.png","https://cdn.steemitimages.com/DQmZMSK4zLkXCCWBtL7yCrrqG6HDZJkM8T2z3ynFKXaZjh8/Chart%2003%20Gold%20in%20USD%20daily%20chart%20200522.png","https://cdn.steemitimages.com/DQmfXYaMXcNGZfj77pBZRMPwag9nBKtj8KpCmnTpWSsrKZC/Chart%2004%20Gold%20Hedgers%20Position%20180522.jpeg","https://cdn.steemitimages.com/DQmc8uYKAzpDbrPnii9zELeYmV4YHWdNnKcffUzqg3igCsE/Chart%2005%20Gold%20Sentiment%20180522.jpeg","https://cdn.steemitimages.com/DQmR5ZLZQ8e7dmDLUPr4bhMEZLvm3K7RK5Ccna5589PxhiU/Chart%2006%20Gold%20Seasonality%20180522.png","https://cdn.steemitimages.com/DQmPyCVtKHxLZrGuUzcNkWZFteFz6dsBaFXjBkyp1tzuxdU/Chart%2007%20German%20wholesale%20prices%20160522.png","https://cdn.steemitimages.com/DQmeVaaawdnSrrrYLhEPspStuS9ay8nwMMf32EuuoUwXhuh/Chart%2008%20Financial%20conditions%20getting%20tighter%20090522.png","https://cdn.steemitimages.com/DQmQgD7KKUdGojkZLH9a7qCpuNUjMRwSgv35LCJrpKhwcVz/Chart%2009%20Increase%20our%20consumption%20180522.jpeg"],"links":["https://www.midastouch-consulting.com/20052022-gold-first-signs-of-stabilization","https://t.me/MidasTouchConsulting","http://bit.ly/1EUdt2K"],"app":"steemit/0.2","format":"markdown"} |
| parent author | |
| parent permlink | silvergoldstackers |
| permlink | may-20th-2022-gold-first-signs-of-stabilization |
| title | May 20th, 2022: Gold – First signs of stabilization |
| Transaction Info | Block #64392651/Trx 9c6a54b02a5e31c510c9f7ff30c6427acc6d2821 |
View Raw JSON Data
{
"block": 64392651,
"op": [
"comment",
{
"author": "midastouch",
"body": "\n\n# [May 20th, 2022: Gold – First signs of stabilization](https://www.midastouch-consulting.com/20052022-gold-first-signs-of-stabilization) \n\nThe last five months have been quite a rollercoaster in the gold market. First gold managed to stage an impressive rally from US$1,750 up to US$2,070. Then it came all the way back down to a low of US$1,787 a week ago. Since then, a first bounce has brought it back to slightly below US$1,850. Gold – First signs of stabilization.\n\n## Review\n\nWith its most recent high at US$1,998, gold prices failed just below the round mark of US$2,000 on Easter Monday. Since then, along with an implosion in the entire financial market, a brutal wave down made its way in the gold market. Without much resistance and within just four weeks, gold prices fell by 10.5% from US$1,998 to US$1,787. However, since the beginning of this week, gold is now showing first signs of stabilization. The 200-day moving average (US$ 1,838) as well as the important multi-year uptrend line around US$1,820 have been reconquered in the short-term at least.\n\nIn particular, the strength of the U.S. dollar affected the gold price in recent weeks. In a deep red market environment, the U.S. dollar played out its function as a “safe haven” to the fullest. But here, too, there have been signs of at least a small countermovement, which provided support for precious metals.\n\n\n*Silver in US-Dollars, daily chart as of May 20th, 2022. Source: Tradingview*\n\nSince May 12th, the somewhat surprising relative strength of silver is also worth noting. The little brother of gold had no easy stand since February 2021 and could never keep up with the development of gold. The gradual easing of COVID restrictions in China, which is now in prospect, seems to have boosted demand for industrial metals somewhat, hence prices for silver, copper, and platinum were initially able to recover better than gold in recent days.\n\nOverall, the current situation in the financial markets is extremely shaky and difficult. Despite the increasingly emerging bargains, one is still well advised for the time being to drive on sight and primarily hold liquidity on the sidelines.\n\n## Technical Analysis: Gold in US-Dollar\n\n### Weekly Chart – Recovery towards US$1,855\n\n*Gold in US-Dollars, weekly chart as of May 20th, 2022. Source: Tradingview*\n\nOn the weekly chart, the sharp pullback over the last weeks has led to a reunion with the long-term uptrend line. This supporting uptrend line originated in August 2018 and has now been approached again for the first time since May 2019. Moreover, since gold has mostly oscillated around the US$1,800 mark over the past thirteen months, the bears are encountering very solid support here. On top, the weekly stochastic has also reached its oversold zone. The probabilities that gold continues to correct directly further to the south in terms of price are therefore rather low. A bottom formation including a first bounce seems to have higher probabilities.\n\nNevertheless, the technical picture has been damaged. The double top around US$2,075 and US$2,070 could well have initiated an even deeper correction. However, and if at all, this should unfold only in the medium term and could lead to gold prices correcting further to around US$1,740.\n\nOn the other hand, as the bulls seem to use the support around US$1,800 for a sizable bounce, a first resistance zone on the weekly chart is waiting around approx. US$1,850. Above that, the downtrend line of the last two and a half months is waiting in the area around US$1,900.\n\nAll in all, the weekly chart is still bearish. However, initial stabilization tendencies indicate that the US$1,800 mark will hold for the time being on a weekly closing price basis and that gold has started a bounce. However, the medium-term picture for gold only brightens up significantly with prices above US$1,920.\n\n### Daily Chart – Stochastic with a new buying signal\n\n*Gold in US-Dollars, daily chart as of May 20th, 2022. Source: Tradingview*\n\nOn the daily chart, a first reversal occurred last Friday, which, however, was immediately negated with a new low (US$1,787) the following Monday. Since this new low, however, gold so far has rallied more than US$50 and generated a first small series of higher lows and higher highs. In particular, the stochastic oscillator has freed itself from the bearish embeddedness and now convinces with a new buying signal. Above the 200-day moving average (US$1,838), there would be room to approx. US$1,850 to US$1,855 in the short term.\n\nHowever, the current market environment can end the ambitions of the bulls at any time. In addition, gold usually stands better on two legs better. Hence, even if a major bounce to around US$1,900 would unfold now, we have to expect at least another pullback towards around US$1,835 and somewhat lower by midsummer.\n\nOverall, the daily chart has switched to bullish and thus opens up the chance for a recovery to at least US$1,855. In the best case, a run to around US$1,900 is also conceivable. However, not much more can be forecasted in the current market environment until midsummer. A daily closing price below US$1,800, on the other hand, would already mark the end of the recovery and activate further downside potential in the direction of around US$1,740.\n\n## Commitments of Traders for Gold – First signs of stabilization\n\n*Commitments of Traders for Gold as of May 18th, 2022. Source: Sentimentrader*\n\nThe commercial net short position in the gold futures market has improved significantly to “only” 227,756 contracts sold short due to the significant correction in the gold market. In a long-term comparison, however, this constellation still does not provide a contrarian buy signal. Up to an ideal contrarian bottleneck, this short position would have to be at least halved again. Obviously, this will only be possible via lower gold prices.\n\nIn summary, the CoT report therefore still provides a sell signal, albeit an increasingly weaker one. Only below a commercial short position of cumulated 100,000 contracts or fewer, the futures market would be more or less cleared. In August 2018, for example, commercial market participants were actually “long” in aggregate for the first time in 25 years. As a result, the gold price was able to rally from US$1,160 to US$2,070 within just two years.\n\n## Sentiment for Gold – First signs of stabilization\n\n*Sentiment Optix for Gold as of May 18th, 2022. Source: Sentimentrader*\n\nThere is no doubt that the mood in the financial markets is currently very depressed. Panic and a “giving up” sentiment are going hand in hand. In the gold market, sentiment has fallen to its lowest level since August 2021. However, one cannot (yet) speak of a real panic. Here, too, it is worth recalling August 2018, when the Sentiment Optix for gold fell to its lowest level since 2001, with values well below 20. Currently, this Sentiment Optix is quoted at 48 sitting rather in a neutral position.\n\nTherefore, sentiment for gold remains at neutral.\n\n## Seasonality for Gold – First signs of stabilization\n\n*Seasonality for Gold over the last 53-years as of May 18th, 2022. Source: Sentimentrader*\n\nThe seasonal component continues to be unfavorable for gold at this point. Although statistically there is often a temporary recovery or small bounce in May, sustainable rallies were extremely rare in the past. Only from July or August onwards, seasonality changes back to green. Until then, patience, caution and restraint are the best recommendations for gold bugs.\n\nIn summary, from a seasonal perspective, the gold market probably still has two to three rather difficult months ahead of it. From mid-August, however, one should be fully positioned again.\n\n## Macro update:\n\n\n*German wholesale prices as of May 16th, 2022 ©Holger Zschaepitz*\n\nIn Germany, wholesale prices jumped by 23.8% year-on-year in April. This is the highest annual rate of change since wholesale price indexes began being calculated in 1962. These wholesale prices are driven mainly by raw materials and commodity prices, as well as intermediate goods.\n\n\n*Financial conditions tighten, from May 9, 2022. ©Sentimentrader*\n\nIn the fight against high inflation, the FED therefore wants to continue its extreme and never-before-seen tightening of monetary policy. As a result, financial markets worldwide have already been under tremendous pressure for months, while the U.S. dollar index recently rose to its highest level since January 2003. However, the collapsing stock markets due to the sharp rise in interest rates are slowly but surely destroying demand. At the same time, de-globalization as well as the geopolitical drama in Ukraine and the still constrained supply chains continue to provide inflationary pressure. The hopefully soon ending lockdown in China, on the other hand, is strongly deflationary. Presumably, the FED will have to at least pause its so-called “quantitative tightening” after June in order to not completely destroy the economy.\n\n\n\nIn the further course of the year, we can therefore assume that the Fed will again change course in the direction of quantitative easing. As a result, the battered stock markets are likely to recover significantly from early summer or, at the latest, in fall. For the precious metals sector, the end of monetary tightening would be even more bullish. Until that happens, however, things are likely to remain dangerous and uncomfortable in the financial markets. Nevertheless, gold should be one of the first to start pricing in the monetary policy change in the coming months.\n\n## Conclusion: Gold – First signs of stabilization\n\nFirst signs of stabilization can currently be seen in the gold market. This could certainly lead to a somewhat larger recovery. However, as seasonality remains unfavorable until July/August, we currently do not expect a sustainable recovery rally. Prices around US$1,855 seem realistic, while a rally to around US$1,900 would be very optimistic already. The probability of a merely intermediary recovery within the larger correction is also high in view of the difficult situation in financial markets. This bearish scenario is activated with a daily close below US$1,800.\n\nTo conclude, an overly bullish expectation is unlikely to pay off, at least until midsummer. However, from August onwards, the start of a new multi-month uptrend in the precious metals sector would be conceivable.\n\n_Analysis initially published on May 19th, 2022, by www.celticgold.de. Translated into English and partially updated on May 20th, 2022._\n\n_Feel free to join us in our free [Telegram channel](https://t.me/MidasTouchConsulting) for daily real time data and a great community._ \n\n_If you like to get regular updates on our gold model, precious metals and cryptocurrencies you can subscribe to our [free newsletter](http://bit.ly/1EUdt2K)._",
"json_metadata": "{\"tags\":[\"silvergoldstackers\",\"steemsilvergold\",\"silver\",\"gold\",\"preciousmetals\",\"trading\",\"investing\",\"exploration\"],\"image\":[\"https://cdn.steemitimages.com/DQmTuxCfYepzkx31kFWAo7aRRsbSBP7cZCcrjdyL4jq2zxW/blog-header-gold-celticgold.jpg\",\"https://cdn.steemitimages.com/DQmdfS3d6TdxEorQd8m8cgDM7AgkmXL6mTQ21XBdNnprPwr/Chart%2001%20Silver%20in%20USD%20daily%20chart%20200522.png\",\"https://cdn.steemitimages.com/DQmfNTQi3qzTFPST83ryUu1o8wi5DTBKwgSdfJUQxqYFAVF/Chart%2002%20Gold%20in%20USD%20weekly%20chart%20200522.png\",\"https://cdn.steemitimages.com/DQmZMSK4zLkXCCWBtL7yCrrqG6HDZJkM8T2z3ynFKXaZjh8/Chart%2003%20Gold%20in%20USD%20daily%20chart%20200522.png\",\"https://cdn.steemitimages.com/DQmfXYaMXcNGZfj77pBZRMPwag9nBKtj8KpCmnTpWSsrKZC/Chart%2004%20Gold%20Hedgers%20Position%20180522.jpeg\",\"https://cdn.steemitimages.com/DQmc8uYKAzpDbrPnii9zELeYmV4YHWdNnKcffUzqg3igCsE/Chart%2005%20Gold%20Sentiment%20180522.jpeg\",\"https://cdn.steemitimages.com/DQmR5ZLZQ8e7dmDLUPr4bhMEZLvm3K7RK5Ccna5589PxhiU/Chart%2006%20Gold%20Seasonality%20180522.png\",\"https://cdn.steemitimages.com/DQmPyCVtKHxLZrGuUzcNkWZFteFz6dsBaFXjBkyp1tzuxdU/Chart%2007%20German%20wholesale%20prices%20160522.png\",\"https://cdn.steemitimages.com/DQmeVaaawdnSrrrYLhEPspStuS9ay8nwMMf32EuuoUwXhuh/Chart%2008%20Financial%20conditions%20getting%20tighter%20090522.png\",\"https://cdn.steemitimages.com/DQmQgD7KKUdGojkZLH9a7qCpuNUjMRwSgv35LCJrpKhwcVz/Chart%2009%20Increase%20our%20consumption%20180522.jpeg\"],\"links\":[\"https://www.midastouch-consulting.com/20052022-gold-first-signs-of-stabilization\",\"https://t.me/MidasTouchConsulting\",\"http://bit.ly/1EUdt2K\"],\"app\":\"steemit/0.2\",\"format\":\"markdown\"}",
"parent_author": "",
"parent_permlink": "silvergoldstackers",
"permlink": "may-20th-2022-gold-first-signs-of-stabilization",
"title": "May 20th, 2022: Gold – First signs of stabilization"
}
],
"op_in_trx": 0,
"timestamp": "2022-05-22T13:46:36",
"trx_id": "9c6a54b02a5e31c510c9f7ff30c6427acc6d2821",
"trx_in_block": 2,
"virtual_op": 0
}schoolofminnowsreplied to @midastouch / som1pcdly3nmw2022/05/22 13:34:57
schoolofminnowsreplied to @midastouch / som1pcdly3nmw
2022/05/22 13:34:57
| author | schoolofminnows |
| body | This is a one-time notice from SCHOOL OF MINNOWS, a free value added service on steem. Getting started on steem can be super hard on these social platforms 😪 but luckily there is some communities that help support the little guy 😊, you might like school of minnows, we join forces with lots of other small accounts to help each other grow! Finally a good curation trail that helps its users achieve rapid growth, its fun on a bun! check it out. https://som-landing.glitch.me/ |
| json metadata | {} |
| parent author | midastouch |
| parent permlink | may-15th-2022-the-midas-touch-gold-model-tm-update |
| permlink | som1pcdly3nmw |
| title | |
| Transaction Info | Block #64392418/Trx b3716020a81ca4bdbd14789d2e890d1263f70ff8 |
View Raw JSON Data
{
  "block": 64392418,
  "op": [
    "comment",
    {
      "author": "schoolofminnows",
      "body": "This is a one-time notice from SCHOOL OF MINNOWS, a free value added service on steem.\nGetting started on steem can be super hard on these social platforms 😪 but luckily there is some communities that help support the little guy 😊, you might like school of minnows, we join forces with lots of other small accounts to help each other grow! \nFinally a good curation trail that helps its users achieve rapid growth, its fun on a bun! check it out. https://som-landing.glitch.me/",
      "json_metadata": "{}",
      "parent_author": "midastouch",
      "parent_permlink": "may-15th-2022-the-midas-touch-gold-model-tm-update",
      "permlink": "som1pcdly3nmw",
      "title": ""
    }
  ],
  "op_in_trx": 0,
  "timestamp": "2022-05-22T13:34:57",
  "trx_id": "b3716020a81ca4bdbd14789d2e890d1263f70ff8",
  "trx_in_block": 11,
  "virtual_op": 0
}midastouchpublished a new post: may-15th-2022-the-midas-touch-gold-model-tm-update2022/05/22 13:32:18
midastouchpublished a new post: may-15th-2022-the-midas-touch-gold-model-tm-update
2022/05/22 13:32:18
| author | midastouch |
| body |  # [May 15th, 2022: The Midas Touch Gold Model™ Update](https://www.midastouch-consulting.com/15052022-the-midas-touch-gold-model-update) As in previous years, our dear friends from Incrementum gave us the opportunity to contribute an update on the current status of the Midas Touch Gold Model™ as well as present a short-to midterm outlook by Florian Grummes in their upcoming In Gold We Trust report 2022. Our Midas Touch Gold Model illuminates the gold market from many different perspectives with a rational and holistic approach. It convinces with its versatility and its quantitative measurability. Although the model is based on a lot of data, it succeeds in summarizing an extensive analysis compactly and clearly in a table and in coming to a clear conclusion. The Midas Touch Gold Model™ Update as of May 14th, 2022. Nothing has such power to broaden the mind as the ability to investigate systematically and truly all that comes under thy observation in life. – Marcus Aurelius ## Gold – The big picture Gold prices reached a new all-time high on August 7th, 2020, with prices at USD 2,075, which is still valid today. 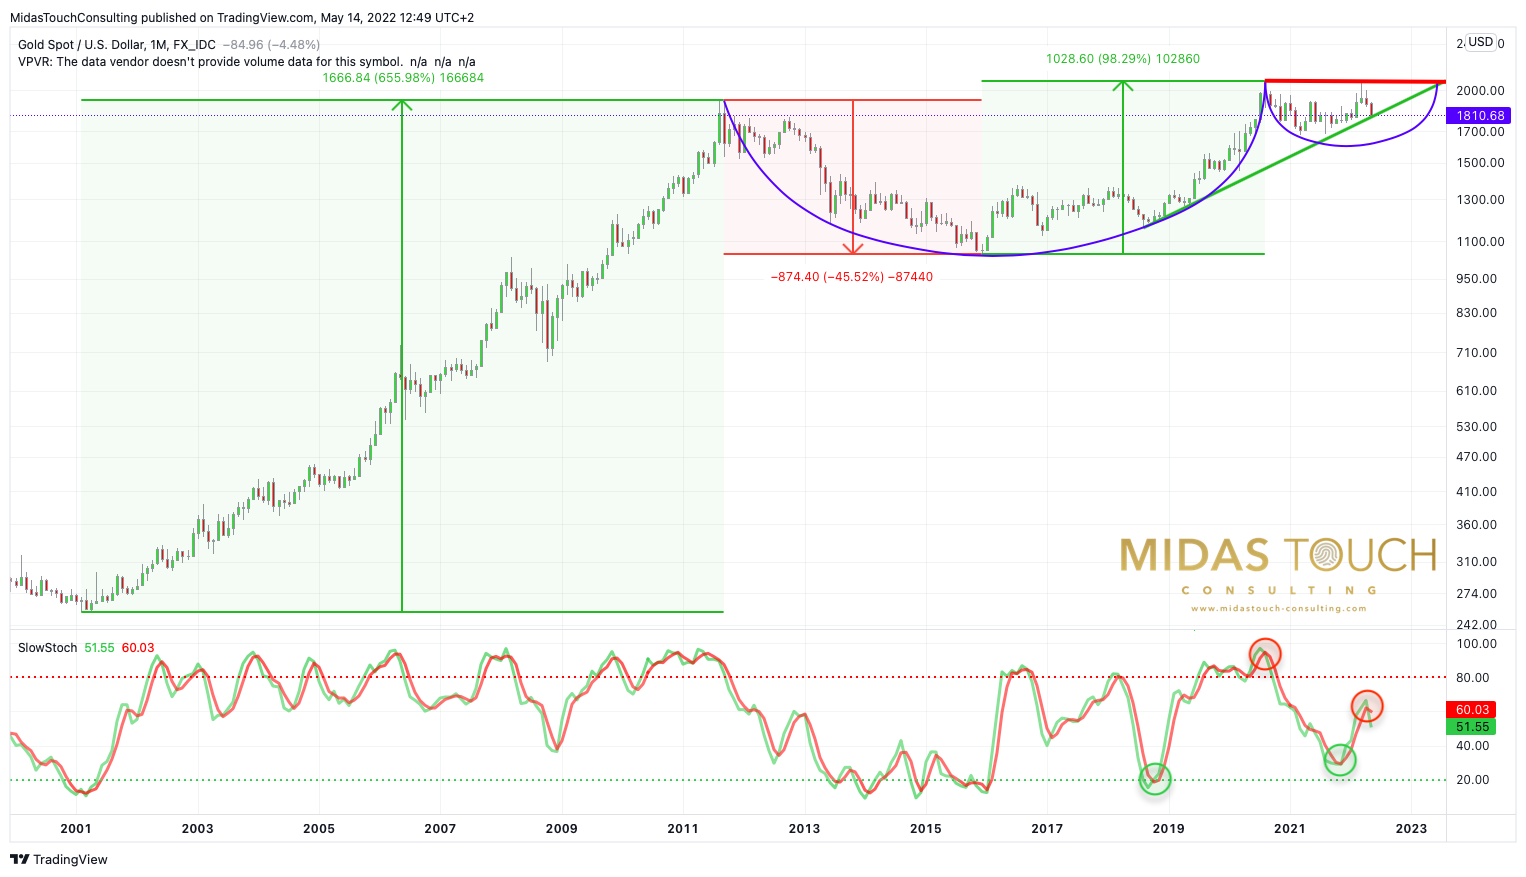 *Gold in US-Dollars, monthly chart as of May 14th, 2022. Source: Tradingview* The correction that has been going on for almost two years is therefore not yet finally over and compared to the last In Gold We Trust Report, gold is currently only trading USD 32 higher. After the support around USD 1,680 had withstood the attacks of the bears three times in the past year, gold was able to gain a good USD 390 or 23.2% within eight months from the low on August 9th, 2021, to the recent top on March 8th, 2022. However, this remarkable rally could only develop real momentum from the end of January 2022. Prior to that, gold mostly traded trickily sideways and thus created a “giving up”-mood amongst market participants shortly before the turn of the year. In the meantime, however, gold prices have come back down significantly from the spring high at USD 2,070. Actually, gold is down by USD 270 or 13%. Particularly since April 18th, when the first recovery in the gold market failed just below the mark of USD 2,000, gold went to its knees and was most recently mercilessly passed through to the downside during the brutal liquidation wave within the whole financial markets. Neither the 200-day moving average (currently USD 1,836) nor the broad support zone around USD 1,830 could stop the sell-off so far. At the current weekly closing price, however, the gold price was able to save itself into the weekend above the uptrend line that started back in August 2018. This tiny positive detail increases the chances for an imminent counter trend bounce or recovery in the short-term. In the big picture, therefore, gold is still in a consolidation or correction phase. Since the consensus of precious metals fans until recently was clearly on the immediate breakout from the large “cup with handle” formation, which was believed to be certain, the exact opposite was bound to happen, as is often the case in the markets. Nevertheless, the breakout to new all-time highs has most likely not been canceled, but only postponed. However, this would require sustained prices above USD 2,000. Then it could happen quickly. In view of the imminent price weakness, however, it is better to plan with a time frame of one to three years until the breakout above the bulwark between USD 2,000 and USD 2,070 will actually succeed. ## The Midas Touch Gold Model™ Update 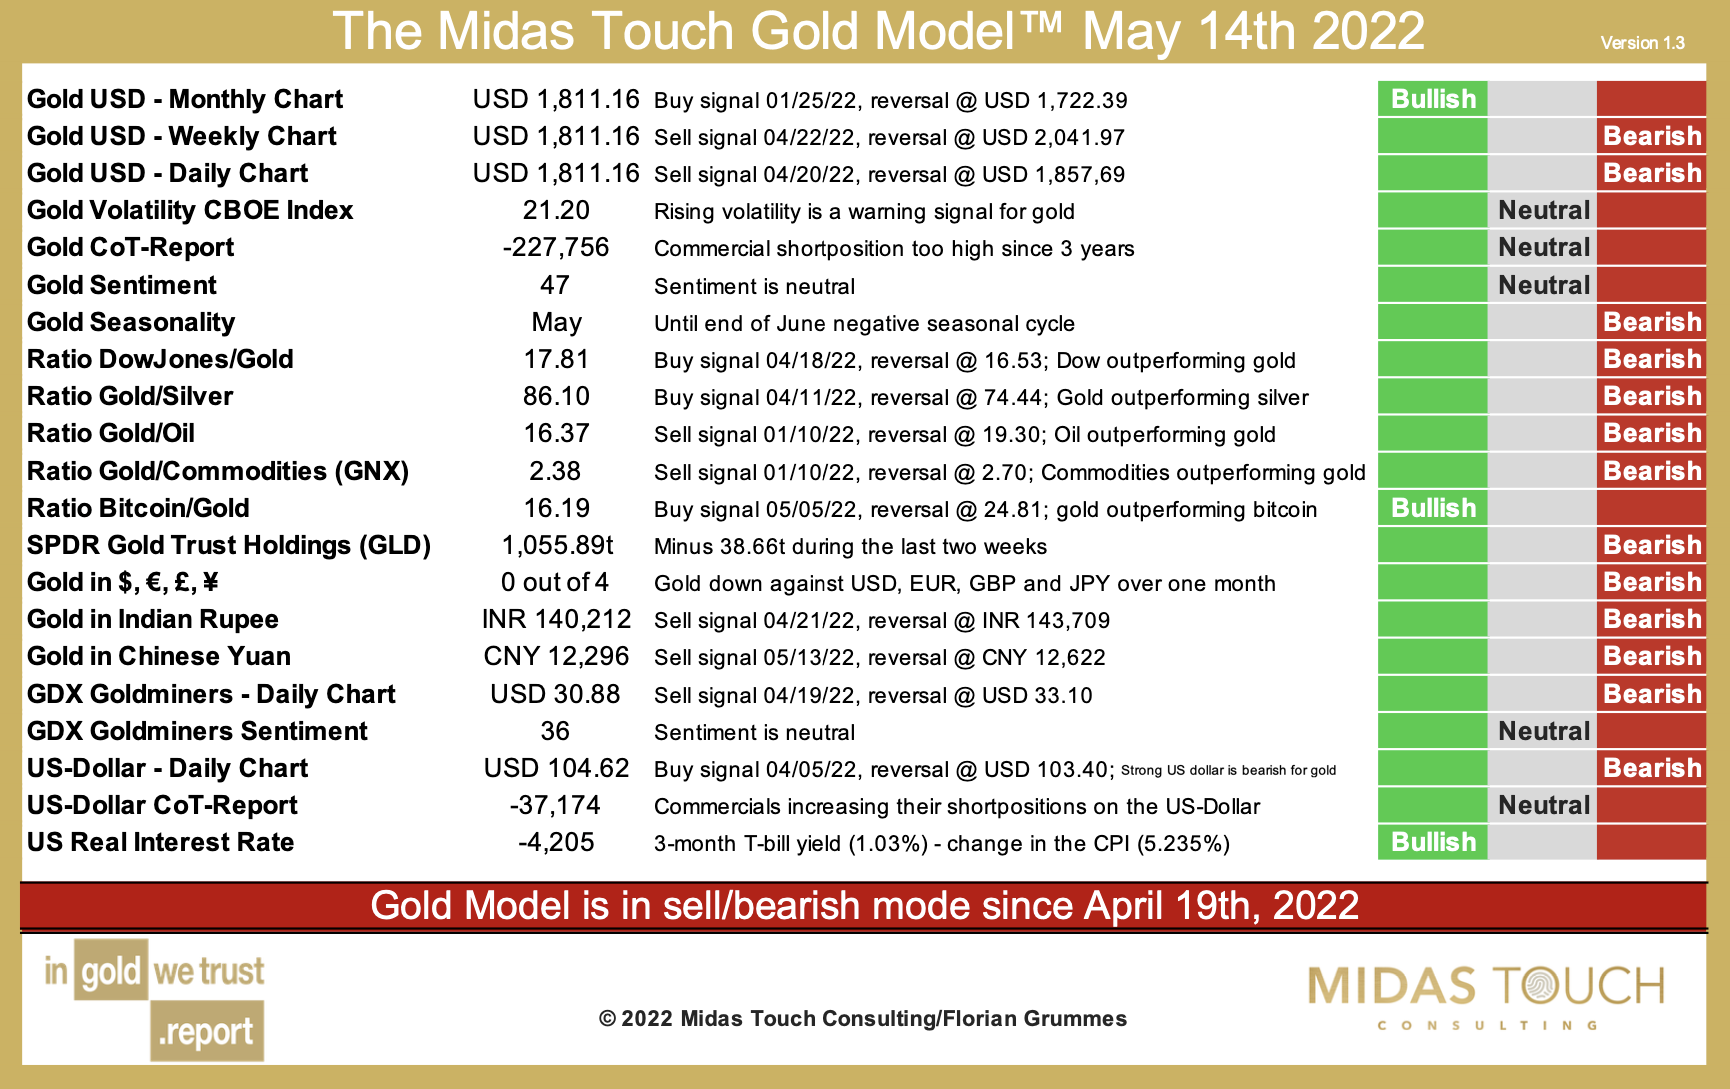 *The Midas Touch Gold Model™ as of May 14th, 2022. Source: Midas Touch Consulting* The Midas Touch Gold Model™ switched into bearish mode on April 19th, 2022. The initial setup has deteriorated further since then, and a sustainable bullish signal is currently a long way off. In retrospect, the slide below USD 1,940 between April 18th and April 22nd saw numerous individual signals switch into bearish mode. These were new sell signals on the daily and weekly charts for the gold price in U.S. dollars as well as in Indian rupees, and on the daily chart for the GDX Gold Mines ETF. In addition, there was a sell signal from the Dow Jones/gold-ratio. Due to the weak development of the silver price, the gold/silver-ratio turned already on April 11th and thus announced the drama of recent weeks early. Only the monthly chart for the gold price in U.S. dollars as well as the bitcoin/gold-ratio and the negative real interest rates in the U.S. currently contribute bullish signals. ### Overall, the following conclusions can currently be derived from the Midas Touch Gold Model™: + On the monthly chart for gold in USD, a buy signal is still active. This would currently only be negated at prices below USD 1,722. On the upside, however, prices above USD 2,041 are currently needed to classify the weekly chart as bullish again. Until then, USD 230 are currently missing. Hence, we have to assume that gold will probably need a lot of time again until a new sustainable bullish setup will be established on all three decisive time frames (monthly, weekly and daily chart). + As well, the strongly increased gold/silver-ratio makes clear that one will have to exercise patience.It may still take a long time before silver heralds the next exaggeration phase on the upside with a clear outperformance against gold. + The weakness of gold against other commodities is also striking. Since a significantly weaker oil price is not foreseeable for the time being in view of the difficult geopolitical situation and many other commodities will increasingly suffer from supply difficulties, a new buy signal for gold against commodities will probably drag on for a longer time. + Although bitcoin has mercilessly outperformed gold in recent years, the bitcoin/gold-ratio currently favors gold. Actually, it now takes just under 16 ounces of gold to buy one Bitcoin. It would be no surprise if within the next 12 months, bitcoin could temporarily be purchased for only 10 ounces or even less. + The US Dollar index gained a good 17.3% over the past 12 months and hence has been putting quite some pressure on gold, especially in recent weeks. Thanks to the steep rally, the US Dollar Index is currently trading at its highest level in 21.5 years. However, the strongly overbought and overheated situation could soon force a significant pullback, which would allow at least a temporary recovery in the gold price. Should the US Dollar index fall below 103.40, this component within the Midas Touch Gold Model™ changes to bullish for gold. ## Gold – Outlook until the summer 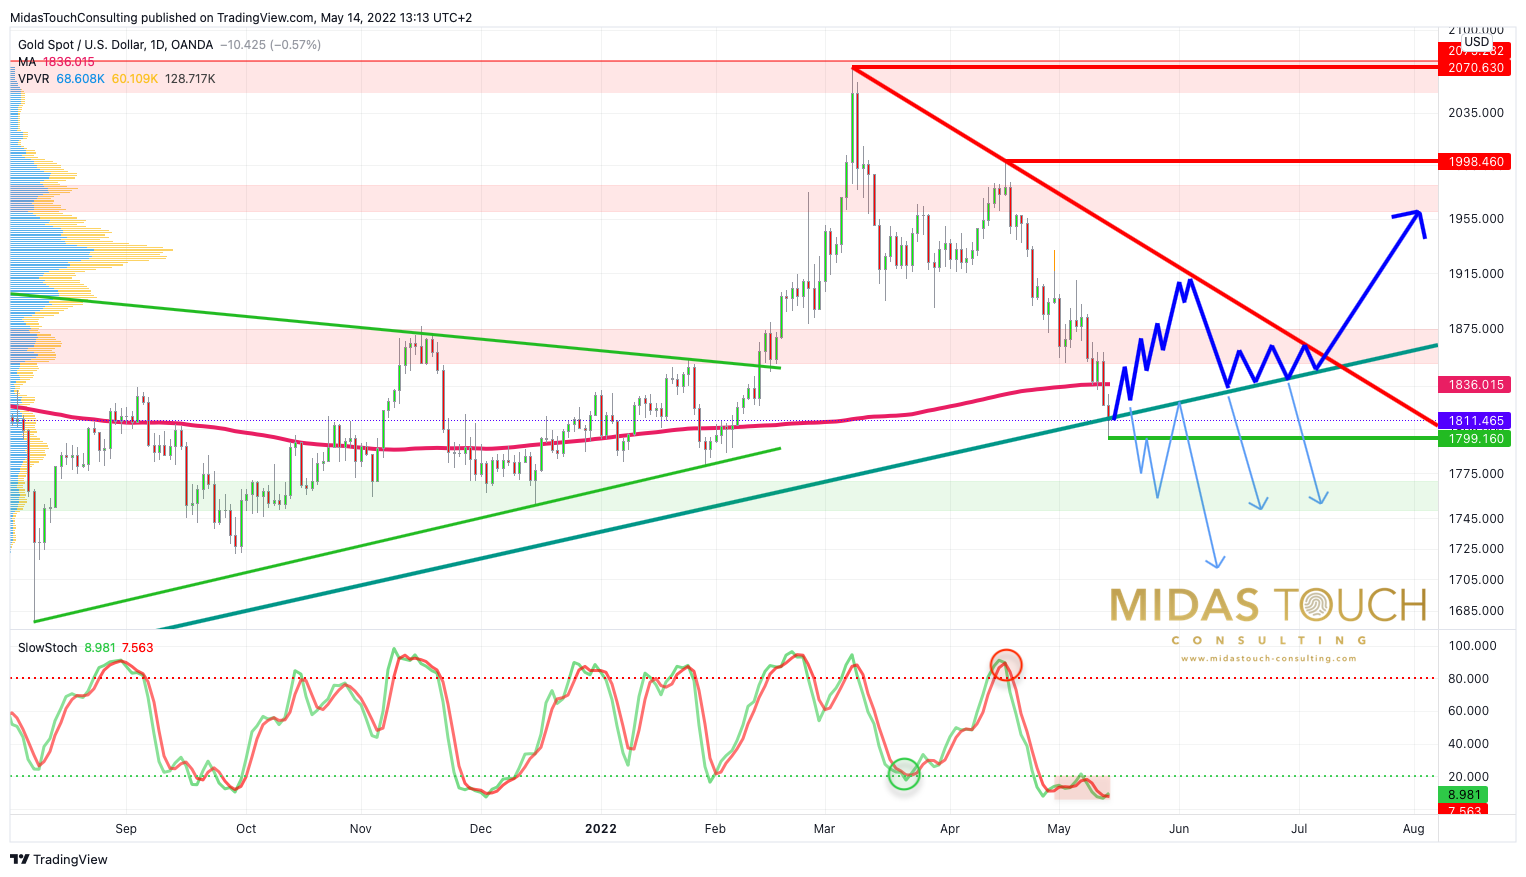 *Gold in US-Dollars, daily chart as of May 14th, 2022. Source: Tradingview* On the daily chart, gold fell from USD 1,998 to USD 1,799 without much resistance in the last 20 trading days. Thus, the large dark green uptrend line was reached on Friday but did hold at least per daily and weekly closing price. Despite this sharp price slide and a clearly oversold situation, however, hardly any signals for a bottom and a possible recovery are discernible so far. Rather, the support zone around USD 1,850 was cracked within five trading days. The 200-day moving average (currently USD 1,836) withstood the pressure of the bears for only two trading days. And the stochastic oscillator would be strongly oversold but has been embedded below 20 for 10 trading days, thus locking in the downtrend for the time being. Since the consequences of the bursting of the tech bubble are not yet fully foreseeable and a merciless liquidation wave has been pulling the rug out from under all markets on a large scale for weeks, significantly lower prices are also conceivable for the gold market. In the short term, the “actio and reactio principle” should ensure a steep interim recovery around the December low at USD 1,750 at the very latest. This bounce could also start now and lift the gold price at least back above its 200-day line in the direction of the USD 1,850 level. In a second recovery step, a presumably unsuccessful attack towards the new downtrend line around USD 1,900 would then be possible. But subsequently, the gold price would have to undergo a second test of its slightly rising 200-day moving average until midsummer, since after all, it stands better on two legs. Alternatively, the crash in the financial markets continues more or less directly. The bombed-out sentiment speaks against it, however. Similar to 2008, gold would certainly not be able to escape such a crash scenario and would probably pull back to at least USD 1,680. Therefore, in the current environment, one must continue to act very cautiously. Only those who still have sufficient liquidity at the final low will be able to successfully take advantage of the spectacular opportunities that will present themselves. All in all, the gold price is in very difficult waters, not only in technical terms, but also seasonality wise. A bullish expectation has rarely paid off in the past between March and July. The best thing to do as a gold bug in this phase is simply to patiently keep your feet still, because the start of a new uptrend or rally within the precious metals sector lasting several months is likely not starting before August. _Analysis initially written and published on May 14th, 2022. Translated into English and partially updated on May 14th, 2022._ _Feel free to join us in our free [Telegram channel](https://t.me/MidasTouchConsulting) for daily real time data and a great community._ _If you like to get regular updates on our gold model, precious metals and cryptocurrencies you can subscribe to our [free newsletter](http://bit.ly/1EUdt2K)._ |
| json metadata | {"tags":["silvergoldstackers","steemsilvergold","silver","gold","preciousmetals","trading","investing","exploration"],"image":["https://cdn.steemitimages.com/DQmZwuFEPR7WyVKaudGAHPNeQsuE6SczqdKEMhGFqS9X9Lu/midas-touch-crypto-currency-gold-model-report-a.jpg","https://cdn.steemitimages.com/DQmaRM4HhF97PRwG7kNS9c8jdCfETHF62AG3JfHsvwjnP5f/2022-05-14%20Florian%20Grummes%20-%20IGWT%202022%20-%20Chart%201%20Gold%20in%20USD%20Monatschart%20DE.png","https://cdn.steemitimages.com/DQmNg35mzCDrEPzucQv1LtvEp2DRrSeqkDfo5SPnvc8qfLm/2022-05-14%20Florian%20Grummes%20-%20IGWT%202022%20-%20Chart%202%20Gold%20Modell%20EN.png","https://cdn.steemitimages.com/DQmNMBpAP4nCoj3chPtQSRc2hDarb9mh1d2PfoCjaUwzB65/2022-05-14%20Florian%20Grummes%20-%20IGWT%202022%20-%20Chart%203%20Gold%20in%20USD%20Tageschart%20DE.png"],"links":["https://www.midastouch-consulting.com/15052022-the-midas-touch-gold-model-update","https://t.me/MidasTouchConsulting","http://bit.ly/1EUdt2K"],"app":"steemit/0.2","format":"markdown"} |
| parent author | |
| parent permlink | silvergoldstackers |
| permlink | may-15th-2022-the-midas-touch-gold-model-tm-update |
| title | May 15th, 2022: The Midas Touch Gold Model™ Update |
| Transaction Info | Block #64392365/Trx 2bd1a5446ff04f82f55303d19e357594798423a8 |
View Raw JSON Data
{
"block": 64392365,
"op": [
"comment",
{
"author": "midastouch",
"body": "\n\n# [May 15th, 2022: The Midas Touch Gold Model™ Update](https://www.midastouch-consulting.com/15052022-the-midas-touch-gold-model-update) \n\nAs in previous years, our dear friends from Incrementum gave us the opportunity to contribute an update on the current status of the Midas Touch Gold Model™ as well as present a short-to midterm outlook by Florian Grummes in their upcoming In Gold We Trust report 2022. Our Midas Touch Gold Model illuminates the gold market from many different perspectives with a rational and holistic approach. It convinces with its versatility and its quantitative measurability. Although the model is based on a lot of data, it succeeds in summarizing an extensive analysis compactly and clearly in a table and in coming to a clear conclusion. The Midas Touch Gold Model™ Update as of May 14th, 2022.\n\nNothing has such power to broaden the mind as the ability to investigate systematically and truly all that comes under thy observation in life. – Marcus Aurelius\n\n## Gold – The big picture\n\nGold prices reached a new all-time high on August 7th, 2020, with prices at USD 2,075, which is still valid today.\n\n\n*Gold in US-Dollars, monthly chart as of May 14th, 2022. Source: Tradingview*\n\nThe correction that has been going on for almost two years is therefore not yet finally over and compared to the last In Gold We Trust Report, gold is currently only trading USD 32 higher. After the support around USD 1,680 had withstood the attacks of the bears three times in the past year, gold was able to gain a good USD 390 or 23.2% within eight months from the low on August 9th, 2021, to the recent top on March 8th, 2022. However, this remarkable rally could only develop real momentum from the end of January 2022. Prior to that, gold mostly traded trickily sideways and thus created a “giving up”-mood amongst market participants shortly before the turn of the year.\n\nIn the meantime, however, gold prices have come back down significantly from the spring high at USD 2,070. Actually, gold is down by USD 270 or 13%. Particularly since April 18th, when the first recovery in the gold market failed just below the mark of USD 2,000, gold went to its knees and was most recently mercilessly passed through to the downside during the brutal liquidation wave within the whole financial markets.\n\nNeither the 200-day moving average (currently USD 1,836) nor the broad support zone around USD 1,830 could stop the sell-off so far. At the current weekly closing price, however, the gold price was able to save itself into the weekend above the uptrend line that started back in August 2018. This tiny positive detail increases the chances for an imminent counter trend bounce or recovery in the short-term.\n\nIn the big picture, therefore, gold is still in a consolidation or correction phase. Since the consensus of precious metals fans until recently was clearly on the immediate breakout from the large “cup with handle” formation, which was believed to be certain, the exact opposite was bound to happen, as is often the case in the markets. Nevertheless, the breakout to new all-time highs has most likely not been canceled, but only postponed. However, this would require sustained prices above USD 2,000. Then it could happen quickly. In view of the imminent price weakness, however, it is better to plan with a time frame of one to three years until the breakout above the bulwark between USD 2,000 and USD 2,070 will actually succeed.\n\n## The Midas Touch Gold Model™ Update\n\n*The Midas Touch Gold Model™ as of May 14th, 2022. Source: Midas Touch Consulting*\n\nThe Midas Touch Gold Model™ switched into bearish mode on April 19th, 2022. The initial setup has deteriorated further since then, and a sustainable bullish signal is currently a long way off. In retrospect, the slide below USD 1,940 between April 18th and April 22nd saw numerous individual signals switch into bearish mode. These were new sell signals on the daily and weekly charts for the gold price in U.S. dollars as well as in Indian rupees, and on the daily chart for the GDX Gold Mines ETF. In addition, there was a sell signal from the Dow Jones/gold-ratio. Due to the weak development of the silver price, the gold/silver-ratio turned already on April 11th and thus announced the drama of recent weeks early.\n\nOnly the monthly chart for the gold price in U.S. dollars as well as the bitcoin/gold-ratio and the negative real interest rates in the U.S. currently contribute bullish signals.\n\n### Overall, the following conclusions can currently be derived from the Midas Touch Gold Model™:\n\n+ On the monthly chart for gold in USD, a buy signal is still active. This would currently only be negated at prices below USD 1,722. On the upside, however, prices above USD 2,041 are currently needed to classify the weekly chart as bullish again. Until then, USD 230 are currently missing. Hence, we have to assume that gold will probably need a lot of time again until a new sustainable bullish setup will be established on all three decisive time frames (monthly, weekly and daily chart).\n+ As well, the strongly increased gold/silver-ratio makes clear that one will have to exercise patience.It may still take a long time before silver heralds the next exaggeration phase on the upside with a clear outperformance against gold.\n+ The weakness of gold against other commodities is also striking. Since a significantly weaker oil price is not foreseeable for the time being in view of the difficult geopolitical situation and many other commodities will increasingly suffer from supply difficulties, a new buy signal for gold against commodities will probably drag on for a longer time.\n+ Although bitcoin has mercilessly outperformed gold in recent years, the bitcoin/gold-ratio currently favors gold. Actually, it now takes just under 16 ounces of gold to buy one Bitcoin. It would be no surprise if within the next 12 months, bitcoin could temporarily be purchased for only 10 ounces or even less.\n+ The US Dollar index gained a good 17.3% over the past 12 months and hence has been putting quite some pressure on gold, especially in recent weeks. Thanks to the steep rally, the US Dollar Index is currently trading at its highest level in 21.5 years. However, the strongly overbought and overheated situation could soon force a significant pullback, which would allow at least a temporary recovery in the gold price. Should the US Dollar index fall below 103.40, this component within the Midas Touch Gold Model™ changes to bullish for gold.\n\n## Gold – Outlook until the summer\n\n*Gold in US-Dollars, daily chart as of May 14th, 2022. Source: Tradingview*\n\nOn the daily chart, gold fell from USD 1,998 to USD 1,799 without much resistance in the last 20 trading days. Thus, the large dark green uptrend line was reached on Friday but did hold at least per daily and weekly closing price. Despite this sharp price slide and a clearly oversold situation, however, hardly any signals for a bottom and a possible recovery are discernible so far. Rather, the support zone around USD 1,850 was cracked within five trading days. The 200-day moving average (currently USD 1,836) withstood the pressure of the bears for only two trading days. And the stochastic oscillator would be strongly oversold but has been embedded below 20 for 10 trading days, thus locking in the downtrend for the time being.\n\nSince the consequences of the bursting of the tech bubble are not yet fully foreseeable and a merciless liquidation wave has been pulling the rug out from under all markets on a large scale for weeks, significantly lower prices are also conceivable for the gold market. In the short term, the “actio and reactio principle” should ensure a steep interim recovery around the December low at USD 1,750 at the very latest. This bounce could also start now and lift the gold price at least back above its 200-day line in the direction of the USD 1,850 level. In a second recovery step, a presumably unsuccessful attack towards the new downtrend line around USD 1,900 would then be possible. But subsequently, the gold price would have to undergo a second test of its slightly rising 200-day moving average until midsummer, since after all, it stands better on two legs.\n\nAlternatively, the crash in the financial markets continues more or less directly. The bombed-out sentiment speaks against it, however. Similar to 2008, gold would certainly not be able to escape such a crash scenario and would probably pull back to at least USD 1,680. Therefore, in the current environment, one must continue to act very cautiously. Only those who still have sufficient liquidity at the final low will be able to successfully take advantage of the spectacular opportunities that will present themselves.\n\nAll in all, the gold price is in very difficult waters, not only in technical terms, but also seasonality wise. A bullish expectation has rarely paid off in the past between March and July. The best thing to do as a gold bug in this phase is simply to patiently keep your feet still, because the start of a new uptrend or rally within the precious metals sector lasting several months is likely not starting before August.\n\n_Analysis initially written and published on May 14th, 2022. Translated into English and partially updated on May 14th, 2022._ \n\n_Feel free to join us in our free [Telegram channel](https://t.me/MidasTouchConsulting) for daily real time data and a great community._ \n\n_If you like to get regular updates on our gold model, precious metals and cryptocurrencies you can subscribe to our [free newsletter](http://bit.ly/1EUdt2K)._",
"json_metadata": "{\"tags\":[\"silvergoldstackers\",\"steemsilvergold\",\"silver\",\"gold\",\"preciousmetals\",\"trading\",\"investing\",\"exploration\"],\"image\":[\"https://cdn.steemitimages.com/DQmZwuFEPR7WyVKaudGAHPNeQsuE6SczqdKEMhGFqS9X9Lu/midas-touch-crypto-currency-gold-model-report-a.jpg\",\"https://cdn.steemitimages.com/DQmaRM4HhF97PRwG7kNS9c8jdCfETHF62AG3JfHsvwjnP5f/2022-05-14%20Florian%20Grummes%20-%20IGWT%202022%20-%20Chart%201%20Gold%20in%20USD%20Monatschart%20DE.png\",\"https://cdn.steemitimages.com/DQmNg35mzCDrEPzucQv1LtvEp2DRrSeqkDfo5SPnvc8qfLm/2022-05-14%20Florian%20Grummes%20-%20IGWT%202022%20-%20Chart%202%20Gold%20Modell%20EN.png\",\"https://cdn.steemitimages.com/DQmNMBpAP4nCoj3chPtQSRc2hDarb9mh1d2PfoCjaUwzB65/2022-05-14%20Florian%20Grummes%20-%20IGWT%202022%20-%20Chart%203%20Gold%20in%20USD%20Tageschart%20DE.png\"],\"links\":[\"https://www.midastouch-consulting.com/15052022-the-midas-touch-gold-model-update\",\"https://t.me/MidasTouchConsulting\",\"http://bit.ly/1EUdt2K\"],\"app\":\"steemit/0.2\",\"format\":\"markdown\"}",
"parent_author": "",
"parent_permlink": "silvergoldstackers",
"permlink": "may-15th-2022-the-midas-touch-gold-model-tm-update",
"title": "May 15th, 2022: The Midas Touch Gold Model™ Update"
}
],
"op_in_trx": 0,
"timestamp": "2022-05-22T13:32:18",
"trx_id": "2bd1a5446ff04f82f55303d19e357594798423a8",
"trx_in_block": 2,
"virtual_op": 0
}midastouchclaimed reward balance: 0.217 SBD, 0.604 SP2022/04/20 14:28:54
midastouchclaimed reward balance: 0.217 SBD, 0.604 SP
2022/04/20 14:28:54
| account | midastouch |
| reward sbd | 0.217 SBD |
| reward steem | 0.000 STEEM |
| reward vests | 982.200087 VESTS |
| Transaction Info | Block #63475185/Trx d66ca708f84aa4c284ed131f8abfd8f946d2a277 |
View Raw JSON Data
{
  "block": 63475185,
  "op": [
    "claim_reward_balance",
    {
      "account": "midastouch",
      "reward_sbd": "0.217 SBD",
      "reward_steem": "0.000 STEEM",
      "reward_vests": "982.200087 VESTS"
    }
  ],
  "op_in_trx": 0,
  "timestamp": "2022-04-20T14:28:54",
  "trx_id": "d66ca708f84aa4c284ed131f8abfd8f946d2a277",
  "trx_in_block": 3,
  "virtual_op": 0
}midastouchreceived 0.106 SBD, 0.302 SP author reward for @midastouch / march-30th-2022-gold-chartbook-the-big-boys-are-playing-yoyo2022/04/06 14:52:21
midastouchreceived 0.106 SBD, 0.302 SP author reward for @midastouch / march-30th-2022-gold-chartbook-the-big-boys-are-playing-yoyo
2022/04/06 14:52:21
| author | midastouch |
| permlink | march-30th-2022-gold-chartbook-the-big-boys-are-playing-yoyo |
| sbd payout | 0.106 SBD |
| steem payout | 0.000 STEEM |
| vesting payout | 490.919750 VESTS |
| Transaction Info | Block #63075760/Virtual Operation #8 |
View Raw JSON Data
{
  "block": 63075760,
  "op": [
    "author_reward",
    {
      "author": "midastouch",
      "permlink": "march-30th-2022-gold-chartbook-the-big-boys-are-playing-yoyo",
      "sbd_payout": "0.106 SBD",
      "steem_payout": "0.000 STEEM",
      "vesting_payout": "490.919750 VESTS"
    }
  ],
  "op_in_trx": 0,
  "timestamp": "2022-04-06T14:52:21",
  "trx_id": "0000000000000000000000000000000000000000",
  "trx_in_block": 4294967295,
  "virtual_op": 8
}pocket-changeupvoted (100.00%) @midastouch / march-30th-2022-gold-chartbook-the-big-boys-are-playing-yoyo2022/03/30 20:39:42
pocket-changeupvoted (100.00%) @midastouch / march-30th-2022-gold-chartbook-the-big-boys-are-playing-yoyo
2022/03/30 20:39:42
| author | midastouch |
| permlink | march-30th-2022-gold-chartbook-the-big-boys-are-playing-yoyo |
| voter | pocket-change |
| weight | 10000 (100.00%) |
| Transaction Info | Block #62882051/Trx 5125e119c84e3620b192dd7e9b93d15788ddb744 |
View Raw JSON Data
{
  "block": 62882051,
  "op": [
    "vote",
    {
      "author": "midastouch",
      "permlink": "march-30th-2022-gold-chartbook-the-big-boys-are-playing-yoyo",
      "voter": "pocket-change",
      "weight": 10000
    }
  ],
  "op_in_trx": 0,
  "timestamp": "2022-03-30T20:39:42",
  "trx_id": "5125e119c84e3620b192dd7e9b93d15788ddb744",
  "trx_in_block": 0,
  "virtual_op": 0
}rewards-poolupvoted (100.00%) @midastouch / march-30th-2022-gold-chartbook-the-big-boys-are-playing-yoyo2022/03/30 15:15:24
rewards-poolupvoted (100.00%) @midastouch / march-30th-2022-gold-chartbook-the-big-boys-are-playing-yoyo
2022/03/30 15:15:24
| author | midastouch |
| permlink | march-30th-2022-gold-chartbook-the-big-boys-are-playing-yoyo |
| voter | rewards-pool |
| weight | 10000 (100.00%) |
| Transaction Info | Block #62875596/Trx 4f22e41e094ce820887404db390ddb5b7d7227d2 |
View Raw JSON Data
{
  "block": 62875596,
  "op": [
    "vote",
    {
      "author": "midastouch",
      "permlink": "march-30th-2022-gold-chartbook-the-big-boys-are-playing-yoyo",
      "voter": "rewards-pool",
      "weight": 10000
    }
  ],
  "op_in_trx": 0,
  "timestamp": "2022-03-30T15:15:24",
  "trx_id": "4f22e41e094ce820887404db390ddb5b7d7227d2",
  "trx_in_block": 4,
  "virtual_op": 0
}mypreciousupvoted (100.00%) @midastouch / march-30th-2022-gold-chartbook-the-big-boys-are-playing-yoyo2022/03/30 15:14:57
mypreciousupvoted (100.00%) @midastouch / march-30th-2022-gold-chartbook-the-big-boys-are-playing-yoyo
2022/03/30 15:14:57
| author | midastouch |
| permlink | march-30th-2022-gold-chartbook-the-big-boys-are-playing-yoyo |
| voter | myprecious |
| weight | 10000 (100.00%) |
| Transaction Info | Block #62875587/Trx d2cf62df287ee9fc87aca4f738b38c7e19226a0a |
View Raw JSON Data
{
  "block": 62875587,
  "op": [
    "vote",
    {
      "author": "midastouch",
      "permlink": "march-30th-2022-gold-chartbook-the-big-boys-are-playing-yoyo",
      "voter": "myprecious",
      "weight": 10000
    }
  ],
  "op_in_trx": 0,
  "timestamp": "2022-03-30T15:14:57",
  "trx_id": "d2cf62df287ee9fc87aca4f738b38c7e19226a0a",
  "trx_in_block": 0,
  "virtual_op": 0
}bankofwelshieupvoted (100.00%) @midastouch / march-30th-2022-gold-chartbook-the-big-boys-are-playing-yoyo2022/03/30 15:14:18
bankofwelshieupvoted (100.00%) @midastouch / march-30th-2022-gold-chartbook-the-big-boys-are-playing-yoyo
2022/03/30 15:14:18
| author | midastouch |
| permlink | march-30th-2022-gold-chartbook-the-big-boys-are-playing-yoyo |
| voter | bankofwelshie |
| weight | 10000 (100.00%) |
| Transaction Info | Block #62875574/Trx 7725fa8a2176483b153cba4679e419d16c2d40f9 |
View Raw JSON Data
{
  "block": 62875574,
  "op": [
    "vote",
    {
      "author": "midastouch",
      "permlink": "march-30th-2022-gold-chartbook-the-big-boys-are-playing-yoyo",
      "voter": "bankofwelshie",
      "weight": 10000
    }
  ],
  "op_in_trx": 0,
  "timestamp": "2022-03-30T15:14:18",
  "trx_id": "7725fa8a2176483b153cba4679e419d16c2d40f9",
  "trx_in_block": 17,
  "virtual_op": 0
}welshstackerupvoted (100.00%) @midastouch / march-30th-2022-gold-chartbook-the-big-boys-are-playing-yoyo2022/03/30 15:13:54
welshstackerupvoted (100.00%) @midastouch / march-30th-2022-gold-chartbook-the-big-boys-are-playing-yoyo
2022/03/30 15:13:54
| author | midastouch |
| permlink | march-30th-2022-gold-chartbook-the-big-boys-are-playing-yoyo |
| voter | welshstacker |
| weight | 10000 (100.00%) |
| Transaction Info | Block #62875566/Trx ae43eaa477272fee826ffcb7a0edc0d77e235bf3 |
View Raw JSON Data
{
  "block": 62875566,
  "op": [
    "vote",
    {
      "author": "midastouch",
      "permlink": "march-30th-2022-gold-chartbook-the-big-boys-are-playing-yoyo",
      "voter": "welshstacker",
      "weight": 10000
    }
  ],
  "op_in_trx": 0,
  "timestamp": "2022-03-30T15:13:54",
  "trx_id": "ae43eaa477272fee826ffcb7a0edc0d77e235bf3",
  "trx_in_block": 1,
  "virtual_op": 0
}2022/03/30 15:12:36
2022/03/30 15:12:36
| author | midastouch |
| permlink | march-30th-2022-gold-chartbook-the-big-boys-are-playing-yoyo |
| voter | ssg-community |
| weight | 2600 (26.00%) |
| Transaction Info | Block #62875540/Trx 949489820cabc71873e8c3d5a8fa15910a43d8f3 |
View Raw JSON Data
{
  "block": 62875540,
  "op": [
    "vote",
    {
      "author": "midastouch",
      "permlink": "march-30th-2022-gold-chartbook-the-big-boys-are-playing-yoyo",
      "voter": "ssg-community",
      "weight": 2600
    }
  ],
  "op_in_trx": 0,
  "timestamp": "2022-03-30T15:12:36",
  "trx_id": "949489820cabc71873e8c3d5a8fa15910a43d8f3",
  "trx_in_block": 1,
  "virtual_op": 0
}midastouchupvoted (100.00%) @midastouch / march-30th-2022-gold-chartbook-the-big-boys-are-playing-yoyo2022/03/30 14:54:33
midastouchupvoted (100.00%) @midastouch / march-30th-2022-gold-chartbook-the-big-boys-are-playing-yoyo
2022/03/30 14:54:33
| author | midastouch |
| permlink | march-30th-2022-gold-chartbook-the-big-boys-are-playing-yoyo |
| voter | midastouch |
| weight | 10000 (100.00%) |
| Transaction Info | Block #62875179/Trx a1b23ecd05be1feb9b019e5431fe1ba10773e85b |
View Raw JSON Data
{
  "block": 62875179,
  "op": [
    "vote",
    {
      "author": "midastouch",
      "permlink": "march-30th-2022-gold-chartbook-the-big-boys-are-playing-yoyo",
      "voter": "midastouch",
      "weight": 10000
    }
  ],
  "op_in_trx": 0,
  "timestamp": "2022-03-30T14:54:33",
  "trx_id": "a1b23ecd05be1feb9b019e5431fe1ba10773e85b",
  "trx_in_block": 1,
  "virtual_op": 0
}midastouchpublished a new post: march-30th-2022-gold-chartbook-the-big-boys-are-playing-yoyo2022/03/30 14:52:21
midastouchpublished a new post: march-30th-2022-gold-chartbook-the-big-boys-are-playing-yoyo
2022/03/30 14:52:21
| author | midastouch |
| body |  # [March 30th 2022, Gold Chartbook – The big boys are playing yoyo](https://www.midastouch-consulting.com/gold-chartbook-20012022-rally-still-has-room) In our last gold chartbook from March 19th, 2021, we assumed that gold had likely started its typical correction in spring. At the same time we figured, that the first leg down from US$2,070 to US$1,895 might have run its course and that a strong bounce back to US$1,960 and maybe even above US$2,000 should follow. So far, gold made it back to US$1,965 last Friday, but has since then sold off strongly once again. Gold – The big boys are playing Yoyo. With a large trading range between US$1,930 and US$1,890 yesterday was another memorable trading day in the gold market. Already the start into this trading week had a stale flavor as gold dropped to US$1,917 on Monday. ### First notice day of COMEX April futures on Thursday The background story might once again be a toxic mix of institutional window-dressing towards the end of the quarter coupled with the expiry date of the COMEX April gold options as well as the expiration of the April future contracts. Next is the first notice day of COMEX April futures on Thursday, March 31st. Hence, whoever is long gold April contracts at the close of today has to have the account fully funded (full price of the contract) with the intention to take physical delivery. The big boys and the bullion banks are playing this game pretty successful for decades already. Their goal is to discourage long gold contract holders from taking physical delivery and spook retail money from buying gold with these crazy, volatile moves. On top, the current macro setup warrants further attacks on gold, as the petrodollar system is under severe pressure due to the sanctions against Russia and the exclusion of Russia from the Swift system. Russia will only accept rubles, oil and bitcoin for its gas and oil. A move that shady dictators paid with their power and their lives in the past. However, Russia is a different caliber though, and we can only hope that the warmongers in the east and west will calm down quickly. Realistically, however, we must rather assume the worst! In the very short-term, gold might remain under pressure, even though yesterday’s V-recovery is looking promising. On the first notice day and thereafter, gold might then be allowed to more or less freely trade again. 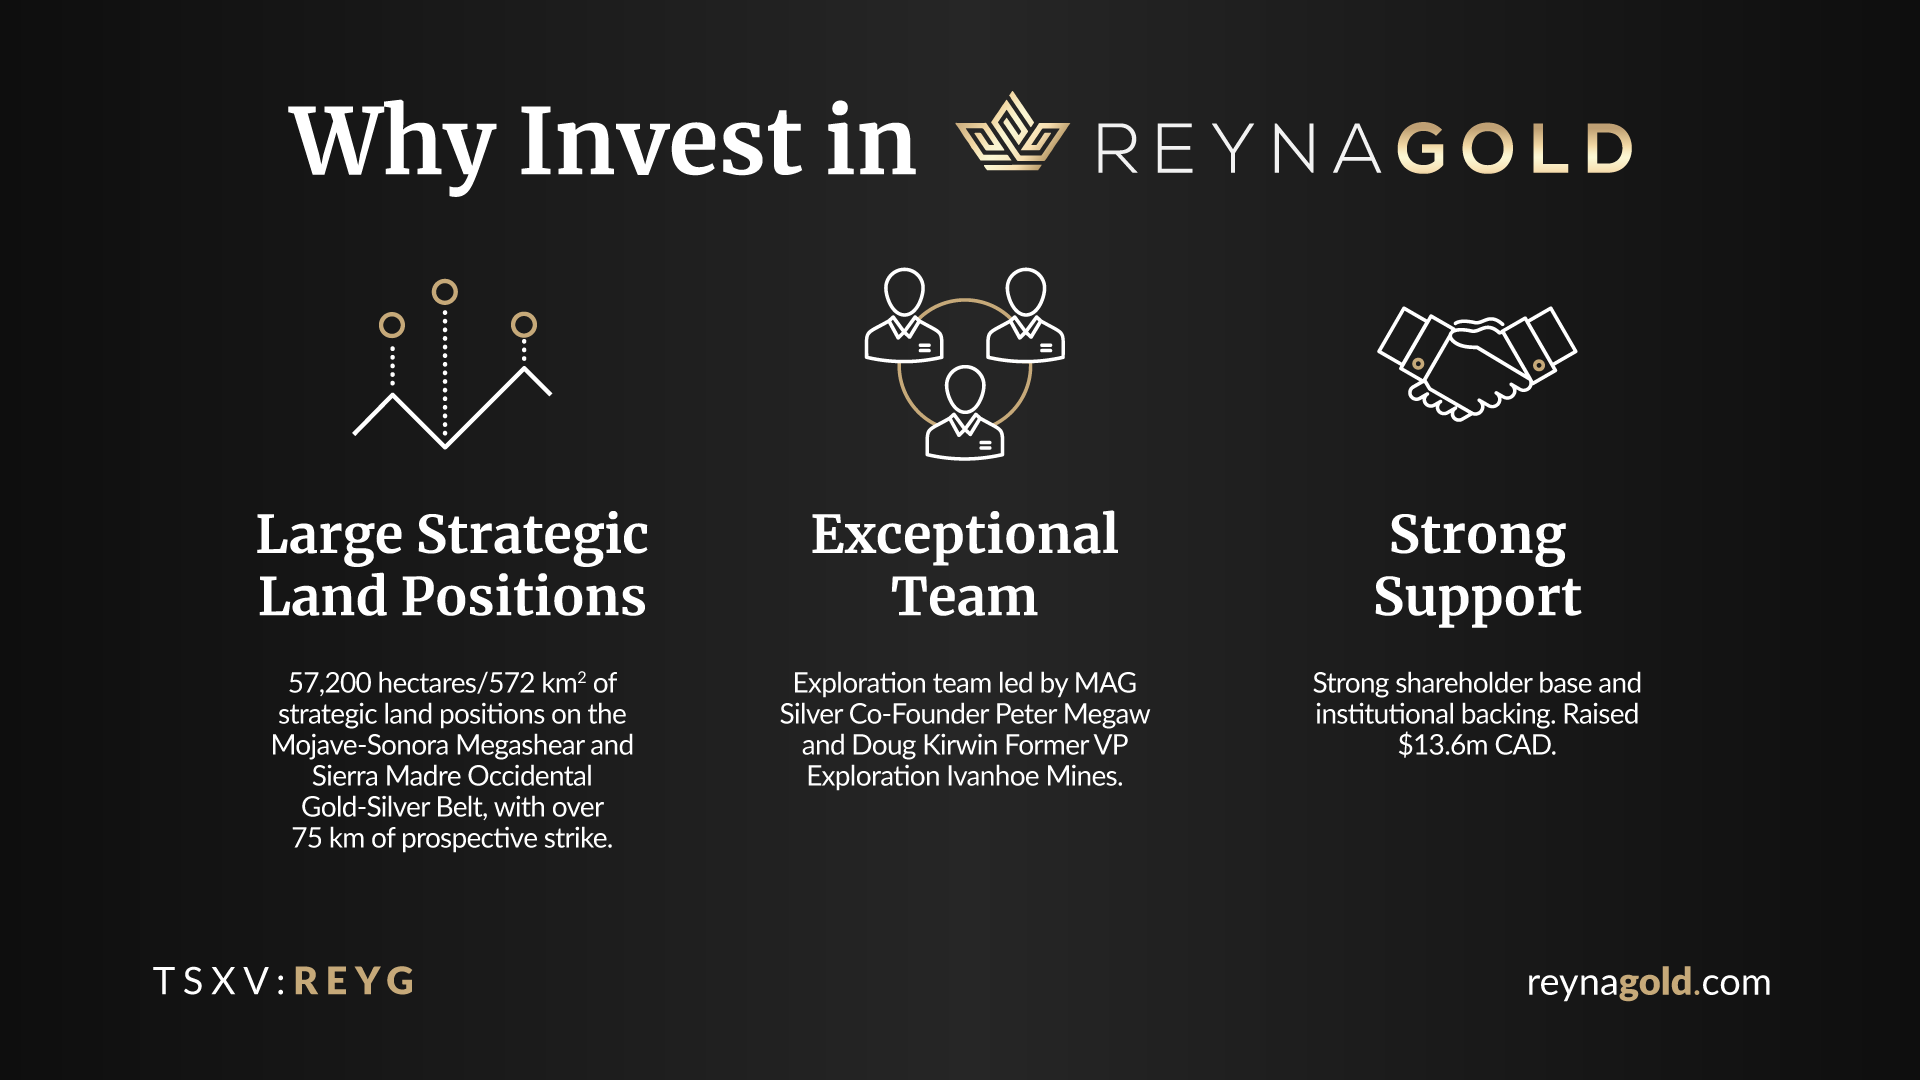 ### Gold in US-Dollar, weekly chart as of March 30th, 2022. 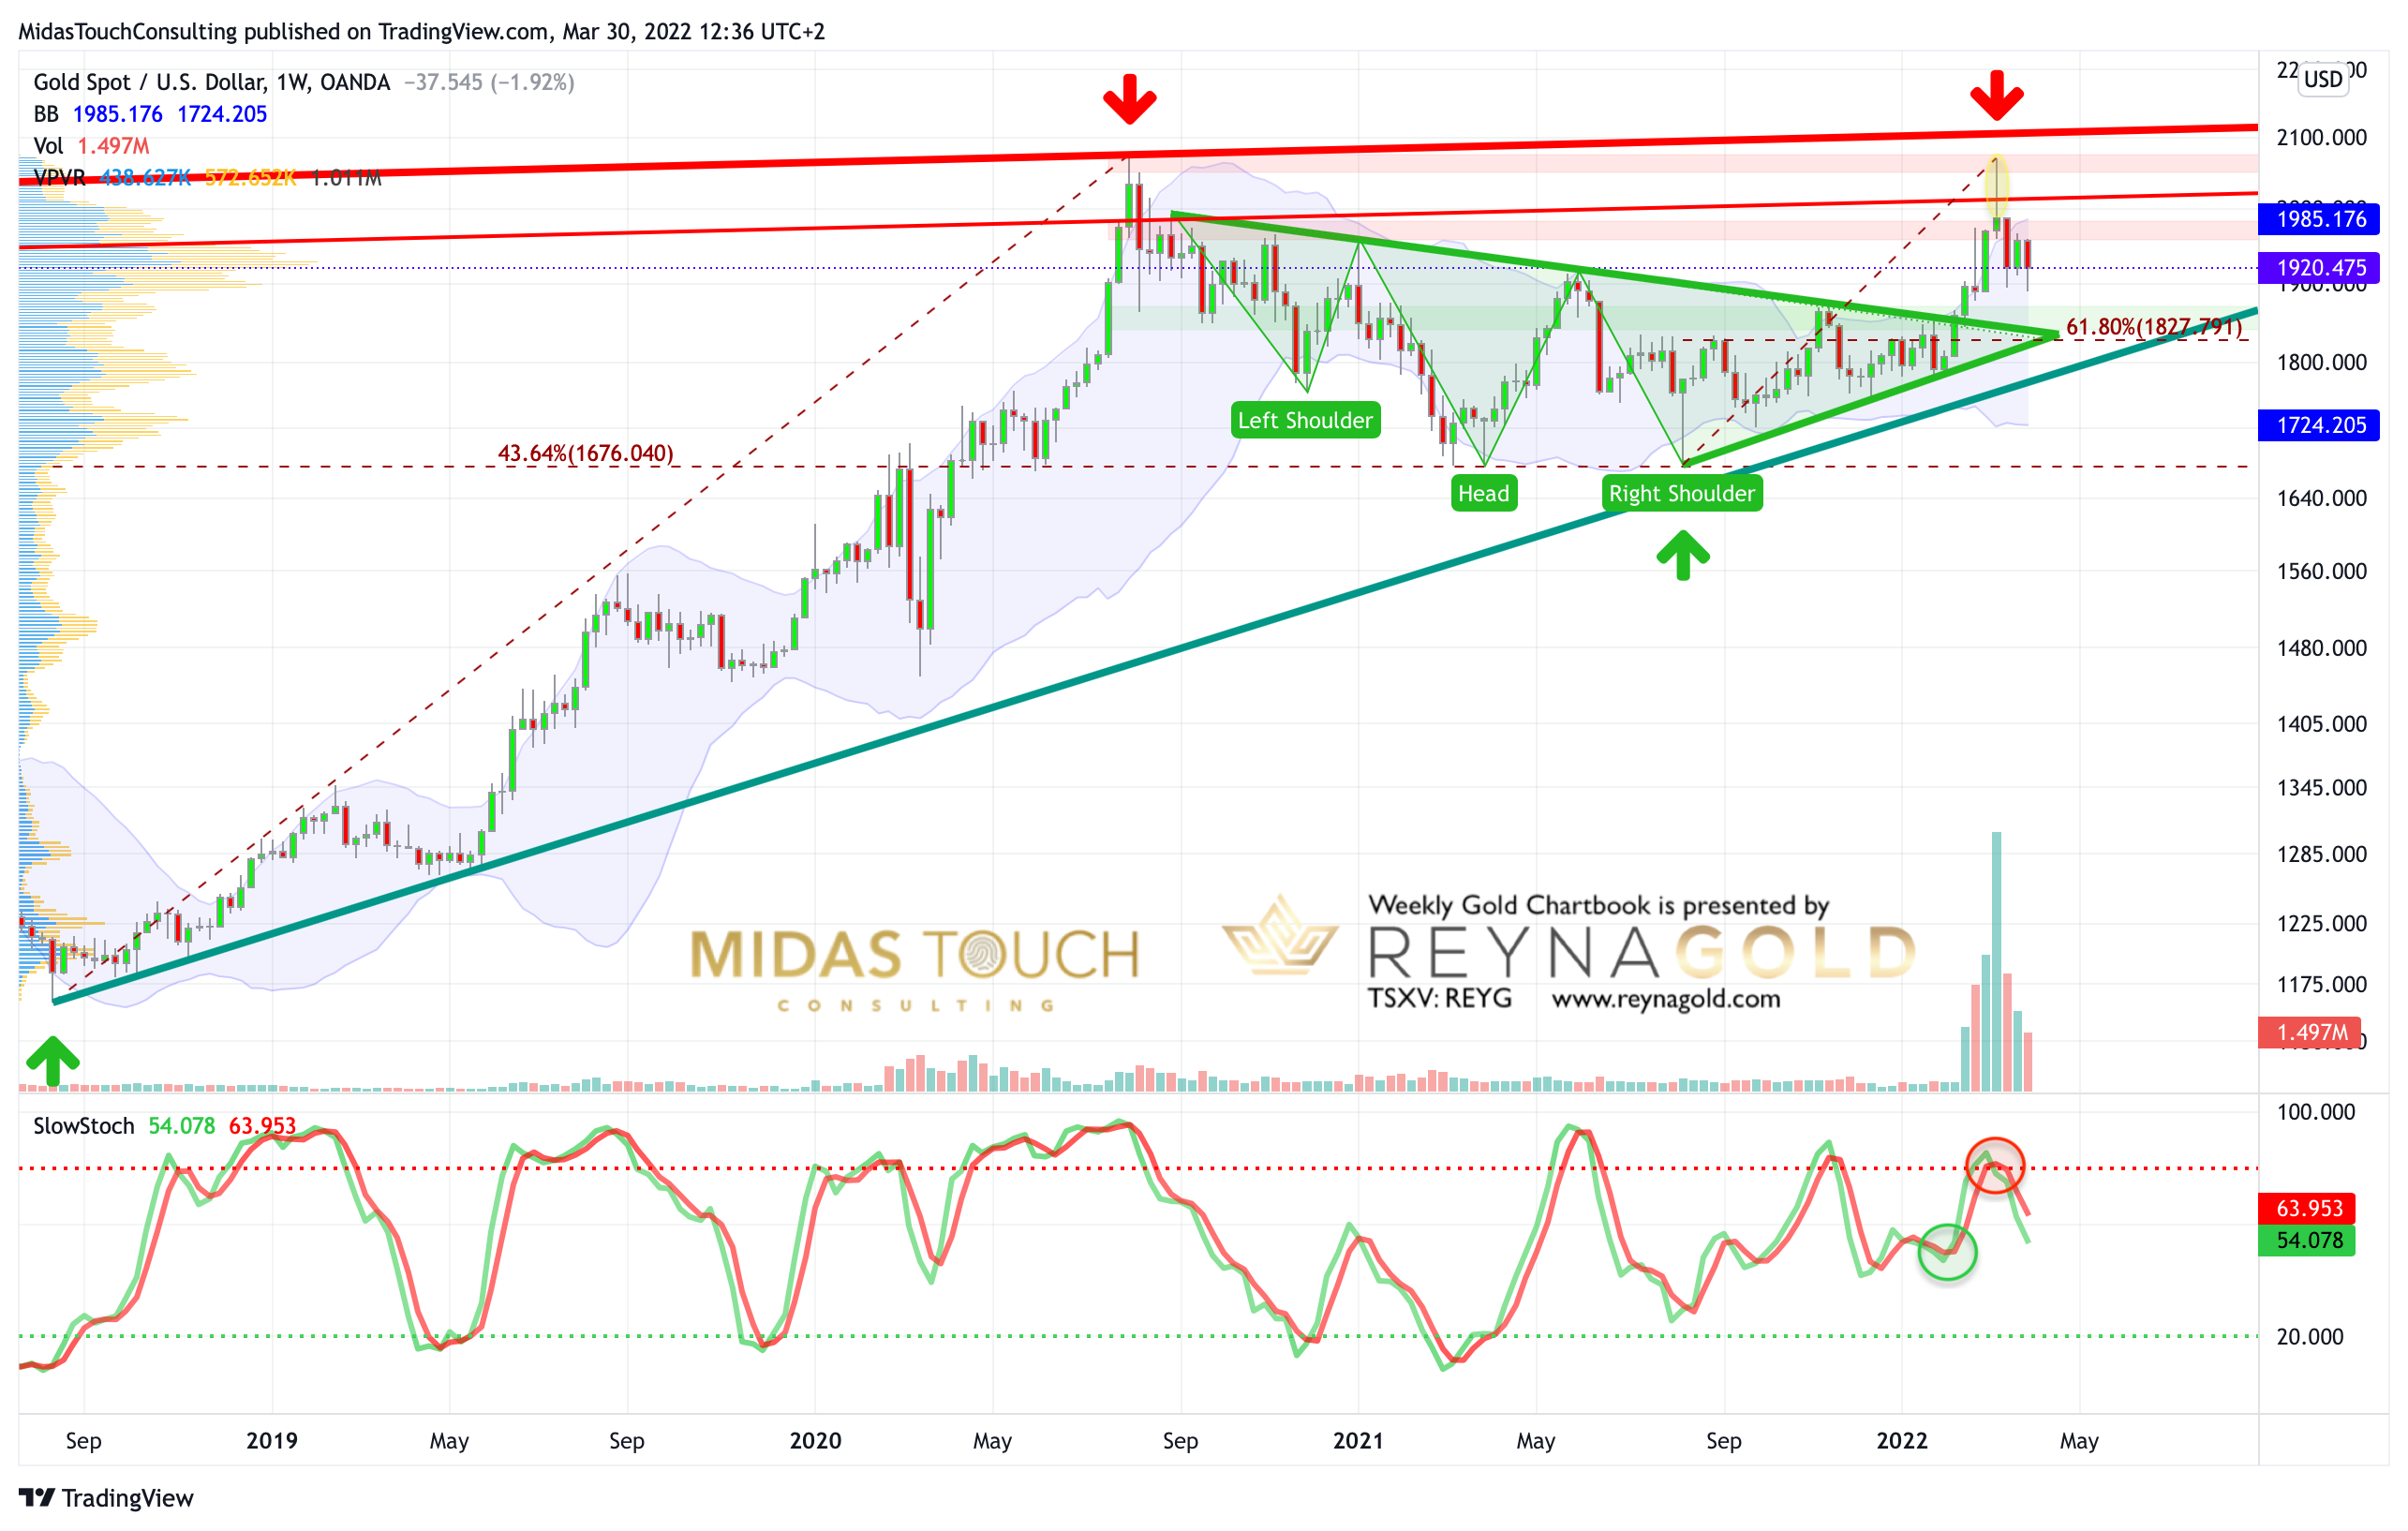 *Gold in US-Dollar, weekly chart as of March 30th, 2022.* On the weekly chart, the big reversal candle still dictates the picture. Due to that, we have to assume that at some point gold will need to test the triangle breakout zone around US$1,820 to US$1,850. However, this could take months. For the last two weeks, gold has been trading sideways in a very volatile fashion between US$1,890 and US$1,965. The long wicks indicated that prices between US$1,890 and US$1,915 might encourage buyers to step in again. Obviously, this support has to hold. Otherwise, more downside will be activated. Since the stochastic oscillator is on a sell signal, gold remains vulnerable in the medium term. It will take much more time until the oscillator would reach its oversold zone for a contrarian buy signal. Overall, the weekly chart is bearish and continues to advise caution and patience. ### Gold in US-Dollar, daily chart as of March 30th, 2022. 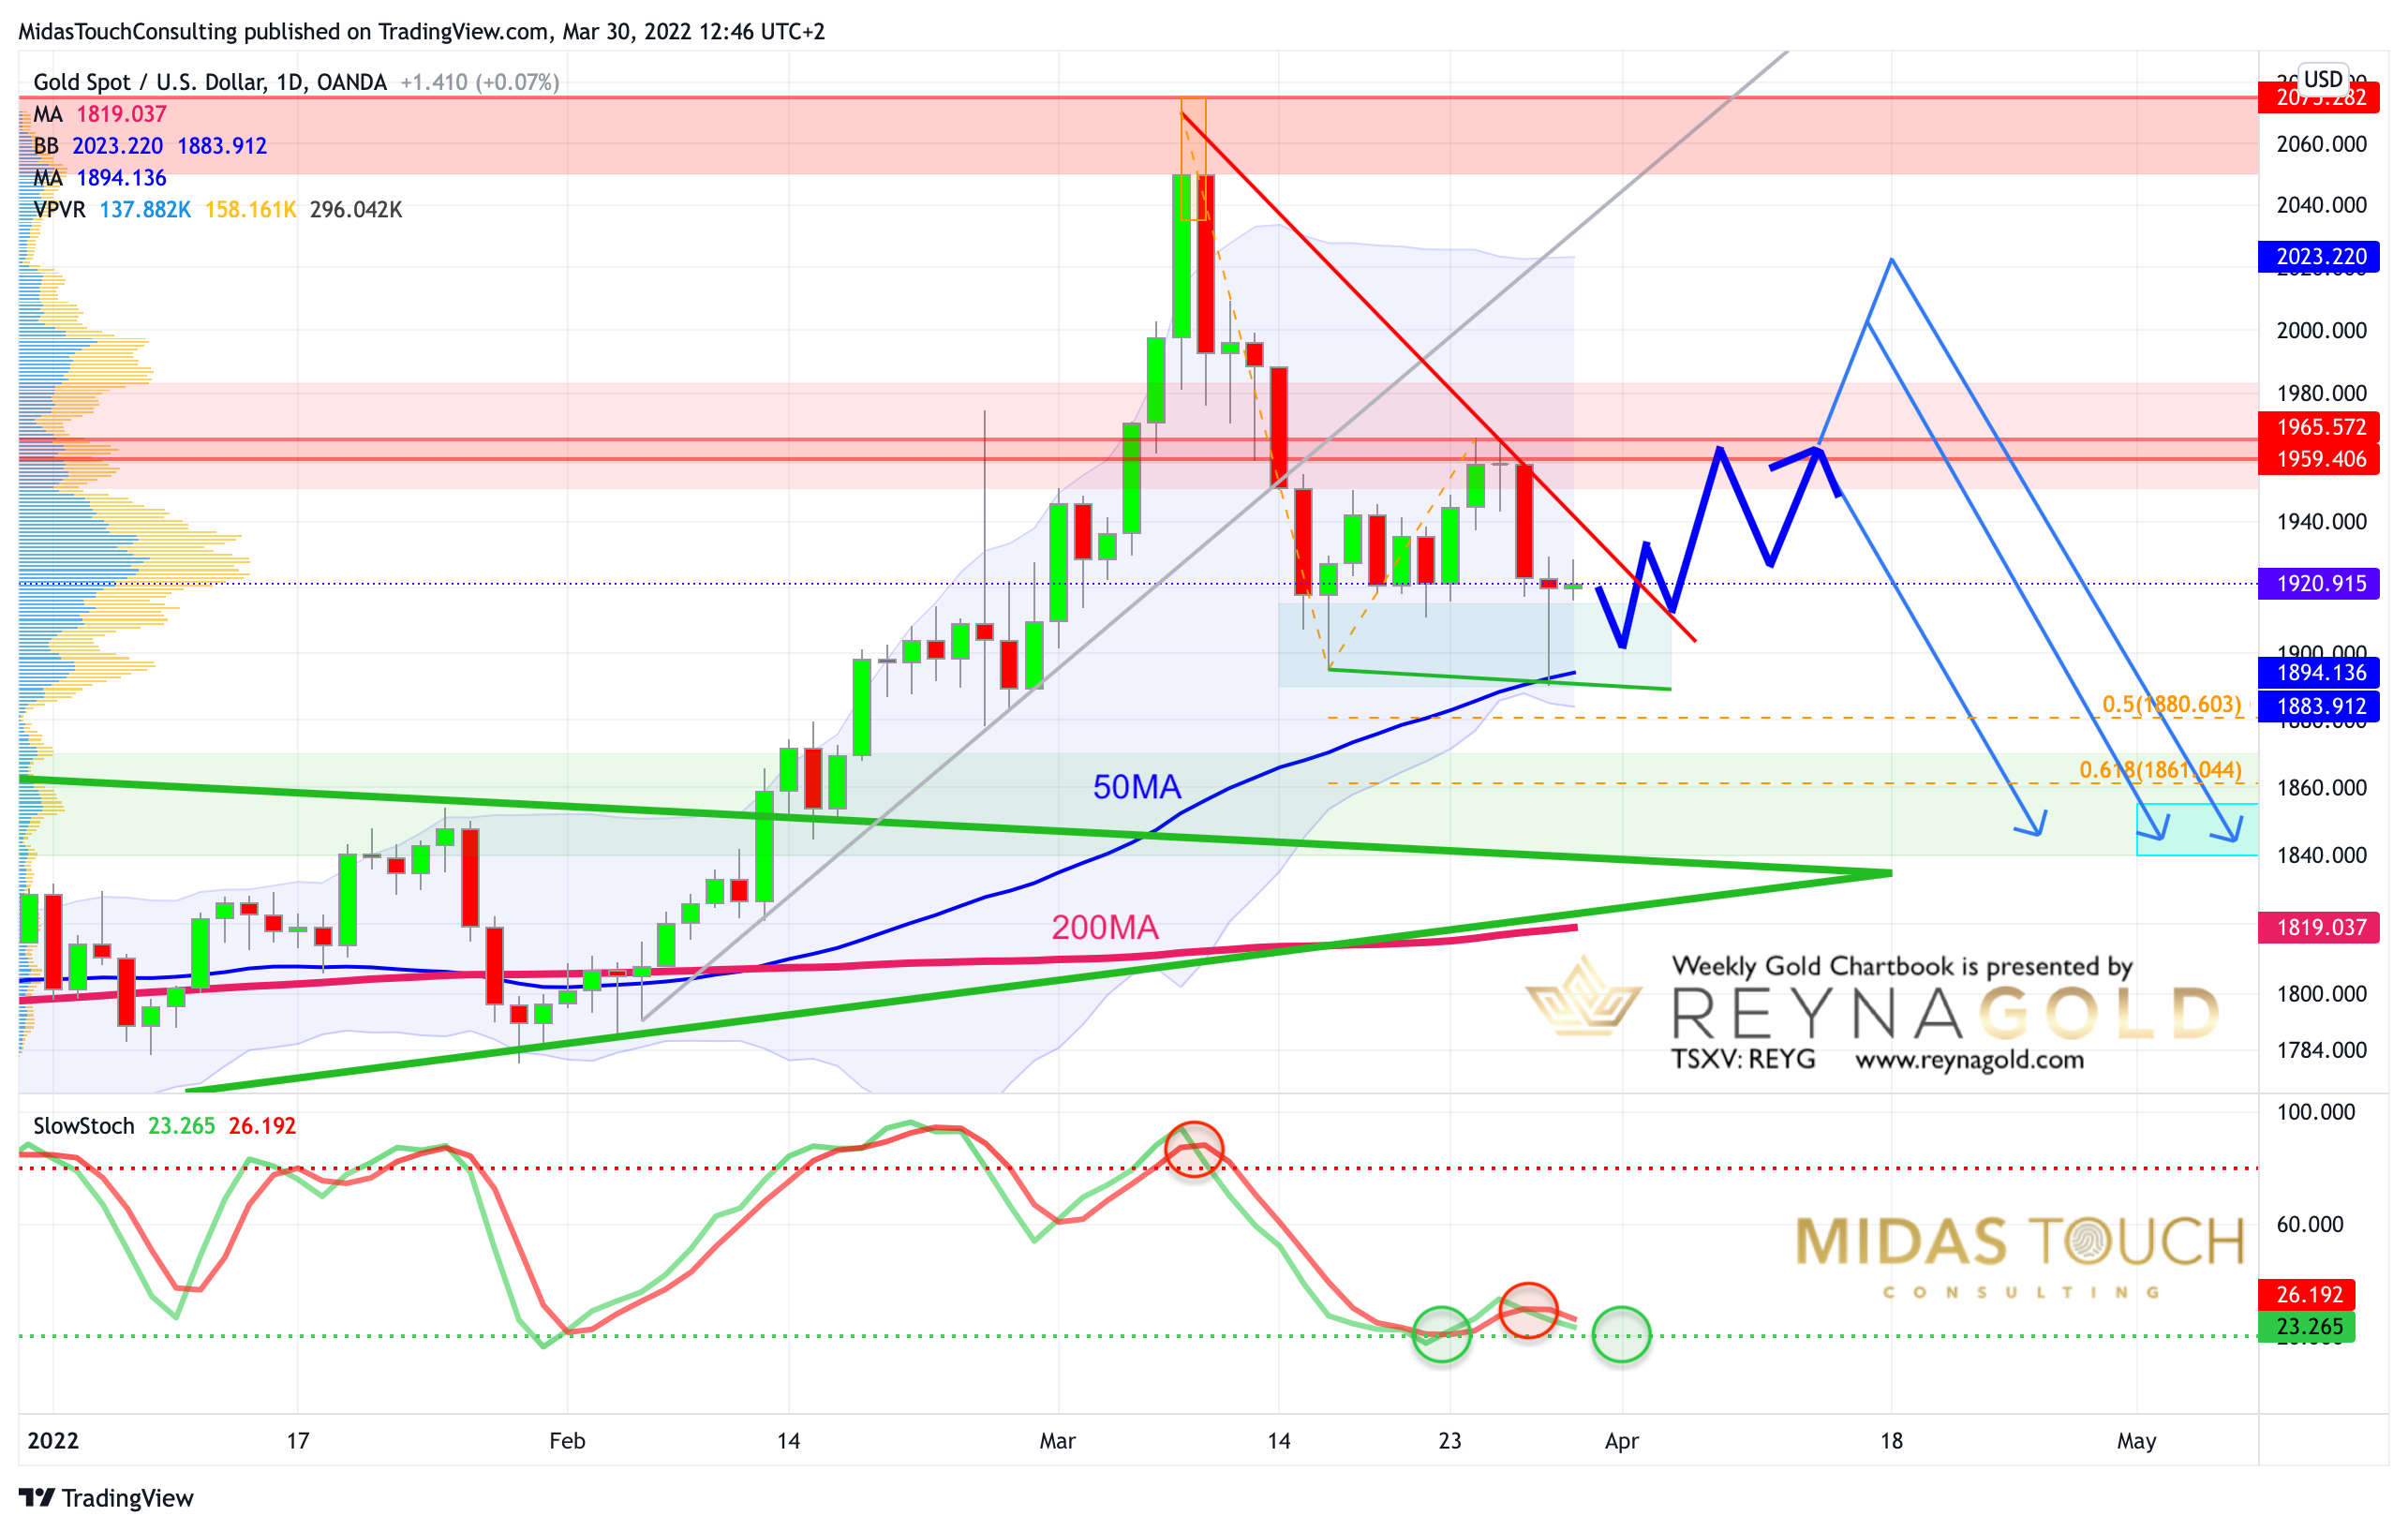 *Gold in US-Dollar, daily chart as of March 30th, 2022.* The rather good news is coming from the daily chart since the stochastic oscillator is kind of oversold and hence in a promising position for another recovery rally. A bounce back to last Friday’s high at US$1,965 seems possible. And even a further recovery towards US$2,000 still seems possible. Overall, the daily chart is once again slightly oversold and gold might start another bounce soon. ### Conclusion: The big boys are playing yoyo With inflation moving towards double digits, worldwide energy and food supply in danger and a war in Ukraine, whose end is unfortunately not in sight, everyone is well advised to park part of their assets in the safe haven of physical precious metals. While the fundamentals for gold are more bullish than ever, the price action has been a nerve-wracking roller coaster over the last few weeks. It seems that this is the only way to hold off a mainstream run into gold. However, with many central banks (especially in the Middle East) urgently needing to diversify out of their US-Dollar nominated assets and Russians now trading oil for gold, gold prices should remain well-supported for the time being. At the same time, a deflationary spiral is constantly lurking in the background. Just two days ago, the G7 countries rejected the Russian demand for gas and oil payment in rubles. However, the German industry desperately needs the Russian natural gas for its plants. An expert from BASF warned of the dramatic consequences of an immediate import stop for the chemical giant. A production stop due to energy shortages would be disastrous and very deflationary, of course. Furthermore, central bankers in the U.S. and the EU as well as in China and many other countries will have to continue expanding the money supply anyway, otherwise liquidity-dependent markets and hence all asset prices would suffer severe withdrawal symptoms and would be taken down sharply, too. Yet, while technically nearly everything speaks for an ongoing breakout above the multi-year cup & handle pattern in the gold market, such a deflationary wave could hit gold as well. In fact, gold is a master of anticipating such upheavals. ### Another bounce is likely For now, we assume that gold should hold its support around US$1,880 and US$1,915 and start another bounce within the next few days. This bounce could take prices back towards the well-known resistance zone around US$1,960. We also see some chances for a larger bounce back towards and slightly above US$2,000. To summarize, gold should soon rally towards US$1,960 again. A weekly close below US$1,900, however, would cloud the picture significantly and the bears will likely shift up a gear. On the upside, the bulls need a convincing close above US$2,030 to come back into control of all important timeframes. _Feel free to join us in our free [Telegram channel](https://t.me/MidasTouchConsulting) for daily real time data and a great community._ _If you like to get regular updates on our gold model, precious metals and cryptocurrencies you can subscribe to our [free newsletter](http://bit.ly/1EUdt2K)._ _This article does not contain investment advice or recommendations. Every investment and trading move involves risk, and readers should conduct their own research when making a decision._ |
| json metadata | {"tags":["silvergoldstackers","steemsilvergold","silver","gold","preciousmetals","trading","investing","exploration"],"image":["https://cdn.steemitimages.com/DQmQjfxC9Hc5AxtEyCnNky8KUGoNePYKWTRruQLJWfufSdo/blog-header-gold-reynagold.jpeg","https://cdn.steemitimages.com/DQmbax9GR8h5X7RPKJKdYZMQKnTPsEo6MuzHvsQ5EWZVzu7/2022-01-15%20Why%20Invest%20in%20Reyna%20Gold.png","https://cdn.steemitimages.com/DQmRN3JJ14BbkcpR5AJ4NCVqSwRRKYRzfe9UjxAwQQgcQAB/Chart%201%20Gold%20in%20USD%20weekly%20300322.png","https://cdn.steemitimages.com/DQmaqJzzuujPKVtFoyEtSG3sh4ri8zRFyxrf5XRStTj4Hdk/Chart%202%20Gold%20in%20USD%20daily%20300322.png"],"links":["https://www.midastouch-consulting.com/gold-chartbook-20012022-rally-still-has-room","https://t.me/MidasTouchConsulting","http://bit.ly/1EUdt2K"],"app":"steemit/0.2","format":"markdown"} |
| parent author | |
| parent permlink | silvergoldstackers |
| permlink | march-30th-2022-gold-chartbook-the-big-boys-are-playing-yoyo |
| title | March 30th 2022, Gold Chartbook – The big boys are playing yoyo |
| Transaction Info | Block #62875135/Trx 9591836101c3ec489e0f2aac9e2c57989eb70c11 |
View Raw JSON Data
{
"block": 62875135,
"op": [
"comment",
{
"author": "midastouch",
"body": "\n\n# [March 30th 2022, Gold Chartbook – The big boys are playing yoyo](https://www.midastouch-consulting.com/gold-chartbook-20012022-rally-still-has-room) \n\nIn our last gold chartbook from March 19th, 2021, we assumed that gold had likely started its typical correction in spring. At the same time we figured, that the first leg down from US$2,070 to US$1,895 might have run its course and that a strong bounce back to US$1,960 and maybe even above US$2,000 should follow. So far, gold made it back to US$1,965 last Friday, but has since then sold off strongly once again. Gold – The big boys are playing Yoyo.\n\nWith a large trading range between US$1,930 and US$1,890 yesterday was another memorable trading day in the gold market. Already the start into this trading week had a stale flavor as gold dropped to US$1,917 on Monday.\n\n### First notice day of COMEX April futures on Thursday\n\nThe background story might once again be a toxic mix of institutional window-dressing towards the end of the quarter coupled with the expiry date of the COMEX April gold options as well as the expiration of the April future contracts. Next is the first notice day of COMEX April futures on Thursday, March 31st. Hence, whoever is long gold April contracts at the close of today has to have the account fully funded (full price of the contract) with the intention to take physical delivery.\n\nThe big boys and the bullion banks are playing this game pretty successful for decades already. Their goal is to discourage long gold contract holders from taking physical delivery and spook retail money from buying gold with these crazy, volatile moves. On top, the current macro setup warrants further attacks on gold, as the petrodollar system is under severe pressure due to the sanctions against Russia and the exclusion of Russia from the Swift system. Russia will only accept rubles, oil and bitcoin for its gas and oil. A move that shady dictators paid with their power and their lives in the past. However, Russia is a different caliber though, and we can only hope that the warmongers in the east and west will calm down quickly. Realistically, however, we must rather assume the worst!\n\nIn the very short-term, gold might remain under pressure, even though yesterday’s V-recovery is looking promising. On the first notice day and thereafter, gold might then be allowed to more or less freely trade again.\n\n\n\n\n### Gold in US-Dollar, weekly chart as of March 30th, 2022.\n\n\n*Gold in US-Dollar, weekly chart as of March 30th, 2022.*\n\nOn the weekly chart, the big reversal candle still dictates the picture. Due to that, we have to assume that at some point gold will need to test the triangle breakout zone around US$1,820 to US$1,850. However, this could take months.\n\nFor the last two weeks, gold has been trading sideways in a very volatile fashion between US$1,890 and US$1,965. The long wicks indicated that prices between US$1,890 and US$1,915 might encourage buyers to step in again. Obviously, this support has to hold. Otherwise, more downside will be activated.\n\nSince the stochastic oscillator is on a sell signal, gold remains vulnerable in the medium term. It will take much more time until the oscillator would reach its oversold zone for a contrarian buy signal.\n\nOverall, the weekly chart is bearish and continues to advise caution and patience.\n\n### Gold in US-Dollar, daily chart as of March 30th, 2022.\n\n*Gold in US-Dollar, daily chart as of March 30th, 2022.*\n\nThe rather good news is coming from the daily chart since the stochastic oscillator is kind of oversold and hence in a promising position for another recovery rally. A bounce back to last Friday’s high at US$1,965 seems possible. And even a further recovery towards US$2,000 still seems possible.\n\nOverall, the daily chart is once again slightly oversold and gold might start another bounce soon.\n\n### Conclusion: The big boys are playing yoyo\n\nWith inflation moving towards double digits, worldwide energy and food supply in danger and a war in Ukraine, whose end is unfortunately not in sight, everyone is well advised to park part of their assets in the safe haven of physical precious metals. While the fundamentals for gold are more bullish than ever, the price action has been a nerve-wracking roller coaster over the last few weeks. It seems that this is the only way to hold off a mainstream run into gold.\n\nHowever, with many central banks (especially in the Middle East) urgently needing to diversify out of their US-Dollar nominated assets and Russians now trading oil for gold, gold prices should remain well-supported for the time being. At the same time, a deflationary spiral is constantly lurking in the background. Just two days ago, the G7 countries rejected the Russian demand for gas and oil payment in rubles. However, the German industry desperately needs the Russian natural gas for its plants. An expert from BASF warned of the dramatic consequences of an immediate import stop for the chemical giant. A production stop due to energy shortages would be disastrous and very deflationary, of course.\n\nFurthermore, central bankers in the U.S. and the EU as well as in China and many other countries will have to continue expanding the money supply anyway, otherwise liquidity-dependent markets and hence all asset prices would suffer severe withdrawal symptoms and would be taken down sharply, too.\n\nYet, while technically nearly everything speaks for an ongoing breakout above the multi-year cup & handle pattern in the gold market, such a deflationary wave could hit gold as well. In fact, gold is a master of anticipating such upheavals.\n\n### Another bounce is likely\n\nFor now, we assume that gold should hold its support around US$1,880 and US$1,915 and start another bounce within the next few days. This bounce could take prices back towards the well-known resistance zone around US$1,960. We also see some chances for a larger bounce back towards and slightly above US$2,000.\n\nTo summarize, gold should soon rally towards US$1,960 again. A weekly close below US$1,900, however, would cloud the picture significantly and the bears will likely shift up a gear. On the upside, the bulls need a convincing close above US$2,030 to come back into control of all important timeframes.\n\n_Feel free to join us in our free [Telegram channel](https://t.me/MidasTouchConsulting) for daily real time data and a great community._ \n\n_If you like to get regular updates on our gold model, precious metals and cryptocurrencies you can subscribe to our [free newsletter](http://bit.ly/1EUdt2K)._ \n\n_This article does not contain investment advice or recommendations. Every investment and trading move involves risk, and readers should conduct their own research when making a decision._",
"json_metadata": "{\"tags\":[\"silvergoldstackers\",\"steemsilvergold\",\"silver\",\"gold\",\"preciousmetals\",\"trading\",\"investing\",\"exploration\"],\"image\":[\"https://cdn.steemitimages.com/DQmQjfxC9Hc5AxtEyCnNky8KUGoNePYKWTRruQLJWfufSdo/blog-header-gold-reynagold.jpeg\",\"https://cdn.steemitimages.com/DQmbax9GR8h5X7RPKJKdYZMQKnTPsEo6MuzHvsQ5EWZVzu7/2022-01-15%20Why%20Invest%20in%20Reyna%20Gold.png\",\"https://cdn.steemitimages.com/DQmRN3JJ14BbkcpR5AJ4NCVqSwRRKYRzfe9UjxAwQQgcQAB/Chart%201%20Gold%20in%20USD%20weekly%20300322.png\",\"https://cdn.steemitimages.com/DQmaqJzzuujPKVtFoyEtSG3sh4ri8zRFyxrf5XRStTj4Hdk/Chart%202%20Gold%20in%20USD%20daily%20300322.png\"],\"links\":[\"https://www.midastouch-consulting.com/gold-chartbook-20012022-rally-still-has-room\",\"https://t.me/MidasTouchConsulting\",\"http://bit.ly/1EUdt2K\"],\"app\":\"steemit/0.2\",\"format\":\"markdown\"}",
"parent_author": "",
"parent_permlink": "silvergoldstackers",
"permlink": "march-30th-2022-gold-chartbook-the-big-boys-are-playing-yoyo",
"title": "March 30th 2022, Gold Chartbook – The big boys are playing yoyo"
}
],
"op_in_trx": 0,
"timestamp": "2022-03-30T14:52:21",
"trx_id": "9591836101c3ec489e0f2aac9e2c57989eb70c11",
"trx_in_block": 1,
"virtual_op": 0
}midastouchupvoted (100.00%) @midastouch / march-29th-2022-crypto-chartbook-bitcoin-wins-the-race2022/03/29 08:00:42
midastouchupvoted (100.00%) @midastouch / march-29th-2022-crypto-chartbook-bitcoin-wins-the-race
2022/03/29 08:00:42
| author | midastouch |
| permlink | march-29th-2022-crypto-chartbook-bitcoin-wins-the-race |
| voter | midastouch |
| weight | 10000 (100.00%) |
| Transaction Info | Block #62838281/Trx 2e533b06ac7b83437545294b60eb4610728f384d |
View Raw JSON Data
{
  "block": 62838281,
  "op": [
    "vote",
    {
      "author": "midastouch",
      "permlink": "march-29th-2022-crypto-chartbook-bitcoin-wins-the-race",
      "voter": "midastouch",
      "weight": 10000
    }
  ],
  "op_in_trx": 0,
  "timestamp": "2022-03-29T08:00:42",
  "trx_id": "2e533b06ac7b83437545294b60eb4610728f384d",
  "trx_in_block": 1,
  "virtual_op": 0
}midastouchpublished a new post: march-29th-2022-crypto-chartbook-bitcoin-wins-the-race2022/03/29 07:59:57
midastouchpublished a new post: march-29th-2022-crypto-chartbook-bitcoin-wins-the-race
2022/03/29 07:59:57
| author | midastouch |
| body |  # [March 29th, 2022, Crypto Chartbook – Bitcoin wins the race](https://www.midastouch-consulting.com/crypto-chartbook-29032022-bitcoin-wins-the-race) Globalization, a cultural and trade exchange process in an interconnected world, is endangered by recent political events. Interrupted business through sanctions affects the value of fiat currencies as well as alliances between nations. With a race between various possible electronic payment systems but a need for instant payments for oil and energy supplies, bitcoin has recently come to the forefront. Pavel Zavalny, a top Russian government official, announced that Russia would take Bitcoin as payment for oil, a response to being blocked out of the swift system, which has made it impossible for other nations to pay for oil in the US Dollar. Bitcoin wins the race.  While Russia accepts hard currencies like gold, a move like this shows that the efficient attributes of bitcoin come to the forefront in times of crisis and are accepted for large business transactions between nations. ### Bitcoin, daily chart, price breakout: 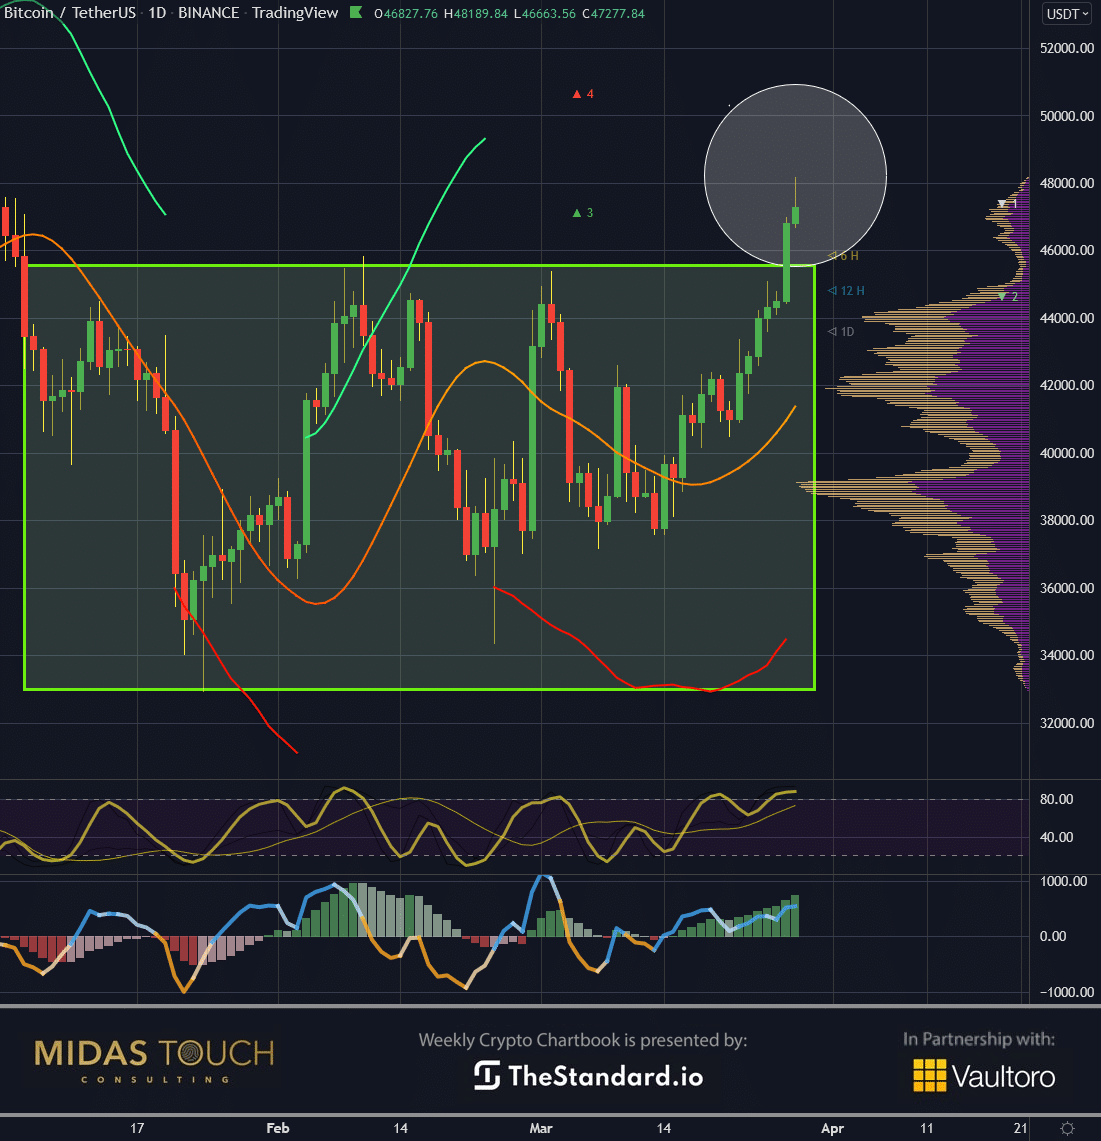 *Bitcoin in USD, daily chart as of March 29th, 2022.* Shortly after, president Putin confirmed this new way of doing business. In addition, China and Russia agreed to a thirty-year contract in the gas sector, transacted in Euros. We can see that we find ourselves in times of currency warfare and that it is essential to pay close attention to where and in what form we store our values. The daily chart above reflects this recent news in a price advance of bitcoin from US$37,567 to US$47,701. A 28% advance in just two weeks. Bitcoin broke through the sideways range, and this week shall show whether this breakout will be a successful one or not. In this case, the bulls have their odds much in favor over the bears. ### Bitcoin, weekly chart, price left the station: 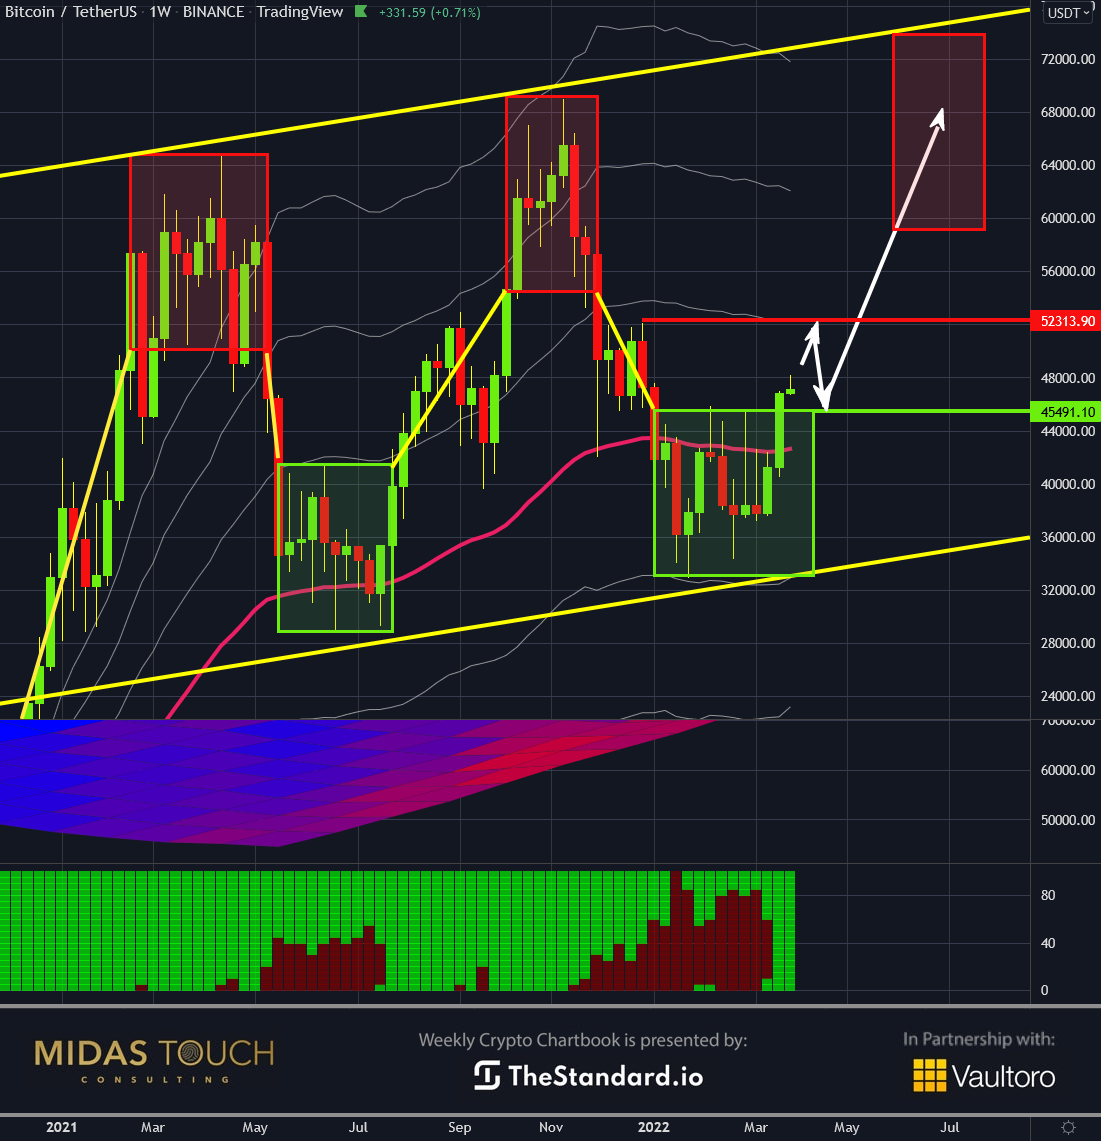 *Bitcoin in USD, weekly chart as of March 29th, 2022.* We have now left the entry zone (green box) compared to last week’s chart book and the published weekly chart. While the crowd now chases a trade, struggling with the typical inefficiencies of volatility breakouts (bad fills, slippage, being late), we are established in our positioning with the sum of 9 accumulated runners. The runners being the last 25% of each initial position. A fully de-risked or more precisely no-risk venture (see quad exit)! Looking at the weekly chart, we find the resistance distribution zones at a round US$49,650 and US$52,430. We place additional entries if the price returns to the entry box top.  ### Bitcoin, monthly chart, if March closes strong: 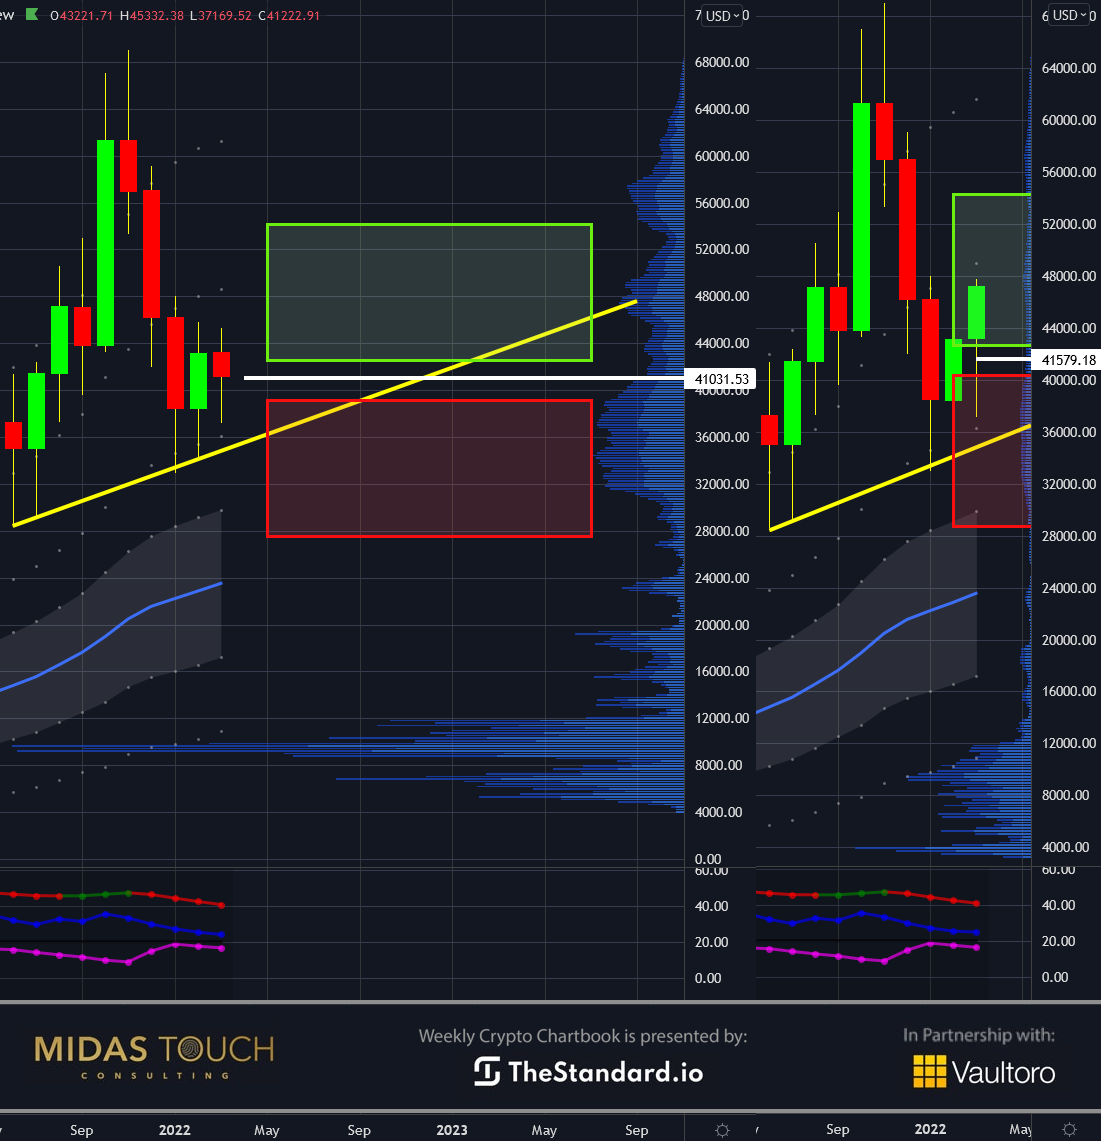 *Bitcoin in USD, monthly chart as of March 28th, 2022.* The price has entered the confirmed buy zone from a monthly perspective. The dual chart shows the progression from last week’s anticipation to this week’s chart book release. Should prices within this week stay within the green box, all-time frames are in alignment. A picture of a confirmed bullish bitcoin trend. It is a rare occurrence and confirmation for larger time frame traders and a call to look for low-risk entries, if no sufficient exposure is at play yet. ### Bitcoin/Gold-Ratio, daily chart, Bitcoin wins the race: 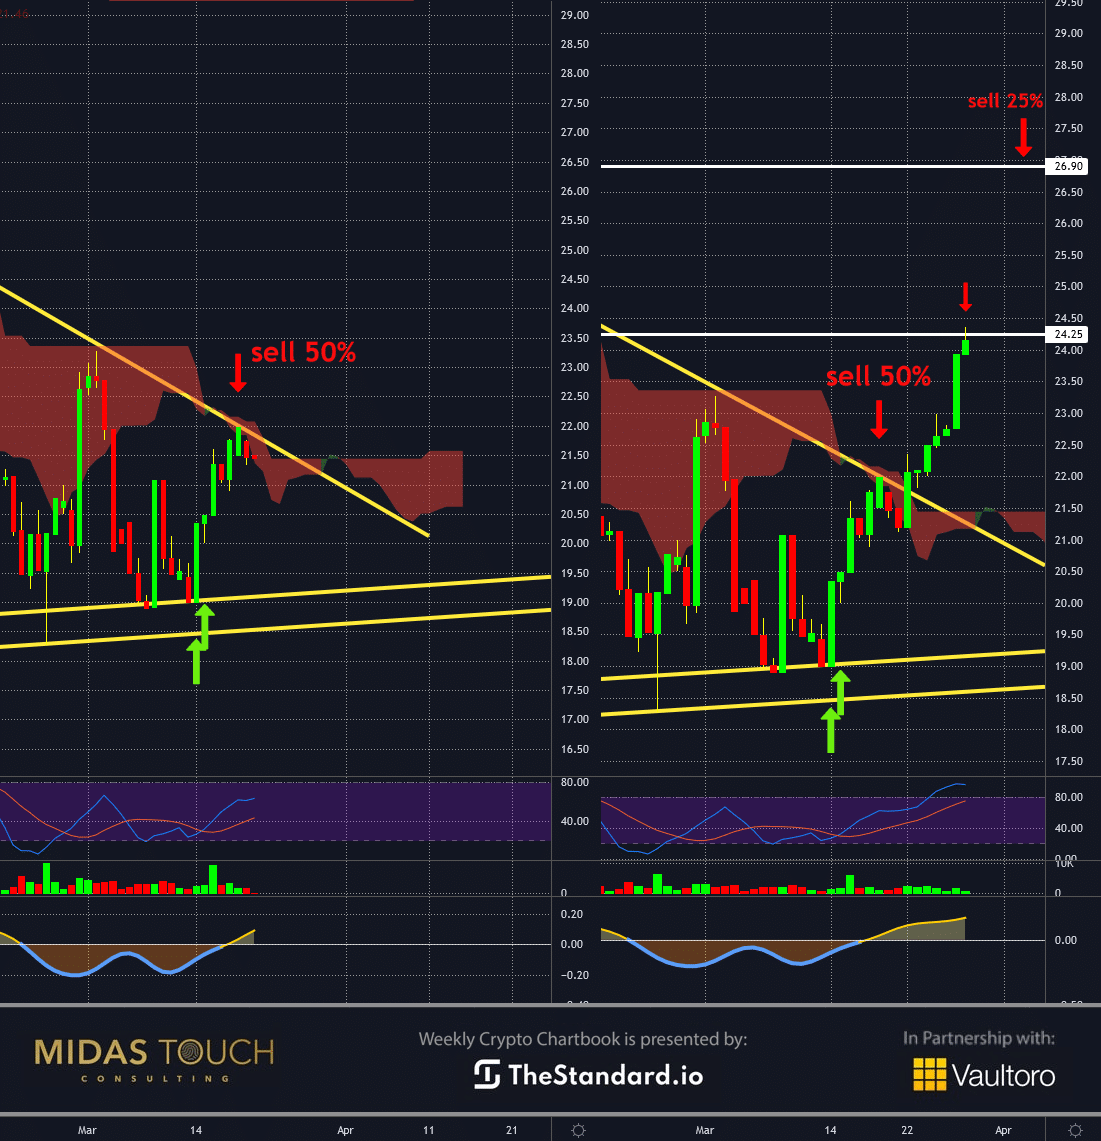 *Bitcoin/Gold-Ratio, daily chart as of March 28th, 2022.* Another split-screen view of a chart (a daily chart of the bitcoin/gold ratio) shows the progression of last week’s chart book publication and the situation right now. We had a triangle breakout last week and a substantial advance since then. The suggested rotation out of gold and into bitcoin was/is a successful one. The overall move was 30% in just two weeks. One can use this relationship as well to indicate bitcoins’ recent gain in strength and direction. ### Bitcoin wins the race: Change is never accepted lightly. We typically resist change and prefer an existing state of affairs as human beings. Nevertheless, we find ourselves in less than average circumstances with a worldwide pandemic, a never-ending war, and a general divide in opinions. Russia’s recent move towards approval of bitcoin shows that when the rubber meets the road, what works and is practical in times of crisis and need, wins the race. While governments around the globe feverishly try to get their electronic payment systems developed, bitcoin already finds its use spreading, and successfully so.  _Feel free to join us in our free [Telegram channel](https://t.me/MidasTouchConsulting) for daily real time data and a great community._ _If you like to get regular updates on our gold model, precious metals and cryptocurrencies you can subscribe to our [free newsletter](http://bit.ly/1EUdt2K)._ _This article does not contain investment advice or recommendations. Every investment and trading move involves risk, and readers should conduct their own research when making a decision._ |
| json metadata | {"tags":["bitcoin","leofinance","ethereum","crypto","trading","investing","stablecoin","btc"],"image":["https://images.hive.blog/DQmY9Dvrcx9dFZXTMGYhaevkyNxJhKu3UiNLuPfHX5hf1Vj/blog-header-crypto-thestandard.jpeg","https://images.hive.blog/DQmcmjvFNZVDGdqFxmUAoddh9GkYDJ4vdqDUdteXzkcWm7g/blog-banner-crypto-thestandard%201.png","https://images.hive.blog/DQmQiWRuVAQ3yAo85QdsFx9xzfLXMtNyCubxUTQqk5cpgDp/Chart-1-Bitcoin-in-USD-daily-chart-as-of-March-29th-2022..png","https://images.hive.blog/DQmZGm2FX7pkv7sP6CPU1Dxd1noVBL5g7vTnfh8iyzvC42A/Chart-2-Bitcoin-in-USD-weekly-chart-as-of-March-29th-2022..png","https://images.hive.blog/DQmS7gQmEaeq6rFyX2NA4KfvXqwHrdPQE7agFfjtQbJnUeG/blog-banner-crypto-thestandard%202.png","https://images.hive.blog/DQma9kY5B3Ca1yMxA57HW38zPzkUuAXCdCSiNgdFYKxVtEz/Chart-3-Bitcoin-in-USD-monthly-chart-as-of-March-28th-2022..png","https://images.hive.blog/DQmee27dkMhegqBgLugzztYECV7HPfTUqsp6b1TF3VASx2w/Chart-4-Bitcoin-Gold-Ratio-daily-chart-as-of-March-28th-2022..png","https://images.hive.blog/DQmZpVHfzSSLvtmfqDNpjdPCg8HcjEkLvBSRvuvb3ok75fH/blog-banner-crypto-thestandard%203.jpeg"],"links":["https://www.midastouch-consulting.com/crypto-chartbook-29032022-bitcoin-wins-the-race","https://t.me/MidasTouchConsulting","http://bit.ly/1EUdt2K"],"app":"steemit/0.2","format":"markdown"} |
| parent author | |
| parent permlink | bitcoin |
| permlink | march-29th-2022-crypto-chartbook-bitcoin-wins-the-race |
| title | March 29th, 2022, Crypto Chartbook – Bitcoin wins the race |
| Transaction Info | Block #62838266/Trx 6b4ffecb394384aa1c7c69a85cde3629084700a3 |
View Raw JSON Data
{
"block": 62838266,
"op": [
"comment",
{
"author": "midastouch",
"body": "\n\n# [March 29th, 2022, Crypto Chartbook – Bitcoin wins the race](https://www.midastouch-consulting.com/crypto-chartbook-29032022-bitcoin-wins-the-race) \n\nGlobalization, a cultural and trade exchange process in an interconnected world, is endangered by recent political events. Interrupted business through sanctions affects the value of fiat currencies as well as alliances between nations. With a race between various possible electronic payment systems but a need for instant payments for oil and energy supplies, bitcoin has recently come to the forefront. Pavel Zavalny, a top Russian government official, announced that Russia would take Bitcoin as payment for oil, a response to being blocked out of the swift system, which has made it impossible for other nations to pay for oil in the US Dollar. Bitcoin wins the race.\n\n\n\nWhile Russia accepts hard currencies like gold, a move like this shows that the efficient attributes of bitcoin come to the forefront in times of crisis and are accepted for large business transactions between nations.\n\n### Bitcoin, daily chart, price breakout:\n\n*Bitcoin in USD, daily chart as of March 29th, 2022.*\n\nShortly after, president Putin confirmed this new way of doing business. In addition, China and Russia agreed to a thirty-year contract in the gas sector, transacted in Euros. We can see that we find ourselves in times of currency warfare and that it is essential to pay close attention to where and in what form we store our values.\n\nThe daily chart above reflects this recent news in a price advance of bitcoin from US$37,567 to US$47,701. A 28% advance in just two weeks. Bitcoin broke through the sideways range, and this week shall show whether this breakout will be a successful one or not. In this case, the bulls have their odds much in favor over the bears.\n\n### Bitcoin, weekly chart, price left the station:\n\n*Bitcoin in USD, weekly chart as of March 29th, 2022.*\n\nWe have now left the entry zone (green box) compared to last week’s chart book and the published weekly chart. While the crowd now chases a trade, struggling with the typical inefficiencies of volatility breakouts (bad fills, slippage, being late), we are established in our positioning with the sum of 9 accumulated runners. The runners being the last 25% of each initial position. A fully de-risked or more precisely no-risk venture (see quad exit)! Looking at the weekly chart, we find the resistance distribution zones at a round US$49,650 and US$52,430.\n\nWe place additional entries if the price returns to the entry box top.\n\n\n\n### Bitcoin, monthly chart, if March closes strong:\n\n*Bitcoin in USD, monthly chart as of March 28th, 2022.*\n\nThe price has entered the confirmed buy zone from a monthly perspective. The dual chart shows the progression from last week’s anticipation to this week’s chart book release. Should prices within this week stay within the green box, all-time frames are in alignment. A picture of a confirmed bullish bitcoin trend. It is a rare occurrence and confirmation for larger time frame traders and a call to look for low-risk entries, if no sufficient exposure is at play yet.\n\n### Bitcoin/Gold-Ratio, daily chart, Bitcoin wins the race:\n\n*Bitcoin/Gold-Ratio, daily chart as of March 28th, 2022.*\n\nAnother split-screen view of a chart (a daily chart of the bitcoin/gold ratio) shows the progression of last week’s chart book publication and the situation right now. We had a triangle breakout last week and a substantial advance since then. The suggested rotation out of gold and into bitcoin was/is a successful one. The overall move was 30% in just two weeks. One can use this relationship as well to indicate bitcoins’ recent gain in strength and direction.\n\n### Bitcoin wins the race:\n\nChange is never accepted lightly. We typically resist change and prefer an existing state of affairs as human beings. Nevertheless, we find ourselves in less than average circumstances with a worldwide pandemic, a never-ending war, and a general divide in opinions. Russia’s recent move towards approval of bitcoin shows that when the rubber meets the road, what works and is practical in times of crisis and need, wins the race. While governments around the globe feverishly try to get their electronic payment systems developed, bitcoin already finds its use spreading, and successfully so.\n\n\n\n_Feel free to join us in our free [Telegram channel](https://t.me/MidasTouchConsulting) for daily real time data and a great community._ \n\n_If you like to get regular updates on our gold model, precious metals and cryptocurrencies you can subscribe to our [free newsletter](http://bit.ly/1EUdt2K)._ \n\n_This article does not contain investment advice or recommendations. Every investment and trading move involves risk, and readers should conduct their own research when making a decision._",
"json_metadata": "{\"tags\":[\"bitcoin\",\"leofinance\",\"ethereum\",\"crypto\",\"trading\",\"investing\",\"stablecoin\",\"btc\"],\"image\":[\"https://images.hive.blog/DQmY9Dvrcx9dFZXTMGYhaevkyNxJhKu3UiNLuPfHX5hf1Vj/blog-header-crypto-thestandard.jpeg\",\"https://images.hive.blog/DQmcmjvFNZVDGdqFxmUAoddh9GkYDJ4vdqDUdteXzkcWm7g/blog-banner-crypto-thestandard%201.png\",\"https://images.hive.blog/DQmQiWRuVAQ3yAo85QdsFx9xzfLXMtNyCubxUTQqk5cpgDp/Chart-1-Bitcoin-in-USD-daily-chart-as-of-March-29th-2022..png\",\"https://images.hive.blog/DQmZGm2FX7pkv7sP6CPU1Dxd1noVBL5g7vTnfh8iyzvC42A/Chart-2-Bitcoin-in-USD-weekly-chart-as-of-March-29th-2022..png\",\"https://images.hive.blog/DQmS7gQmEaeq6rFyX2NA4KfvXqwHrdPQE7agFfjtQbJnUeG/blog-banner-crypto-thestandard%202.png\",\"https://images.hive.blog/DQma9kY5B3Ca1yMxA57HW38zPzkUuAXCdCSiNgdFYKxVtEz/Chart-3-Bitcoin-in-USD-monthly-chart-as-of-March-28th-2022..png\",\"https://images.hive.blog/DQmee27dkMhegqBgLugzztYECV7HPfTUqsp6b1TF3VASx2w/Chart-4-Bitcoin-Gold-Ratio-daily-chart-as-of-March-28th-2022..png\",\"https://images.hive.blog/DQmZpVHfzSSLvtmfqDNpjdPCg8HcjEkLvBSRvuvb3ok75fH/blog-banner-crypto-thestandard%203.jpeg\"],\"links\":[\"https://www.midastouch-consulting.com/crypto-chartbook-29032022-bitcoin-wins-the-race\",\"https://t.me/MidasTouchConsulting\",\"http://bit.ly/1EUdt2K\"],\"app\":\"steemit/0.2\",\"format\":\"markdown\"}",
"parent_author": "",
"parent_permlink": "bitcoin",
"permlink": "march-29th-2022-crypto-chartbook-bitcoin-wins-the-race",
"title": "March 29th, 2022, Crypto Chartbook – Bitcoin wins the race"
}
],
"op_in_trx": 0,
"timestamp": "2022-03-29T07:59:57",
"trx_id": "6b4ffecb394384aa1c7c69a85cde3629084700a3",
"trx_in_block": 3,
"virtual_op": 0
}midastouchupvoted (100.00%) @midastouch / march-22nd-2022-crypto-chartbook-bitcoin-s-time-to-go2022/03/22 18:06:30
midastouchupvoted (100.00%) @midastouch / march-22nd-2022-crypto-chartbook-bitcoin-s-time-to-go
2022/03/22 18:06:30
| author | midastouch |
| permlink | march-22nd-2022-crypto-chartbook-bitcoin-s-time-to-go |
| voter | midastouch |
| weight | 10000 (100.00%) |
| Transaction Info | Block #62649742/Trx 8d79a3db5f0cf8a878eed3a70708a79109e175b7 |
View Raw JSON Data
{
  "block": 62649742,
  "op": [
    "vote",
    {
      "author": "midastouch",
      "permlink": "march-22nd-2022-crypto-chartbook-bitcoin-s-time-to-go",
      "voter": "midastouch",
      "weight": 10000
    }
  ],
  "op_in_trx": 0,
  "timestamp": "2022-03-22T18:06:30",
  "trx_id": "8d79a3db5f0cf8a878eed3a70708a79109e175b7",
  "trx_in_block": 6,
  "virtual_op": 0
}midastouchpublished a new post: march-22nd-2022-crypto-chartbook-bitcoin-s-time-to-go2022/03/22 18:06:24
midastouchpublished a new post: march-22nd-2022-crypto-chartbook-bitcoin-s-time-to-go
2022/03/22 18:06:24
| author | midastouch |
| body |  # [March 22nd, 2022, Crypto Chartbook – Bitcoin´s time to go](https://www.midastouch-consulting.com/crypto-chartbook-22032022-bitcoins-time-to-go) The more we are uncertain, maximized when looking at the future and trying to predict, the more we ache for precision. Precision, in this case, isn’t the way to be a consistent winner. It is about zones, not specific prices. It is about a general building process rather than identifying a particular go time spot and then hoping for the relief to have set it and forget it. One needs to readjust and refocus and never run out of discipline. Bitcoin´s time to go.  Trying to pick tops and bottoms is honorable and a desirable goal. Nevertheless, there needs to be other insurances and principles in place. If an ideal spot passes or the market doesn’t provide for a low-risk entry or enough liquidity for an exit, one still needs alternate tools to participate in the market. Our quad exit strategy allows for position building and market participation that consistently extracts monies from the markets. ### Bitcoin, daily chart, keep calm and keep trading: 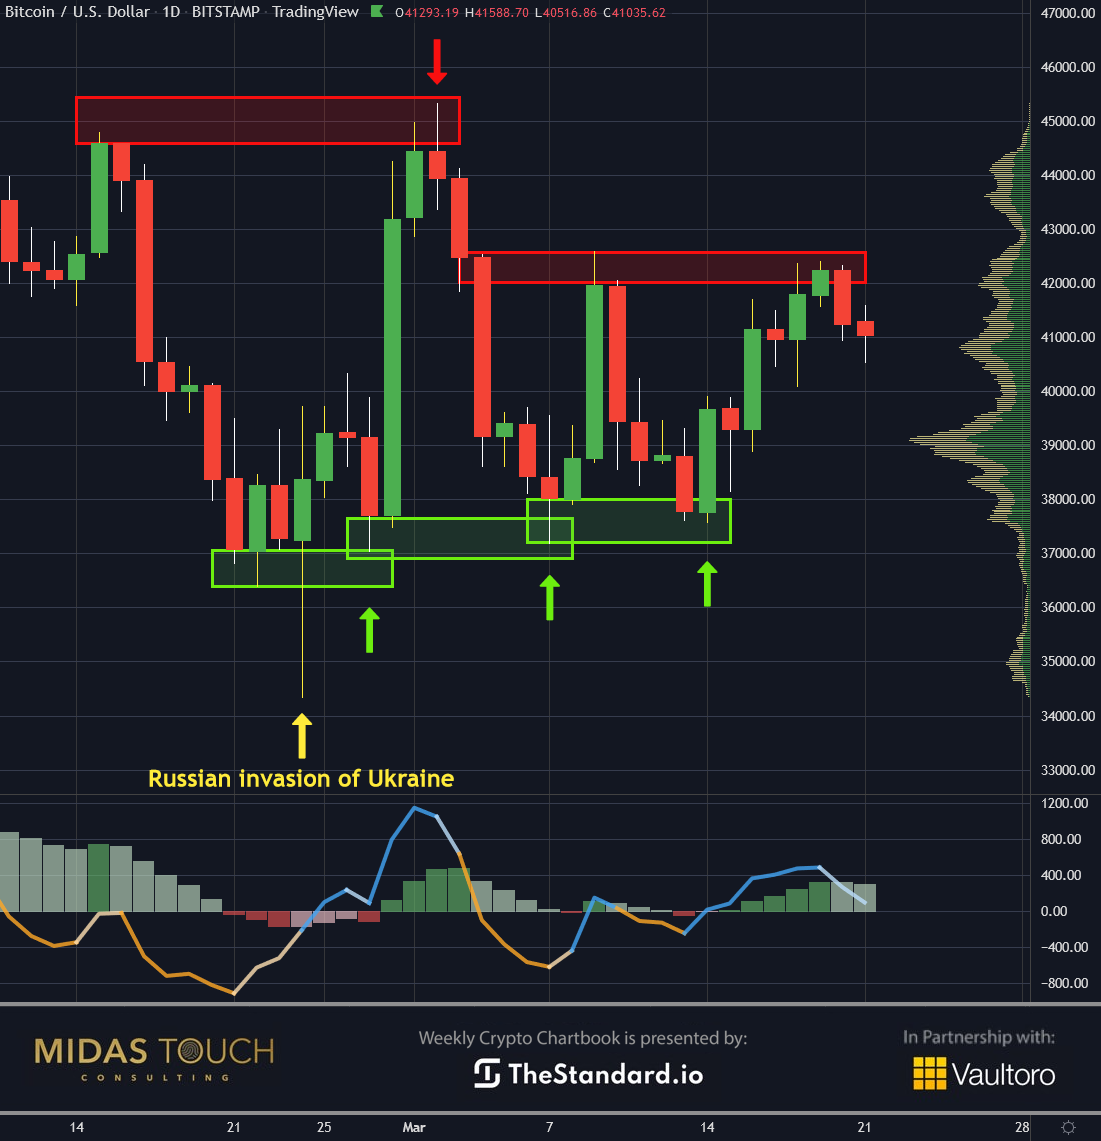 *Bitcoin in USD, daily chart as of March 22nd, 2022.* Precision trading gets even more difficult in wartimes, when frequent and conflicting news events jolt prices alternating up and down. The daily chart above shows these jolts over the last three weeks of wartime. We can identify three low-risk long trade entry opportunities (green up arrows on double bottom price scenarios) and one short trading one (red downward arrow at a double top price formation). Our quad exit strategy takes on each of these trades a partial initial profit to mitigate risk, which allows the remainder position size to be the market’s money at risk only.  ### Bitcoin, weekly chart, pushing up: 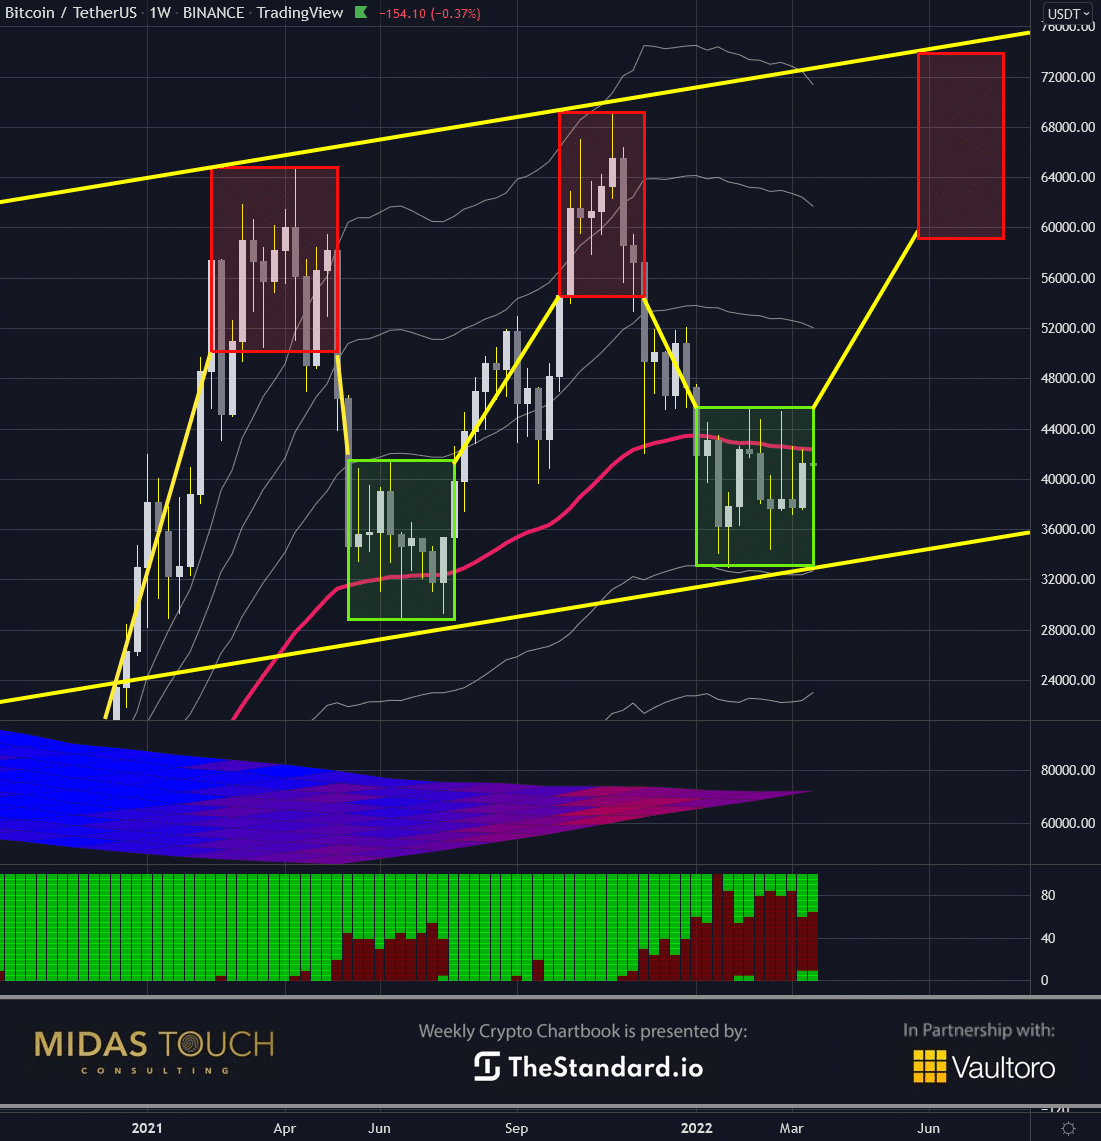 *Bitcoin in USD, weekly chart as of March 22nd, 2022.* Zooming out to larger time frames is another way to avoid noise and see a trading scenario more clearly, and, as such, find “go times” with more accuracy. This weekly chart illustrates that entries and exits are rather entry zones (red and green boxes) versus a precise price level. The trader’s goal is to exploit within such a zone a low-risk entry spot on a lower time frame to get positioned. Regarding bitcoin, we find overall price behavior to be up sloping over the last twelve months, a bullish notion. And we find a high likelihood for the momentary entry zone (green box to the right of the chart). In other words, we are right now in a price zone where its Bitcoin´s time to go. ### Bitcoin, monthly chart, March closing price: 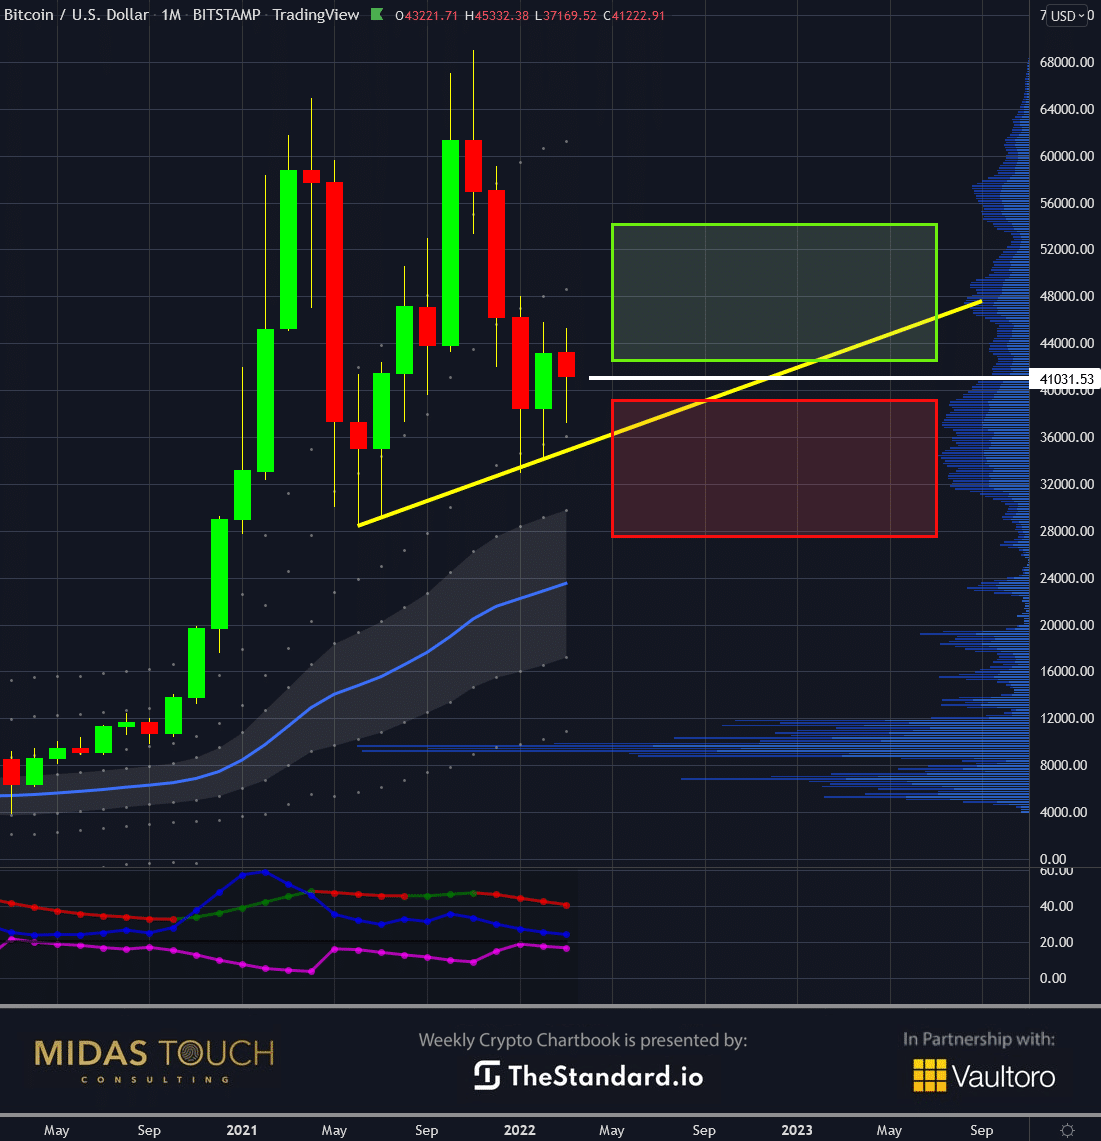 *Bitcoin in USD, monthly chart as of March 22nd, 2022.* Suppose we further remove ourselves from the noise by electing a higher timeframe. In that case, we find a pat situation on the monthly chart, pat not for a more significant edge for prices to go higher up but for timing on when to enter the markets. Our statistics show that it will be essential on what price level the month of March will be closing. With a close above current levels (white line), we will enter a bullish buy zone. Yet, if prices decline from here in the last nine days of this month, the probabilities of an immediate price advance rapidly decline. ### Bitcoin/Gold-Ratio, daily chart, Bitcoin´s time to go: 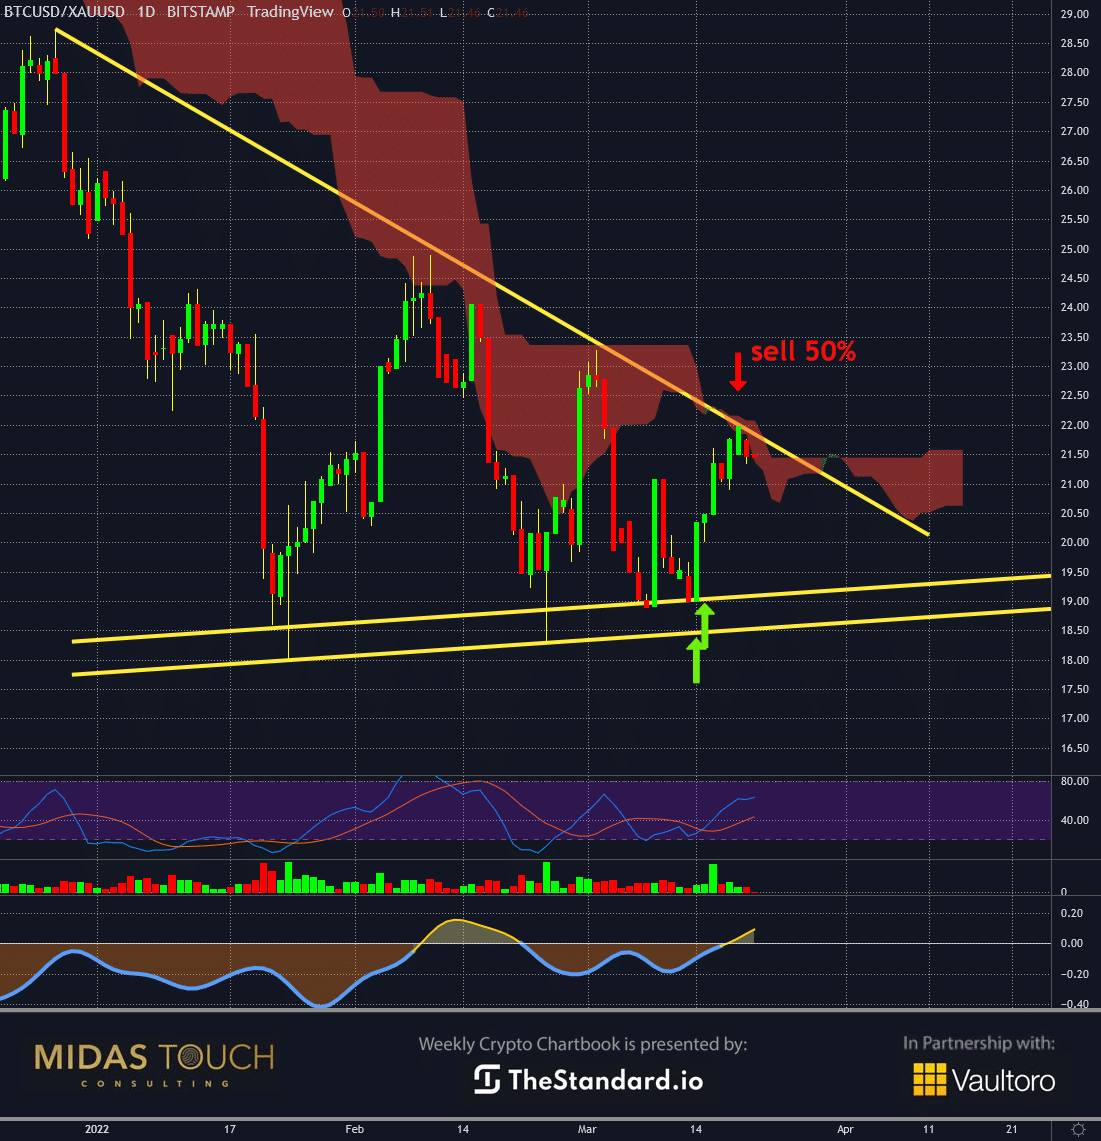 *Bitcoin/Gold-Ratio, daily chart as of March 22nd, 2022.* An additional benefit quiet charting provides in turbulent times is to think outside the box. While all noise points toward the most heated issues, finding a trading opportunity elsewhere might be best. In our previous chart book release, we exploited a great go time for bitcoin. Last week, we provided entry points (green up arrows) for rotating one’s gold into bitcoin. Using our quad exit strategy, the trader who wanted to not expose his money to a volatile fiat currency trading world could profit near ten percent on his first fifty percent of position size. We are now placing the stop for the remainder position size to breakeven entry levels. ### Bitcoin´s time to go: In war, the first casualty is the truth. Under stress, our minds insist on reason, clarity, precise calls for action. Unfortunately, even the best informed brightest minds can’t find reliable data in times of war since the distortion field of media around the world is at a level where lies and propaganda outweigh facts and truth. Luckily, a trader can, in these times, rely more heavily on charts. Charts always encompass the sum of opinion. Charts are consistently working as a reliable source to trade from. The psychological aspect is hugely beneficial, since a consistent bombardment of news and everybody’s opinion can get quickly exhausting. Reduce news data consumption at a time when calm and levelheadedness is the most powerful tool for wealth creation and preservation, and the “go time” will reveal itself nearly effortlessly.  _Feel free to join us in our free [Telegram channel](https://t.me/MidasTouchConsulting) for daily real time data and a great community._ _If you like to get regular updates on our gold model, precious metals and cryptocurrencies you can subscribe to our [free newsletter](http://bit.ly/1EUdt2K)._ _This article does not contain investment advice or recommendations. Every investment and trading move involves risk, and readers should conduct their own research when making a decision._ |
| json metadata | {"tags":["bitcoin","leofinance","ethereum","crypto","trading","investing","stablecoin","btc"],"image":["https://images.hive.blog/DQmY9Dvrcx9dFZXTMGYhaevkyNxJhKu3UiNLuPfHX5hf1Vj/blog-header-crypto-thestandard.jpeg","https://images.hive.blog/DQmcmjvFNZVDGdqFxmUAoddh9GkYDJ4vdqDUdteXzkcWm7g/blog-banner-crypto-thestandard%201.png","https://images.hive.blog/DQmWnk83wxVFiGFe3B81rbfyndnd1VzVtmvuwM6or9yuvEu/Chart-1-Bitcoin-in-USD-daily-chart-as-of-March-22nd-2022.png","https://images.hive.blog/DQmS7gQmEaeq6rFyX2NA4KfvXqwHrdPQE7agFfjtQbJnUeG/blog-banner-crypto-thestandard%202.png","https://images.hive.blog/DQmRLbLmhXcZzWYWbVJ8yF3k5VnfGeTmWpey6ELuGsG6uG8/Chart-2-Bitcoin-in-USD-weekly-chart-as-of-March-22nd-2022.png","https://images.hive.blog/DQmbk4TZhMuW6iEwncyGqntEQ6oV2JUwZyAy9WuBN32CRZm/Chart-3-Bitcoin-in-USD-monthly-chart-as-of-March-22nd-2022.png","https://images.hive.blog/DQmaTjS961eYwneVQu1CQ2fpujBQAye87D94kE7htpPWqor/Chart-4-Bitcoin-to-Gold-Ratio-daily-chart-as-of-March-22nd-2022.png","https://images.hive.blog/DQmZpVHfzSSLvtmfqDNpjdPCg8HcjEkLvBSRvuvb3ok75fH/blog-banner-crypto-thestandard%203.jpeg"],"links":["https://www.midastouch-consulting.com/crypto-chartbook-22032022-bitcoins-time-to-go","https://t.me/MidasTouchConsulting","http://bit.ly/1EUdt2K"],"app":"steemit/0.2","format":"markdown"} |
| parent author | |
| parent permlink | bitcoin |
| permlink | march-22nd-2022-crypto-chartbook-bitcoin-s-time-to-go |
| title | March 22nd, 2022, Crypto Chartbook – Bitcoin´s time to go |
| Transaction Info | Block #62649740/Trx f825f8f23bef217129f8779d8efa000e9f809c0d |
View Raw JSON Data
{
"block": 62649740,
"op": [
"comment",
{
"author": "midastouch",
"body": "\n\n# [March 22nd, 2022, Crypto Chartbook – Bitcoin´s time to go](https://www.midastouch-consulting.com/crypto-chartbook-22032022-bitcoins-time-to-go) \n\nThe more we are uncertain, maximized when looking at the future and trying to predict, the more we ache for precision. Precision, in this case, isn’t the way to be a consistent winner. It is about zones, not specific prices. It is about a general building process rather than identifying a particular go time spot and then hoping for the relief to have set it and forget it. One needs to readjust and refocus and never run out of discipline. Bitcoin´s time to go.\n\n\n\nTrying to pick tops and bottoms is honorable and a desirable goal. Nevertheless, there needs to be other insurances and principles in place. If an ideal spot passes or the market doesn’t provide for a low-risk entry or enough liquidity for an exit, one still needs alternate tools to participate in the market. Our quad exit strategy allows for position building and market participation that consistently extracts monies from the markets.\n\n### Bitcoin, daily chart, keep calm and keep trading:\n\n*Bitcoin in USD, daily chart as of March 22nd, 2022.*\n\nPrecision trading gets even more difficult in wartimes, when frequent and conflicting news events jolt prices alternating up and down.\n\nThe daily chart above shows these jolts over the last three weeks of wartime. We can identify three low-risk long trade entry opportunities (green up arrows on double bottom price scenarios) and one short trading one (red downward arrow at a double top price formation).\n\nOur quad exit strategy takes on each of these trades a partial initial profit to mitigate risk, which allows the remainder position size to be the market’s money at risk only.\n\n\n\n### Bitcoin, weekly chart, pushing up:\n\n*Bitcoin in USD, weekly chart as of March 22nd, 2022.*\n\nZooming out to larger time frames is another way to avoid noise and see a trading scenario more clearly, and, as such, find “go times” with more accuracy.\n\nThis weekly chart illustrates that entries and exits are rather entry zones (red and green boxes) versus a precise price level. The trader’s goal is to exploit within such a zone a low-risk entry spot on a lower time frame to get positioned.\n\nRegarding bitcoin, we find overall price behavior to be up sloping over the last twelve months, a bullish notion. And we find a high likelihood for the momentary entry zone (green box to the right of the chart). In other words, we are right now in a price zone where its Bitcoin´s time to go.\n\n### Bitcoin, monthly chart, March closing price:\n\n*Bitcoin in USD, monthly chart as of March 22nd, 2022.*\n\nSuppose we further remove ourselves from the noise by electing a higher timeframe. In that case, we find a pat situation on the monthly chart, pat not for a more significant edge for prices to go higher up but for timing on when to enter the markets.\n\nOur statistics show that it will be essential on what price level the month of March will be closing. With a close above current levels (white line), we will enter a bullish buy zone. Yet, if prices decline from here in the last nine days of this month, the probabilities of an immediate price advance rapidly decline.\n\n### Bitcoin/Gold-Ratio, daily chart, Bitcoin´s time to go:\n\n*Bitcoin/Gold-Ratio, daily chart as of March 22nd, 2022.*\n\nAn additional benefit quiet charting provides in turbulent times is to think outside the box. While all noise points toward the most heated issues, finding a trading opportunity elsewhere might be best.\n\nIn our previous chart book release, we exploited a great go time for bitcoin.\n\nLast week, we provided entry points (green up arrows) for rotating one’s gold into bitcoin. Using our quad exit strategy, the trader who wanted to not expose his money to a volatile fiat currency trading world could profit near ten percent on his first fifty percent of position size. We are now placing the stop for the remainder position size to breakeven entry levels.\n\n### Bitcoin´s time to go:\n\nIn war, the first casualty is the truth. Under stress, our minds insist on reason, clarity, precise calls for action. Unfortunately, even the best informed brightest minds can’t find reliable data in times of war since the distortion field of media around the world is at a level where lies and propaganda outweigh facts and truth.\n\nLuckily, a trader can, in these times, rely more heavily on charts. Charts always encompass the sum of opinion. Charts are consistently working as a reliable source to trade from.\n\nThe psychological aspect is hugely beneficial, since a consistent bombardment of news and everybody’s opinion can get quickly exhausting.\n\nReduce news data consumption at a time when calm and levelheadedness is the most powerful tool for wealth creation and preservation, and the “go time” will reveal itself nearly effortlessly.\n\n\n\n_Feel free to join us in our free [Telegram channel](https://t.me/MidasTouchConsulting) for daily real time data and a great community._ \n\n_If you like to get regular updates on our gold model, precious metals and cryptocurrencies you can subscribe to our [free newsletter](http://bit.ly/1EUdt2K)._ \n\n_This article does not contain investment advice or recommendations. Every investment and trading move involves risk, and readers should conduct their own research when making a decision._",
"json_metadata": "{\"tags\":[\"bitcoin\",\"leofinance\",\"ethereum\",\"crypto\",\"trading\",\"investing\",\"stablecoin\",\"btc\"],\"image\":[\"https://images.hive.blog/DQmY9Dvrcx9dFZXTMGYhaevkyNxJhKu3UiNLuPfHX5hf1Vj/blog-header-crypto-thestandard.jpeg\",\"https://images.hive.blog/DQmcmjvFNZVDGdqFxmUAoddh9GkYDJ4vdqDUdteXzkcWm7g/blog-banner-crypto-thestandard%201.png\",\"https://images.hive.blog/DQmWnk83wxVFiGFe3B81rbfyndnd1VzVtmvuwM6or9yuvEu/Chart-1-Bitcoin-in-USD-daily-chart-as-of-March-22nd-2022.png\",\"https://images.hive.blog/DQmS7gQmEaeq6rFyX2NA4KfvXqwHrdPQE7agFfjtQbJnUeG/blog-banner-crypto-thestandard%202.png\",\"https://images.hive.blog/DQmRLbLmhXcZzWYWbVJ8yF3k5VnfGeTmWpey6ELuGsG6uG8/Chart-2-Bitcoin-in-USD-weekly-chart-as-of-March-22nd-2022.png\",\"https://images.hive.blog/DQmbk4TZhMuW6iEwncyGqntEQ6oV2JUwZyAy9WuBN32CRZm/Chart-3-Bitcoin-in-USD-monthly-chart-as-of-March-22nd-2022.png\",\"https://images.hive.blog/DQmaTjS961eYwneVQu1CQ2fpujBQAye87D94kE7htpPWqor/Chart-4-Bitcoin-to-Gold-Ratio-daily-chart-as-of-March-22nd-2022.png\",\"https://images.hive.blog/DQmZpVHfzSSLvtmfqDNpjdPCg8HcjEkLvBSRvuvb3ok75fH/blog-banner-crypto-thestandard%203.jpeg\"],\"links\":[\"https://www.midastouch-consulting.com/crypto-chartbook-22032022-bitcoins-time-to-go\",\"https://t.me/MidasTouchConsulting\",\"http://bit.ly/1EUdt2K\"],\"app\":\"steemit/0.2\",\"format\":\"markdown\"}",
"parent_author": "",
"parent_permlink": "bitcoin",
"permlink": "march-22nd-2022-crypto-chartbook-bitcoin-s-time-to-go",
"title": "March 22nd, 2022, Crypto Chartbook – Bitcoin´s time to go"
}
],
"op_in_trx": 0,
"timestamp": "2022-03-22T18:06:24",
"trx_id": "f825f8f23bef217129f8779d8efa000e9f809c0d",
"trx_in_block": 0,
"virtual_op": 0
}2022/03/20 07:37:00
2022/03/20 07:37:00
| author | midastouch |
| permlink | march-19th-2022-gold-chartbook-potential-recovery-to-approx-ususd2-000 |
| voter | midastouch |
| weight | 10000 (100.00%) |
| Transaction Info | Block #62579896/Trx 39163a8aba4f03d83573287f7f10571c48eb2f98 |
View Raw JSON Data
{
  "block": 62579896,
  "op": [
    "vote",
    {
      "author": "midastouch",
      "permlink": "march-19th-2022-gold-chartbook-potential-recovery-to-approx-ususd2-000",
      "voter": "midastouch",
      "weight": 10000
    }
  ],
  "op_in_trx": 0,
  "timestamp": "2022-03-20T07:37:00",
  "trx_id": "39163a8aba4f03d83573287f7f10571c48eb2f98",
  "trx_in_block": 1,
  "virtual_op": 0
}midastouchpublished a new post: march-19th-2022-gold-chartbook-potential-recovery-to-approx-ususd2-0002022/03/20 07:23:57
midastouchpublished a new post: march-19th-2022-gold-chartbook-potential-recovery-to-approx-ususd2-000
2022/03/20 07:23:57
| author | midastouch |
| body |  # [March 19th 2022, Gold Chartbook – Potential recovery to approx. US$2,000](https://www.midastouch-consulting.com/gold-chartbook-19032022-potential-recovery-to-approx-us2000) Driven by the dramatic geopolitical escalation in Ukraine as well as the tough and unprecedented sanctions against Russia, which resulted in exploding oil and commodity prices, the gold market experienced a sharp spike followed by a rather brutal reversal in the last seven weeks. Gold – Potential recovery to approx. US$2,000. Starting at a low of US$1,780 on January 28th, gold went up rapidly US$290 within less than six weeks, reaching a short-term top at US$2,070. Since that high on March 8th, however, gold prices fell back even faster. In total, gold plunged a whooping US$175 to a low of US$1,895 in the aftermath of last week’s FOMC meeting. A quick bounce took prices back to around US$1,950, but the weekly close at around US$1,920 came in lower. This volatile roller coaster ride is truly not for the faint of heart. Nevertheless, gold has done well this year and, despite a looming multi-months correction, it might now be in a setup from which another attack towards US$2,000 could start in the short-term. ### Gold in US-Dollar, weekly chart as of March 19th, 2022. 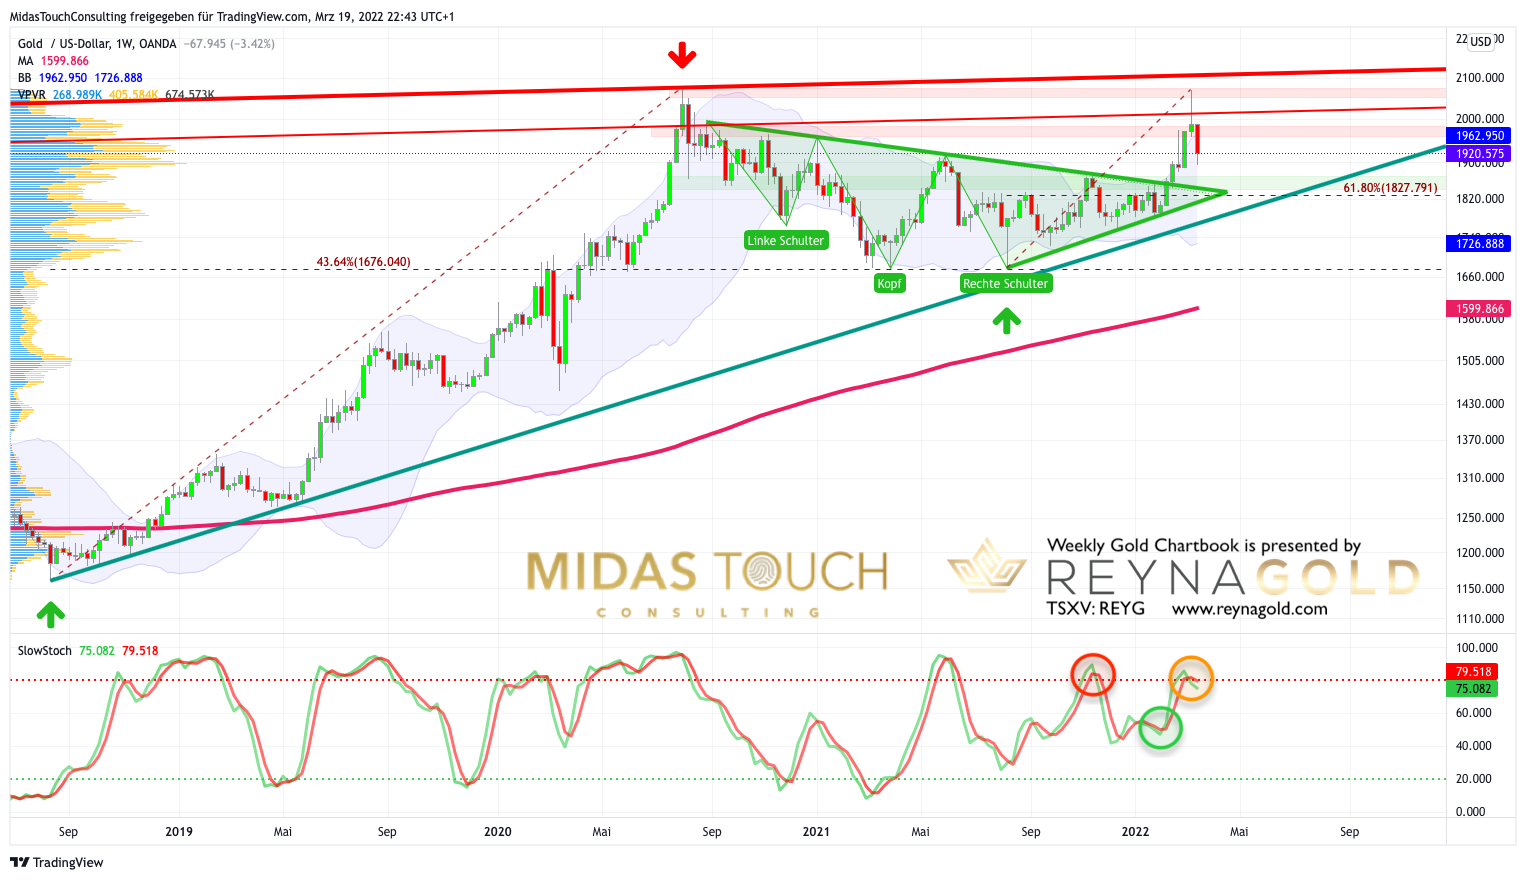 *Gold in US-Dollar, weekly chart as of March 19th, 2022.* On the weekly chart, gold prices have been rushing higher with great momentum. For five consecutive weeks, the bulls were able to bend the upper Bollinger band (US$1,963) upwards. However, the final green candle closed far outside the Bollinger bands and looks like a weekly reversal. Consequently, if gold has now dipped into a multi-months correction, a retracement back to the neckline of the broken triangle respectively the inverse head & shoulder pattern in the range of US$1,820 to US$1,850 would be quite typical and to be expected. In this range, the classic 61.8% retracement of the entire wave up (from the low at US$1,678 on August 9th, 2021 to the most recent blow off top at US$2,070) sits at US$1,827.79. The weekly stochastic oscillator has not yet rolled over, but weekly momentum is overbought and vulnerable. In total, the weekly chart shows a big reversal and therefore no longer supports the bullish case. However, it could still take some more time before a potential correction gains momentum.  ### Gold in US-Dollar, daily chart as of March 19th, 2022. 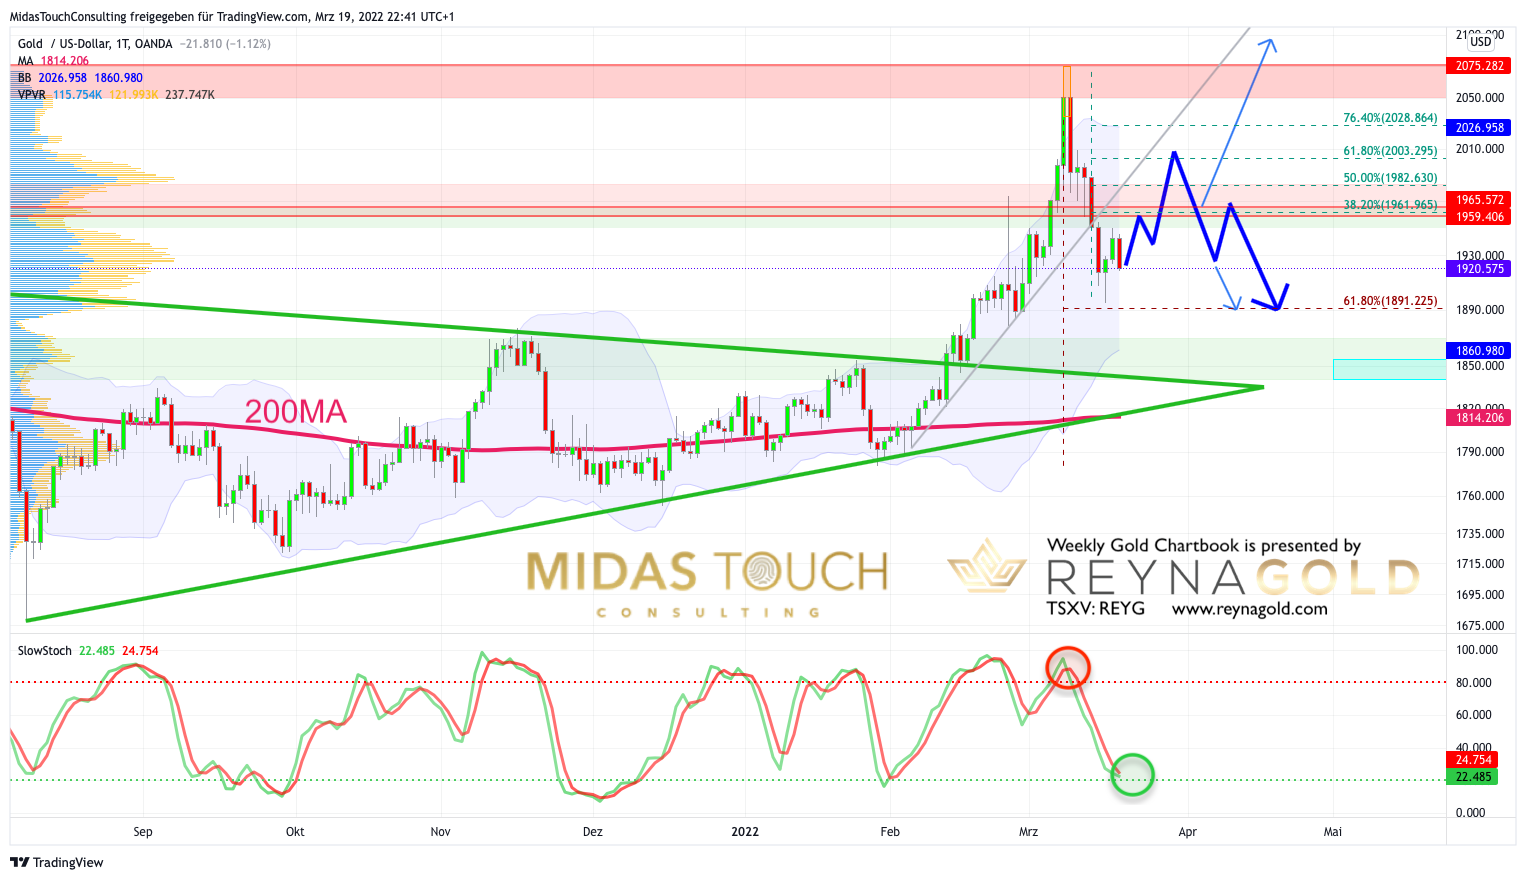 *Gold in US-Dollar, daily chart as of March 19th, 2022.* While the weekly chart may just be at the beginning of a multi-months correction, the overbought setup on the daily chart has already been largely cleared up by the recent steep pullback. Despite Friday’s rather weak closing, the odds are not bad that gold might very soon be turning up again. However, gold bulls need to take out the pivot resistance around US$1,960 to unlock higher price targets in the context of a recovery. The potential Fibonacci retracements are waiting at US$1,962, US$2,003 and US$2,028. Hence, gold could bounce back to approx. US$2,000, which is a round number and therefore a psychological resistance. On the other hand, if gold fails to move back above Thursday’s high at US$1,950, weakness would increase immediately and significantly. In that case, bulls can only hope that the quickly rising lower Bollinger Band (US$1,861) would catch and limit a deeper sell-off. But since the stochastic oscillator has reached its oversold zone, bears might have a hard time pushing gold significantly below US$1,900. Overall, the daily chart is slightly oversold and gold might start a bounce soon. ### Conclusion: Potential recovery to approx. US$2,000 After a strong rally and a steep pullback, the gold market is likely in the process of reordering. While the weekly timeframe points to a correction, the oversold daily chart points to an immediate bounce. Given these contradictory signals, investors and especially traders are well advised to exercise patience and caution in the coming days, weeks and months. If gold has entered a corrective cycle, it could easily take until the early to mid-summer before a sustainable new up-trend might emerge. #### Alternative super bullish scenario Alternatively, and this of course is still a possible scenario, the breakout from the large “cup and handle” pattern is just getting started. In this very bullish case, gold is in the process of breaking out above US$2,100 to finally complete the very large “cup and handle” pattern, which has been developing for 11 years! Obviously, the sky would then be the limit. To summarize, gold is getting really bullish back above US$2,030. On the other hand, below $US1,895 the bears would be in control. In between those two numbers, the odds favor a bounce towards US$1,960 and maybe USD$2,000. _Feel free to join us in our free [Telegram channel](https://t.me/MidasTouchConsulting) for daily real time data and a great community._ _If you like to get regular updates on our gold model, precious metals and cryptocurrencies you can subscribe to our [free newsletter](http://bit.ly/1EUdt2K)._ _This article does not contain investment advice or recommendations. Every investment and trading move involves risk, and readers should conduct their own research when making a decision._ |
| json metadata | {"tags":["silvergoldstackers","steemsilvergold","silver","gold","preciousmetals","trading","investing","exploration"],"image":["https://images.hive.blog/DQmTBjF3wP9cvdKmVDvTAPDoPcpeVGCrugqy1Ub6YEv8NRa/blog-header-gold-reynagold-798x297.jpg","https://images.hive.blog/DQmfDUap9WrsJ5Ru7Hjwkfcoh7qmPLzt17APwVNwRMyGUwF/Chart%201%20Gold%20in%20USD%20weekly%20190322.png","https://images.hive.blog/DQmbax9GR8h5X7RPKJKdYZMQKnTPsEo6MuzHvsQ5EWZVzu7/2022-01-15%20Why%20Invest%20in%20Reyna%20Gold.png","https://images.hive.blog/DQmZybfJWZij6p8UBCoYDekKUTDpZVJh8jQHzqaYUeSCMjd/Chart%202%20Gold%20in%20USD%20daily%20190322.png"],"links":["https://www.midastouch-consulting.com/gold-chartbook-19032022-potential-recovery-to-approx-us2000","https://t.me/MidasTouchConsulting","http://bit.ly/1EUdt2K"],"app":"steemit/0.2","format":"markdown"} |
| parent author | |
| parent permlink | silvergoldstackers |
| permlink | march-19th-2022-gold-chartbook-potential-recovery-to-approx-ususd2-000 |
| title | March 19th 2022, Gold Chartbook – Potential recovery to approx. US$2,000 |
| Transaction Info | Block #62579637/Trx 5fea2f1934c7c3b6c9878852e7f11ffcb9abad06 |
View Raw JSON Data
{
"block": 62579637,
"op": [
"comment",
{
"author": "midastouch",
"body": " \n\n# [March 19th 2022, Gold Chartbook – Potential recovery to approx. US$2,000](https://www.midastouch-consulting.com/gold-chartbook-19032022-potential-recovery-to-approx-us2000)\n\nDriven by the dramatic geopolitical escalation in Ukraine as well as the tough and unprecedented sanctions against Russia, which resulted in exploding oil and commodity prices, the gold market experienced a sharp spike followed by a rather brutal reversal in the last seven weeks. Gold – Potential recovery to approx. US$2,000.\n\nStarting at a low of US$1,780 on January 28th, gold went up rapidly US$290 within less than six weeks, reaching a short-term top at US$2,070. Since that high on March 8th, however, gold prices fell back even faster. In total, gold plunged a whooping US$175 to a low of US$1,895 in the aftermath of last week’s FOMC meeting. A quick bounce took prices back to around US$1,950, but the weekly close at around US$1,920 came in lower.\n\nThis volatile roller coaster ride is truly not for the faint of heart. Nevertheless, gold has done well this year and, despite a looming multi-months correction, it might now be in a setup from which another attack towards US$2,000 could start in the short-term.\n\n### Gold in US-Dollar, weekly chart as of March 19th, 2022.\n\n*Gold in US-Dollar, weekly chart as of March 19th, 2022.*\n\nOn the weekly chart, gold prices have been rushing higher with great momentum. For five consecutive weeks, the bulls were able to bend the upper Bollinger band (US$1,963) upwards. However, the final green candle closed far outside the Bollinger bands and looks like a weekly reversal. Consequently, if gold has now dipped into a multi-months correction, a retracement back to the neckline of the broken triangle respectively the inverse head & shoulder pattern in the range of US$1,820 to US$1,850 would be quite typical and to be expected. In this range, the classic 61.8% retracement of the entire wave up (from the low at US$1,678 on August 9th, 2021 to the most recent blow off top at US$2,070) sits at US$1,827.79. The weekly stochastic oscillator has not yet rolled over, but weekly momentum is overbought and vulnerable.\n\nIn total, the weekly chart shows a big reversal and therefore no longer supports the bullish case. However, it could still take some more time before a potential correction gains momentum.\n\n \n\n### Gold in US-Dollar, daily chart as of March 19th, 2022.\n\n*Gold in US-Dollar, daily chart as of March 19th, 2022.*\n\nWhile the weekly chart may just be at the beginning of a multi-months correction, the overbought setup on the daily chart has already been largely cleared up by the recent steep pullback. Despite Friday’s rather weak closing, the odds are not bad that gold might very soon be turning up again. However, gold bulls need to take out the pivot resistance around US$1,960 to unlock higher price targets in the context of a recovery. The potential Fibonacci retracements are waiting at US$1,962, US$2,003 and US$2,028. Hence, gold could bounce back to approx. US$2,000, which is a round number and therefore a psychological resistance.\n\nOn the other hand, if gold fails to move back above Thursday’s high at US$1,950, weakness would increase immediately and significantly. In that case, bulls can only hope that the quickly rising lower Bollinger Band (US$1,861) would catch and limit a deeper sell-off. But since the stochastic oscillator has reached its oversold zone, bears might have a hard time pushing gold significantly below US$1,900.\n\nOverall, the daily chart is slightly oversold and gold might start a bounce soon.\n\n### Conclusion: Potential recovery to approx. US$2,000\n\nAfter a strong rally and a steep pullback, the gold market is likely in the process of reordering. While the weekly timeframe points to a correction, the oversold daily chart points to an immediate bounce. Given these contradictory signals, investors and especially traders are well advised to exercise patience and caution in the coming days, weeks and months. If gold has entered a corrective cycle, it could easily take until the early to mid-summer before a sustainable new up-trend might emerge.\n\n#### Alternative super bullish scenario\n\nAlternatively, and this of course is still a possible scenario, the breakout from the large “cup and handle” pattern is just getting started. In this very bullish case, gold is in the process of breaking out above US$2,100 to finally complete the very large “cup and handle” pattern, which has been developing for 11 years! Obviously, the sky would then be the limit.\n\nTo summarize, gold is getting really bullish back above US$2,030. On the other hand, below $US1,895 the bears would be in control. In between those two numbers, the odds favor a bounce towards US$1,960 and maybe USD$2,000.\n\n_Feel free to join us in our free [Telegram channel](https://t.me/MidasTouchConsulting) for daily real time data and a great community._ \n\n_If you like to get regular updates on our gold model, precious metals and cryptocurrencies you can subscribe to our [free newsletter](http://bit.ly/1EUdt2K)._ \n\n_This article does not contain investment advice or recommendations. Every investment and trading move involves risk, and readers should conduct their own research when making a decision._",
"json_metadata": "{\"tags\":[\"silvergoldstackers\",\"steemsilvergold\",\"silver\",\"gold\",\"preciousmetals\",\"trading\",\"investing\",\"exploration\"],\"image\":[\"https://images.hive.blog/DQmTBjF3wP9cvdKmVDvTAPDoPcpeVGCrugqy1Ub6YEv8NRa/blog-header-gold-reynagold-798x297.jpg\",\"https://images.hive.blog/DQmfDUap9WrsJ5Ru7Hjwkfcoh7qmPLzt17APwVNwRMyGUwF/Chart%201%20Gold%20in%20USD%20weekly%20190322.png\",\"https://images.hive.blog/DQmbax9GR8h5X7RPKJKdYZMQKnTPsEo6MuzHvsQ5EWZVzu7/2022-01-15%20Why%20Invest%20in%20Reyna%20Gold.png\",\"https://images.hive.blog/DQmZybfJWZij6p8UBCoYDekKUTDpZVJh8jQHzqaYUeSCMjd/Chart%202%20Gold%20in%20USD%20daily%20190322.png\"],\"links\":[\"https://www.midastouch-consulting.com/gold-chartbook-19032022-potential-recovery-to-approx-us2000\",\"https://t.me/MidasTouchConsulting\",\"http://bit.ly/1EUdt2K\"],\"app\":\"steemit/0.2\",\"format\":\"markdown\"}",
"parent_author": "",
"parent_permlink": "silvergoldstackers",
"permlink": "march-19th-2022-gold-chartbook-potential-recovery-to-approx-ususd2-000",
"title": "March 19th 2022, Gold Chartbook – Potential recovery to approx. US$2,000"
}
],
"op_in_trx": 0,
"timestamp": "2022-03-20T07:23:57",
"trx_id": "5fea2f1934c7c3b6c9878852e7f11ffcb9abad06",
"trx_in_block": 1,
"virtual_op": 0
}2022/03/15 12:32:24
2022/03/15 12:32:24
| author | midastouch |
| permlink | march-15th-2022-crypto-chartbook-bitcoin-is-needed-as-an-alternative |
| voter | midastouch |
| weight | 10000 (100.00%) |
| Transaction Info | Block #62442479/Trx a0608fab707aa2b83cd45dd2bfc3b01a5f47dc4f |
View Raw JSON Data
{
  "block": 62442479,
  "op": [
    "vote",
    {
      "author": "midastouch",
      "permlink": "march-15th-2022-crypto-chartbook-bitcoin-is-needed-as-an-alternative",
      "voter": "midastouch",
      "weight": 10000
    }
  ],
  "op_in_trx": 0,
  "timestamp": "2022-03-15T12:32:24",
  "trx_id": "a0608fab707aa2b83cd45dd2bfc3b01a5f47dc4f",
  "trx_in_block": 5,
  "virtual_op": 0
}midastouchpublished a new post: march-15th-2022-crypto-chartbook-bitcoin-is-needed-as-an-alternative2022/03/15 12:32:12
midastouchpublished a new post: march-15th-2022-crypto-chartbook-bitcoin-is-needed-as-an-alternative
2022/03/15 12:32:12
| author | midastouch |
| body |  # [March 15th, 2022, Crypto Chartbook – Bitcoin is needed as an alternative](https://www.midastouch-consulting.com/crypto-chartbook-15032022-bitcoin-is-needed-as-an-alternative) The recent war climate has created a higher demand for bitcoin. Even more apparent became Bitcoin´s use for wealth preservation. And there is another aspect that will likely come to the forefront. Leading currencies need to flow freely to fulfill their supreme rule as a means of exchange. The value of a world currency gets diminished, once sanctions are imposed. Of course, competition is evoked to create a medium that can be used as a payment method. The competition between different nations has been ongoing for years to publicize their digital currencies. Yet, this urgency has been underlined by the current political environment. Bitcoin is needed as an alternative.  The weakened US-Dollar and the present unexpected climate seems not being fully reflected in bitcoin´s price. Consequently, bitcoin prices could soar in the not too distant future. ### Bitcoin/Gold-Ratio, daily chart, bottom building: 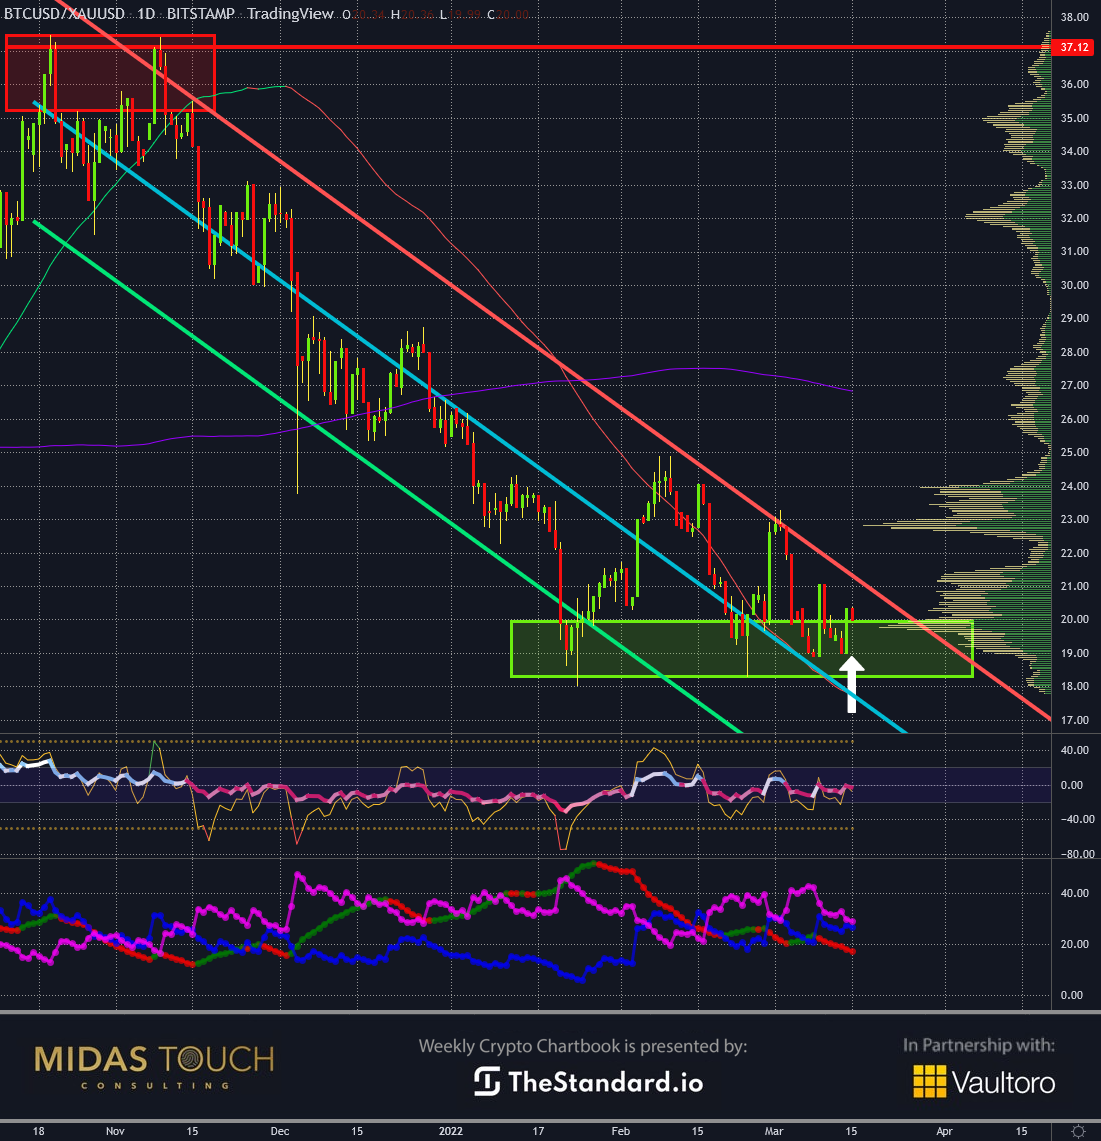 *Bitcoin/Gold-Ratio, daily chart as of March 15th, 2022.* A phenomenon in times of crisis is that individuals look for absolutes or extremes to resolve difficult circumstances. We instead advocate a more principle-based process of solving problems, an approach of choices. Regarding wealth preservation, this would mean gold and silver alongside bitcoin. The daily chart of the bitcoin/gold-ratio shows the bottom building after a downtrend. Currently, one can purchase a bitcoin for twenty ounces of gold. Nearly half as much as five months ago. Indeed, an opportunity to rotate one’s precious metal holding partially into a cheap bitcoin acquisition.  ### Bitcoin, monthly chart, in waiting position: 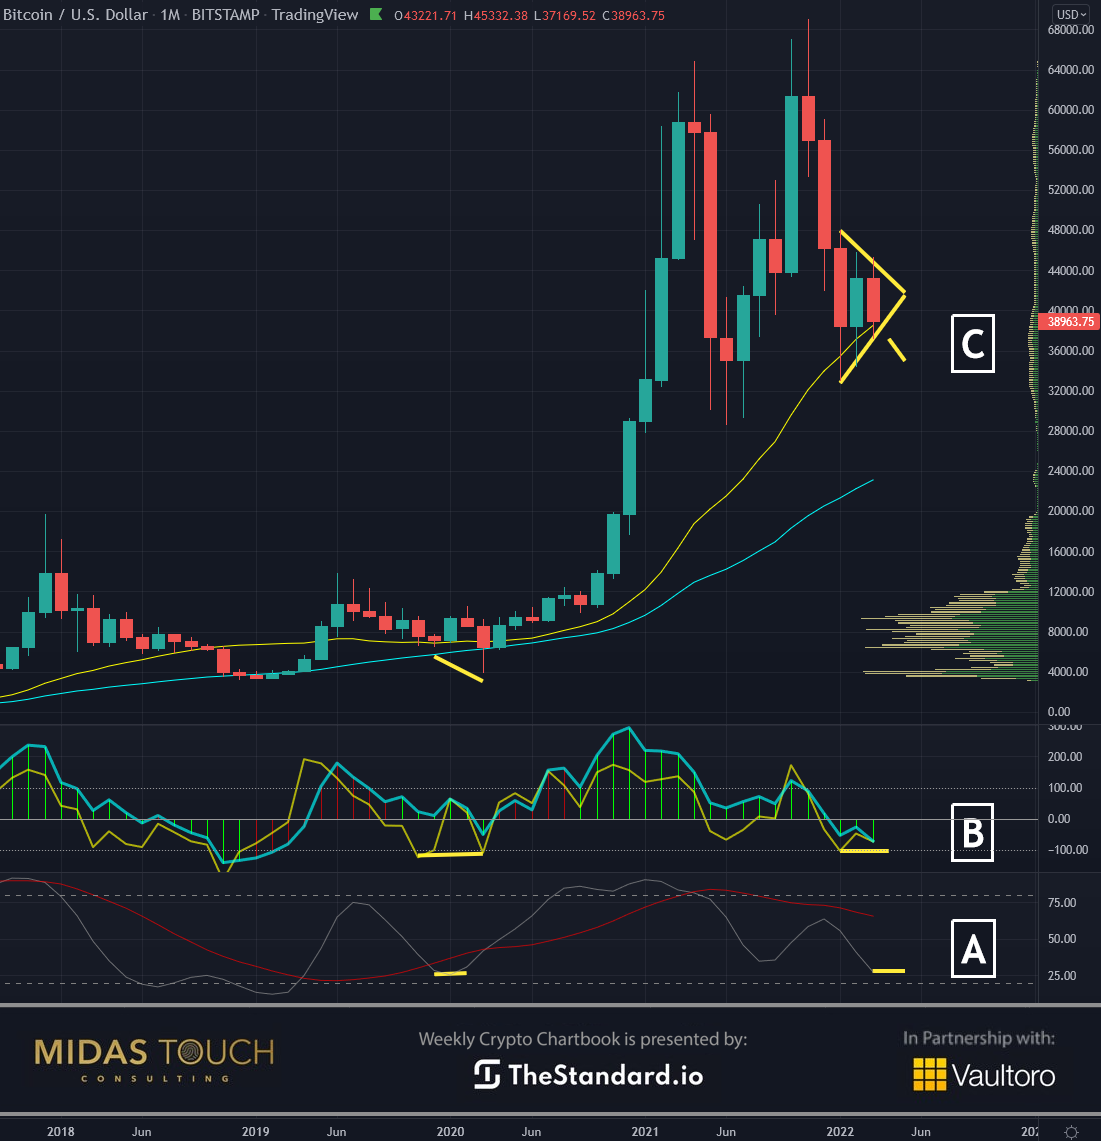 *Bitcoin in USD, monthly chart as of March 15th, 2022.* War inherently divides nations, and that does not mean limiting only the ones directly in conflict with each other. It is this divide that, in addition, fuels the competition for each nation to be first in their digital currency release. Sanctioned countries have limited access to the US-Dollar. Consequently, they are highly motivated to create an alternate payment method. The monthly chart is not showing this fundamental support for bitcoin. Early signs of a triangle show that we find likely to break to the upside. Slow stochastic indicator reading (A) shows that the last time around at these levels, a strong up move followed. Similar to the yellow CCI turbo line-level reading (B). Before such a move, we witnessed a quick price spike down (C), which would be no surprise. ### Bitcoin, weekly chart, bitcoin as an alternative is needed: 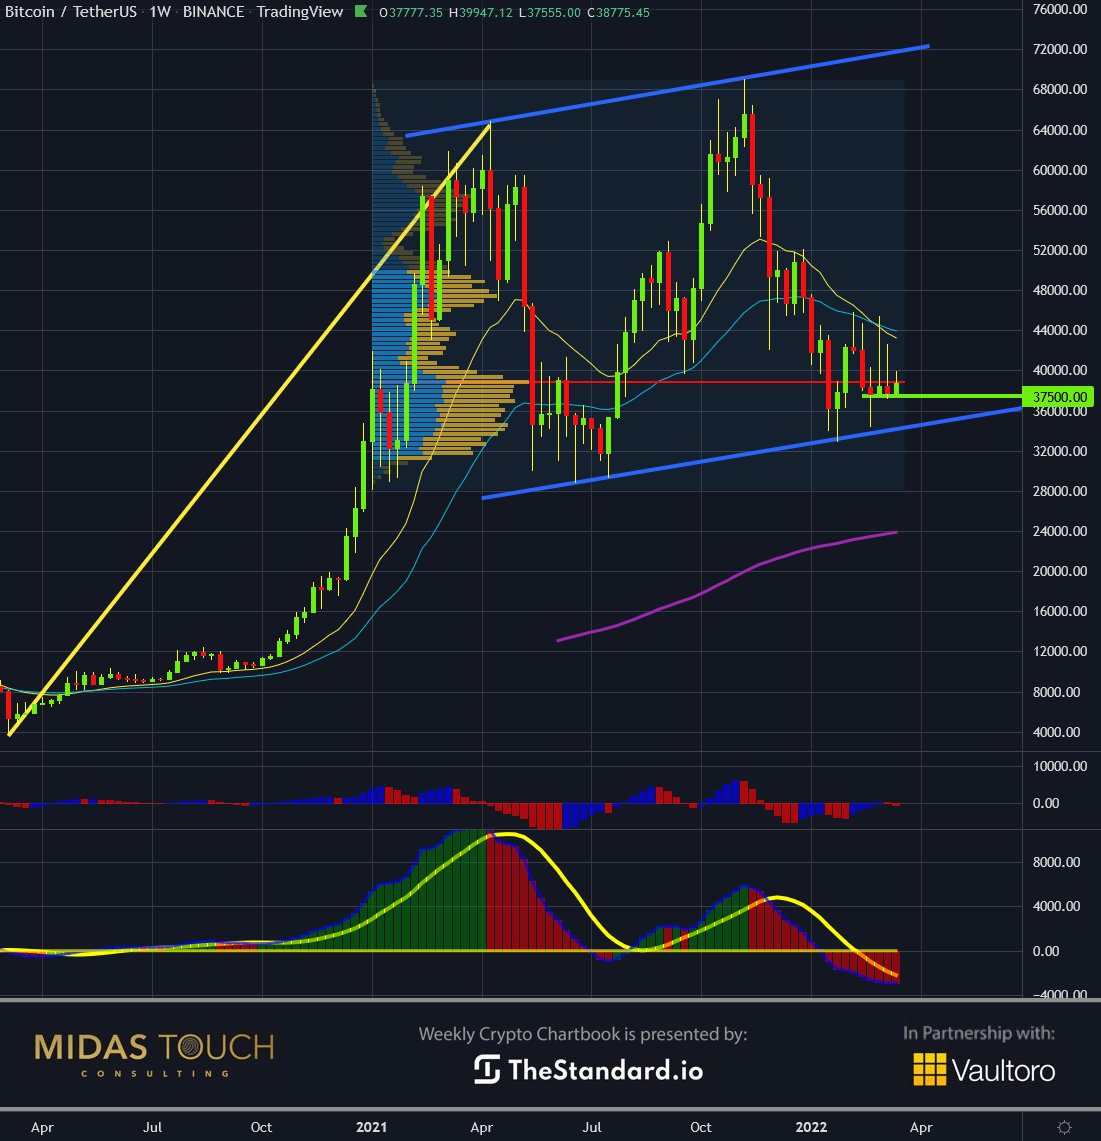 *Bitcoin in USD, weekly chart as of March 15th, 2022.* Zooming into the weekly time frame, we can make out the battle between bulls and bears in more detail. Over the last three weeks, prices were rejected above the POC (point of control = high volume node, where our volume profile analysis ranges over the previous fifteen months). As well, price behavior is reflecting the war climate’s uncertainty. At the same time, the bulls have held steady any attempt of the bears trying to push prices below US$37,500. Hence, we should see a substantial move once trading snaps out of this “magnet trading” to the high-volume node. ### Bitcoin, daily chart, gains and volatility : 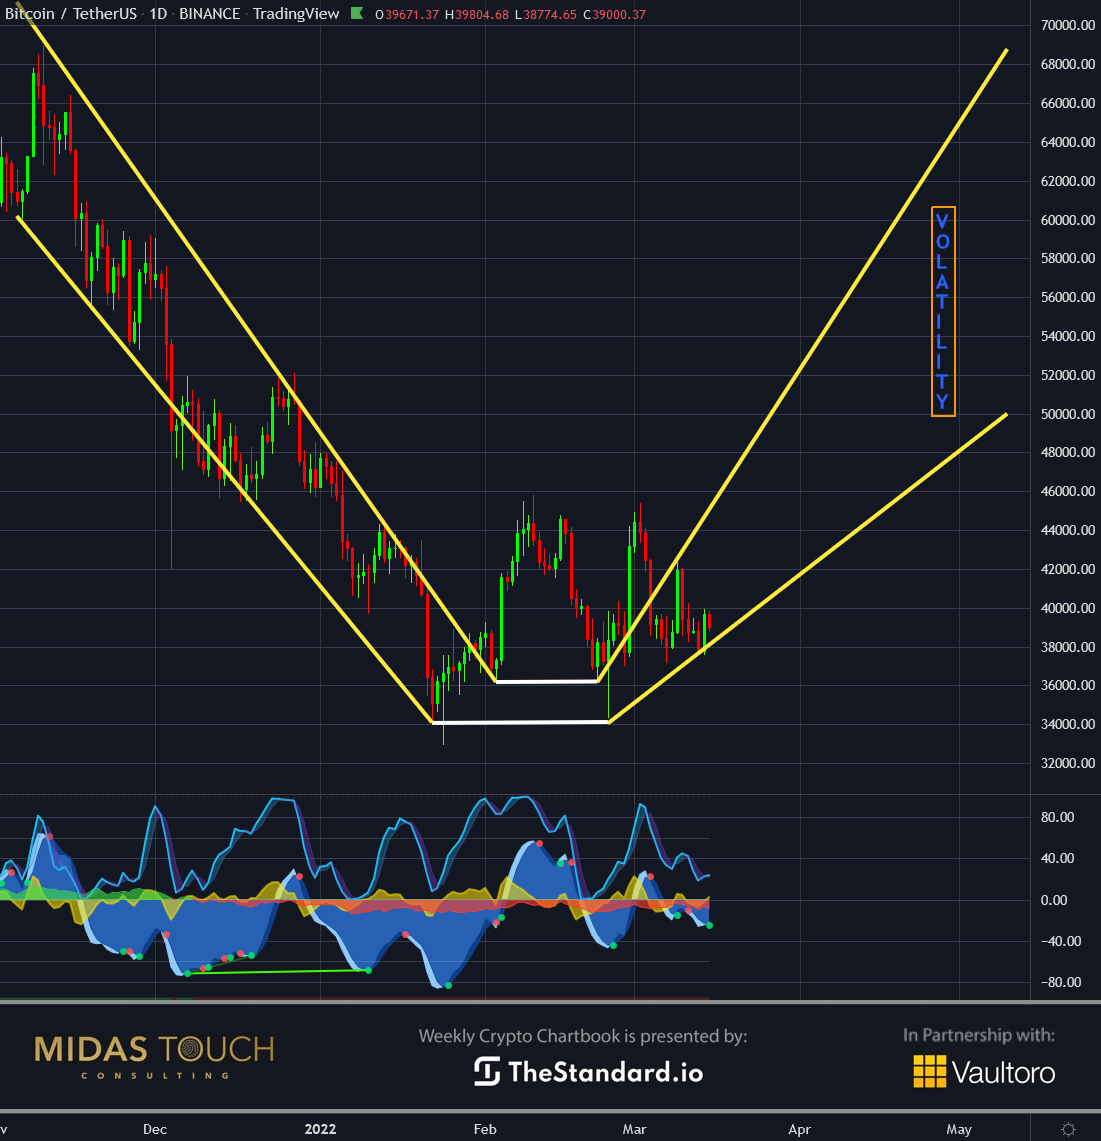 *Bitcoin in USD, daily chart as of March 15th, 2022.* The daily chart of bitcoin above describes how we see the future unfold. We anticipate the price to reach all-time highs within the upcoming month. Unfortunately, not in bitcoins typical swing trading manner. We foresee a choppy, volatile market. Consequently, short and midterm trading will be challenging. Stepping up in time frame is a helpful approach to avoid the noise. ### Bitcoin is needed as an alternative: Governments will try to keep their monopolies and power. However, we don’t think that the adoption of a digital dollar by the masses will not be that easy. We find this especially true to be in a highly transitory time of rapid changes and many challenges. Typically, multiple propaganda waves through media have bridged such doubt but might have lost some of its trustworthiness. Consequently, bitcoin has a fair chance for mass adoption just as well. It already has a history and carries inherent features of freedom that people might long for more than anticipated.  _Feel free to join us in our free [Telegram channel](https://t.me/MidasTouchConsulting) for daily real time data and a great community._ _If you like to get regular updates on our gold model, precious metals and cryptocurrencies you can subscribe to our [free newsletter](http://bit.ly/1EUdt2K)._ _Disclosure: This article does not contain investment advice or recommendations. Every investment and trading move involves risk, and readers should conduct their own research when making a decision._ |
| json metadata | {"tags":["bitcoin","leofinance","ethereum","crypto","trading","investing","stablecoin","btc"],"image":["https://images.hive.blog/DQmY9Dvrcx9dFZXTMGYhaevkyNxJhKu3UiNLuPfHX5hf1Vj/blog-header-crypto-thestandard.jpeg","https://images.hive.blog/DQmcmjvFNZVDGdqFxmUAoddh9GkYDJ4vdqDUdteXzkcWm7g/blog-banner-crypto-thestandard%201.png","https://images.hive.blog/DQmZGSF1KdQNeFJd267n3tJ1Q8v8R397juTNxiCx4BhCPT3/Chart-1-Bitcoin-versus-Gold-in-USD-daily-chart-as-of-March-15th-2022..png","https://images.hive.blog/DQmS7gQmEaeq6rFyX2NA4KfvXqwHrdPQE7agFfjtQbJnUeG/blog-banner-crypto-thestandard%202.png","https://images.hive.blog/DQmRFz46QqEoJr7WS6bN1itxeoZ6gQ4LLdYDdaScJEV8c8N/Chart-2-Bitcoin-in-USD-monthly-chart-as-of-March-15th-2022..png","https://images.hive.blog/DQmZcgLKgPYdtNFXEH9RZVFjGksfVtMx2D7dKQNiyXoU4kZ/Chart-3-Bitcoin-in-USD-weekly-chart-as-of-March-15th-2022..png","https://images.hive.blog/DQmWGmY86KcfBEBdVsdDbxDXovEg7iR4gnQeUdN4jLe2yvJ/Chart-4-Bitcoin-in-USD-daily-chart-as-of-March-15th-2022..png","https://images.hive.blog/DQmZpVHfzSSLvtmfqDNpjdPCg8HcjEkLvBSRvuvb3ok75fH/blog-banner-crypto-thestandard%203.jpeg"],"links":["https://www.midastouch-consulting.com/crypto-chartbook-15032022-bitcoin-is-needed-as-an-alternative","https://t.me/MidasTouchConsulting","http://bit.ly/1EUdt2K"],"app":"steemit/0.2","format":"markdown"} |
| parent author | |
| parent permlink | bitcoin |
| permlink | march-15th-2022-crypto-chartbook-bitcoin-is-needed-as-an-alternative |
| title | March 15th, 2022, Crypto Chartbook – Bitcoin is needed as an alternative |
| Transaction Info | Block #62442475/Trx 7b98c17e6cadb1d062187cc88b73e1bcb5904845 |
View Raw JSON Data
{
"block": 62442475,
"op": [
"comment",
{
"author": "midastouch",
"body": "\n# [March 15th, 2022, Crypto Chartbook – Bitcoin is needed as an alternative](https://www.midastouch-consulting.com/crypto-chartbook-15032022-bitcoin-is-needed-as-an-alternative)\n\nThe recent war climate has created a higher demand for bitcoin. Even more apparent became Bitcoin´s use for wealth preservation. And there is another aspect that will likely come to the forefront. Leading currencies need to flow freely to fulfill their supreme rule as a means of exchange. The value of a world currency gets diminished, once sanctions are imposed. Of course, competition is evoked to create a medium that can be used as a payment method. The competition between different nations has been ongoing for years to publicize their digital currencies. Yet, this urgency has been underlined by the current political environment. Bitcoin is needed as an alternative.\n\n\n\nThe weakened US-Dollar and the present unexpected climate seems not being fully reflected in bitcoin´s price. Consequently, bitcoin prices could soar in the not too distant future.\n\n### Bitcoin/Gold-Ratio, daily chart, bottom building:\n\n*Bitcoin/Gold-Ratio, daily chart as of March 15th, 2022.*\n\nA phenomenon in times of crisis is that individuals look for absolutes or extremes to resolve difficult circumstances. We instead advocate a more principle-based process of solving problems, an approach of choices. Regarding wealth preservation, this would mean gold and silver alongside bitcoin.\n\nThe daily chart of the bitcoin/gold-ratio shows the bottom building after a downtrend. Currently, one can purchase a bitcoin for twenty ounces of gold. Nearly half as much as five months ago. Indeed, an opportunity to rotate one’s precious metal holding partially into a cheap bitcoin acquisition.\n\n\n\n### Bitcoin, monthly chart, in waiting position:\n\n*Bitcoin in USD, monthly chart as of March 15th, 2022.*\n\nWar inherently divides nations, and that does not mean limiting only the ones directly in conflict with each other. It is this divide that, in addition, fuels the competition for each nation to be first in their digital currency release. Sanctioned countries have limited access to the US-Dollar. Consequently, they are highly motivated to create an alternate payment method.\n\nThe monthly chart is not showing this fundamental support for bitcoin. Early signs of a triangle show that we find likely to break to the upside. Slow stochastic indicator reading (A) shows that the last time around at these levels, a strong up move followed. Similar to the yellow CCI turbo line-level reading (B). Before such a move, we witnessed a quick price spike down (C), which would be no surprise.\n\n### Bitcoin, weekly chart, bitcoin as an alternative is needed:\n\n*Bitcoin in USD, weekly chart as of March 15th, 2022.*\n\nZooming into the weekly time frame, we can make out the battle between bulls and bears in more detail. Over the last three weeks, prices were rejected above the POC (point of control = high volume node, where our volume profile analysis ranges over the previous fifteen months). As well, price behavior is reflecting the war climate’s uncertainty. At the same time, the bulls have held steady any attempt of the bears trying to push prices below US$37,500. Hence, we should see a substantial move once trading snaps out of this “magnet trading” to the high-volume node.\n\n### Bitcoin, daily chart, gains and volatility :\n\n*Bitcoin in USD, daily chart as of March 15th, 2022.*\n\nThe daily chart of bitcoin above describes how we see the future unfold. We anticipate the price to reach all-time highs within the upcoming month. Unfortunately, not in bitcoins typical swing trading manner. We foresee a choppy, volatile market. Consequently, short and midterm trading will be challenging. Stepping up in time frame is a helpful approach to avoid the noise.\n\n### Bitcoin is needed as an alternative:\n\nGovernments will try to keep their monopolies and power. However, we don’t think that the adoption of a digital dollar by the masses will not be that easy. We find this especially true to be in a highly transitory time of rapid changes and many challenges.\n\nTypically, multiple propaganda waves through media have bridged such doubt but might have lost some of its trustworthiness. Consequently, bitcoin has a fair chance for mass adoption just as well. It already has a history and carries inherent features of freedom that people might long for more than anticipated.\n\n\n\n_Feel free to join us in our free [Telegram channel](https://t.me/MidasTouchConsulting) for daily real time data and a great community._ \n\n_If you like to get regular updates on our gold model, precious metals and cryptocurrencies you can subscribe to our [free newsletter](http://bit.ly/1EUdt2K)._ \n\n_Disclosure: This article does not contain investment advice or recommendations. Every investment and trading move involves risk, and readers should conduct their own research when making a decision._",
"json_metadata": "{\"tags\":[\"bitcoin\",\"leofinance\",\"ethereum\",\"crypto\",\"trading\",\"investing\",\"stablecoin\",\"btc\"],\"image\":[\"https://images.hive.blog/DQmY9Dvrcx9dFZXTMGYhaevkyNxJhKu3UiNLuPfHX5hf1Vj/blog-header-crypto-thestandard.jpeg\",\"https://images.hive.blog/DQmcmjvFNZVDGdqFxmUAoddh9GkYDJ4vdqDUdteXzkcWm7g/blog-banner-crypto-thestandard%201.png\",\"https://images.hive.blog/DQmZGSF1KdQNeFJd267n3tJ1Q8v8R397juTNxiCx4BhCPT3/Chart-1-Bitcoin-versus-Gold-in-USD-daily-chart-as-of-March-15th-2022..png\",\"https://images.hive.blog/DQmS7gQmEaeq6rFyX2NA4KfvXqwHrdPQE7agFfjtQbJnUeG/blog-banner-crypto-thestandard%202.png\",\"https://images.hive.blog/DQmRFz46QqEoJr7WS6bN1itxeoZ6gQ4LLdYDdaScJEV8c8N/Chart-2-Bitcoin-in-USD-monthly-chart-as-of-March-15th-2022..png\",\"https://images.hive.blog/DQmZcgLKgPYdtNFXEH9RZVFjGksfVtMx2D7dKQNiyXoU4kZ/Chart-3-Bitcoin-in-USD-weekly-chart-as-of-March-15th-2022..png\",\"https://images.hive.blog/DQmWGmY86KcfBEBdVsdDbxDXovEg7iR4gnQeUdN4jLe2yvJ/Chart-4-Bitcoin-in-USD-daily-chart-as-of-March-15th-2022..png\",\"https://images.hive.blog/DQmZpVHfzSSLvtmfqDNpjdPCg8HcjEkLvBSRvuvb3ok75fH/blog-banner-crypto-thestandard%203.jpeg\"],\"links\":[\"https://www.midastouch-consulting.com/crypto-chartbook-15032022-bitcoin-is-needed-as-an-alternative\",\"https://t.me/MidasTouchConsulting\",\"http://bit.ly/1EUdt2K\"],\"app\":\"steemit/0.2\",\"format\":\"markdown\"}",
"parent_author": "",
"parent_permlink": "bitcoin",
"permlink": "march-15th-2022-crypto-chartbook-bitcoin-is-needed-as-an-alternative",
"title": "March 15th, 2022, Crypto Chartbook – Bitcoin is needed as an alternative"
}
],
"op_in_trx": 0,
"timestamp": "2022-03-15T12:32:12",
"trx_id": "7b98c17e6cadb1d062187cc88b73e1bcb5904845",
"trx_in_block": 7,
"virtual_op": 0
}2022/03/13 20:48:48
2022/03/13 20:48:48
| author | midastouch |
| permlink | march-13th-2022-gold-chartbook-spring-correction-or-further-escalation |
| voter | midastouch |
| weight | 10000 (100.00%) |
| Transaction Info | Block #62395038/Trx 8241b9b2d807ce891469cc65e2fa7bbfaecbe9e6 |
View Raw JSON Data
{
  "block": 62395038,
  "op": [
    "vote",
    {
      "author": "midastouch",
      "permlink": "march-13th-2022-gold-chartbook-spring-correction-or-further-escalation",
      "voter": "midastouch",
      "weight": 10000
    }
  ],
  "op_in_trx": 0,
  "timestamp": "2022-03-13T20:48:48",
  "trx_id": "8241b9b2d807ce891469cc65e2fa7bbfaecbe9e6",
  "trx_in_block": 10,
  "virtual_op": 0
}midastouchpublished a new post: march-13th-2022-gold-chartbook-spring-correction-or-further-escalation2022/03/13 20:48:33
midastouchpublished a new post: march-13th-2022-gold-chartbook-spring-correction-or-further-escalation
2022/03/13 20:48:33
| author | midastouch |
| body |  # [March 13th 2022, Gold Chartbook – Spring correction or further escalation?](https://www.midastouch-consulting.com/gold-chartbook-13032022-spring-correction-or-further-escalation) When Gold started to break out of its multi-month triangle in early February, we figured that US$1,975 would be a realistic target. We also stated that a short-lived overshot towards US$2,000 would be a possibility. Little did we know back then about the geopolitical turmoil that unfolded over the last six weeks. The Russian invasion followed by massive sanctions have pushed commodities and gold strongly higher. Even though it appears very challenging to follow your preplanned analysis while at the same remaining an open-minded listener to the markets, we now see a setup where gold has become vulnerable in the short-term. At the same time, the fundamentals have never been more bullish for gold, and it doesn’t take much upside to initiate another run towards the all-time high at US$2,075. Gold – Spring correction or further escalation? Let’s examine the gold market with a top-down approach. ### Gold in US-Dollar, monthly chart as of March 13th, 2022. 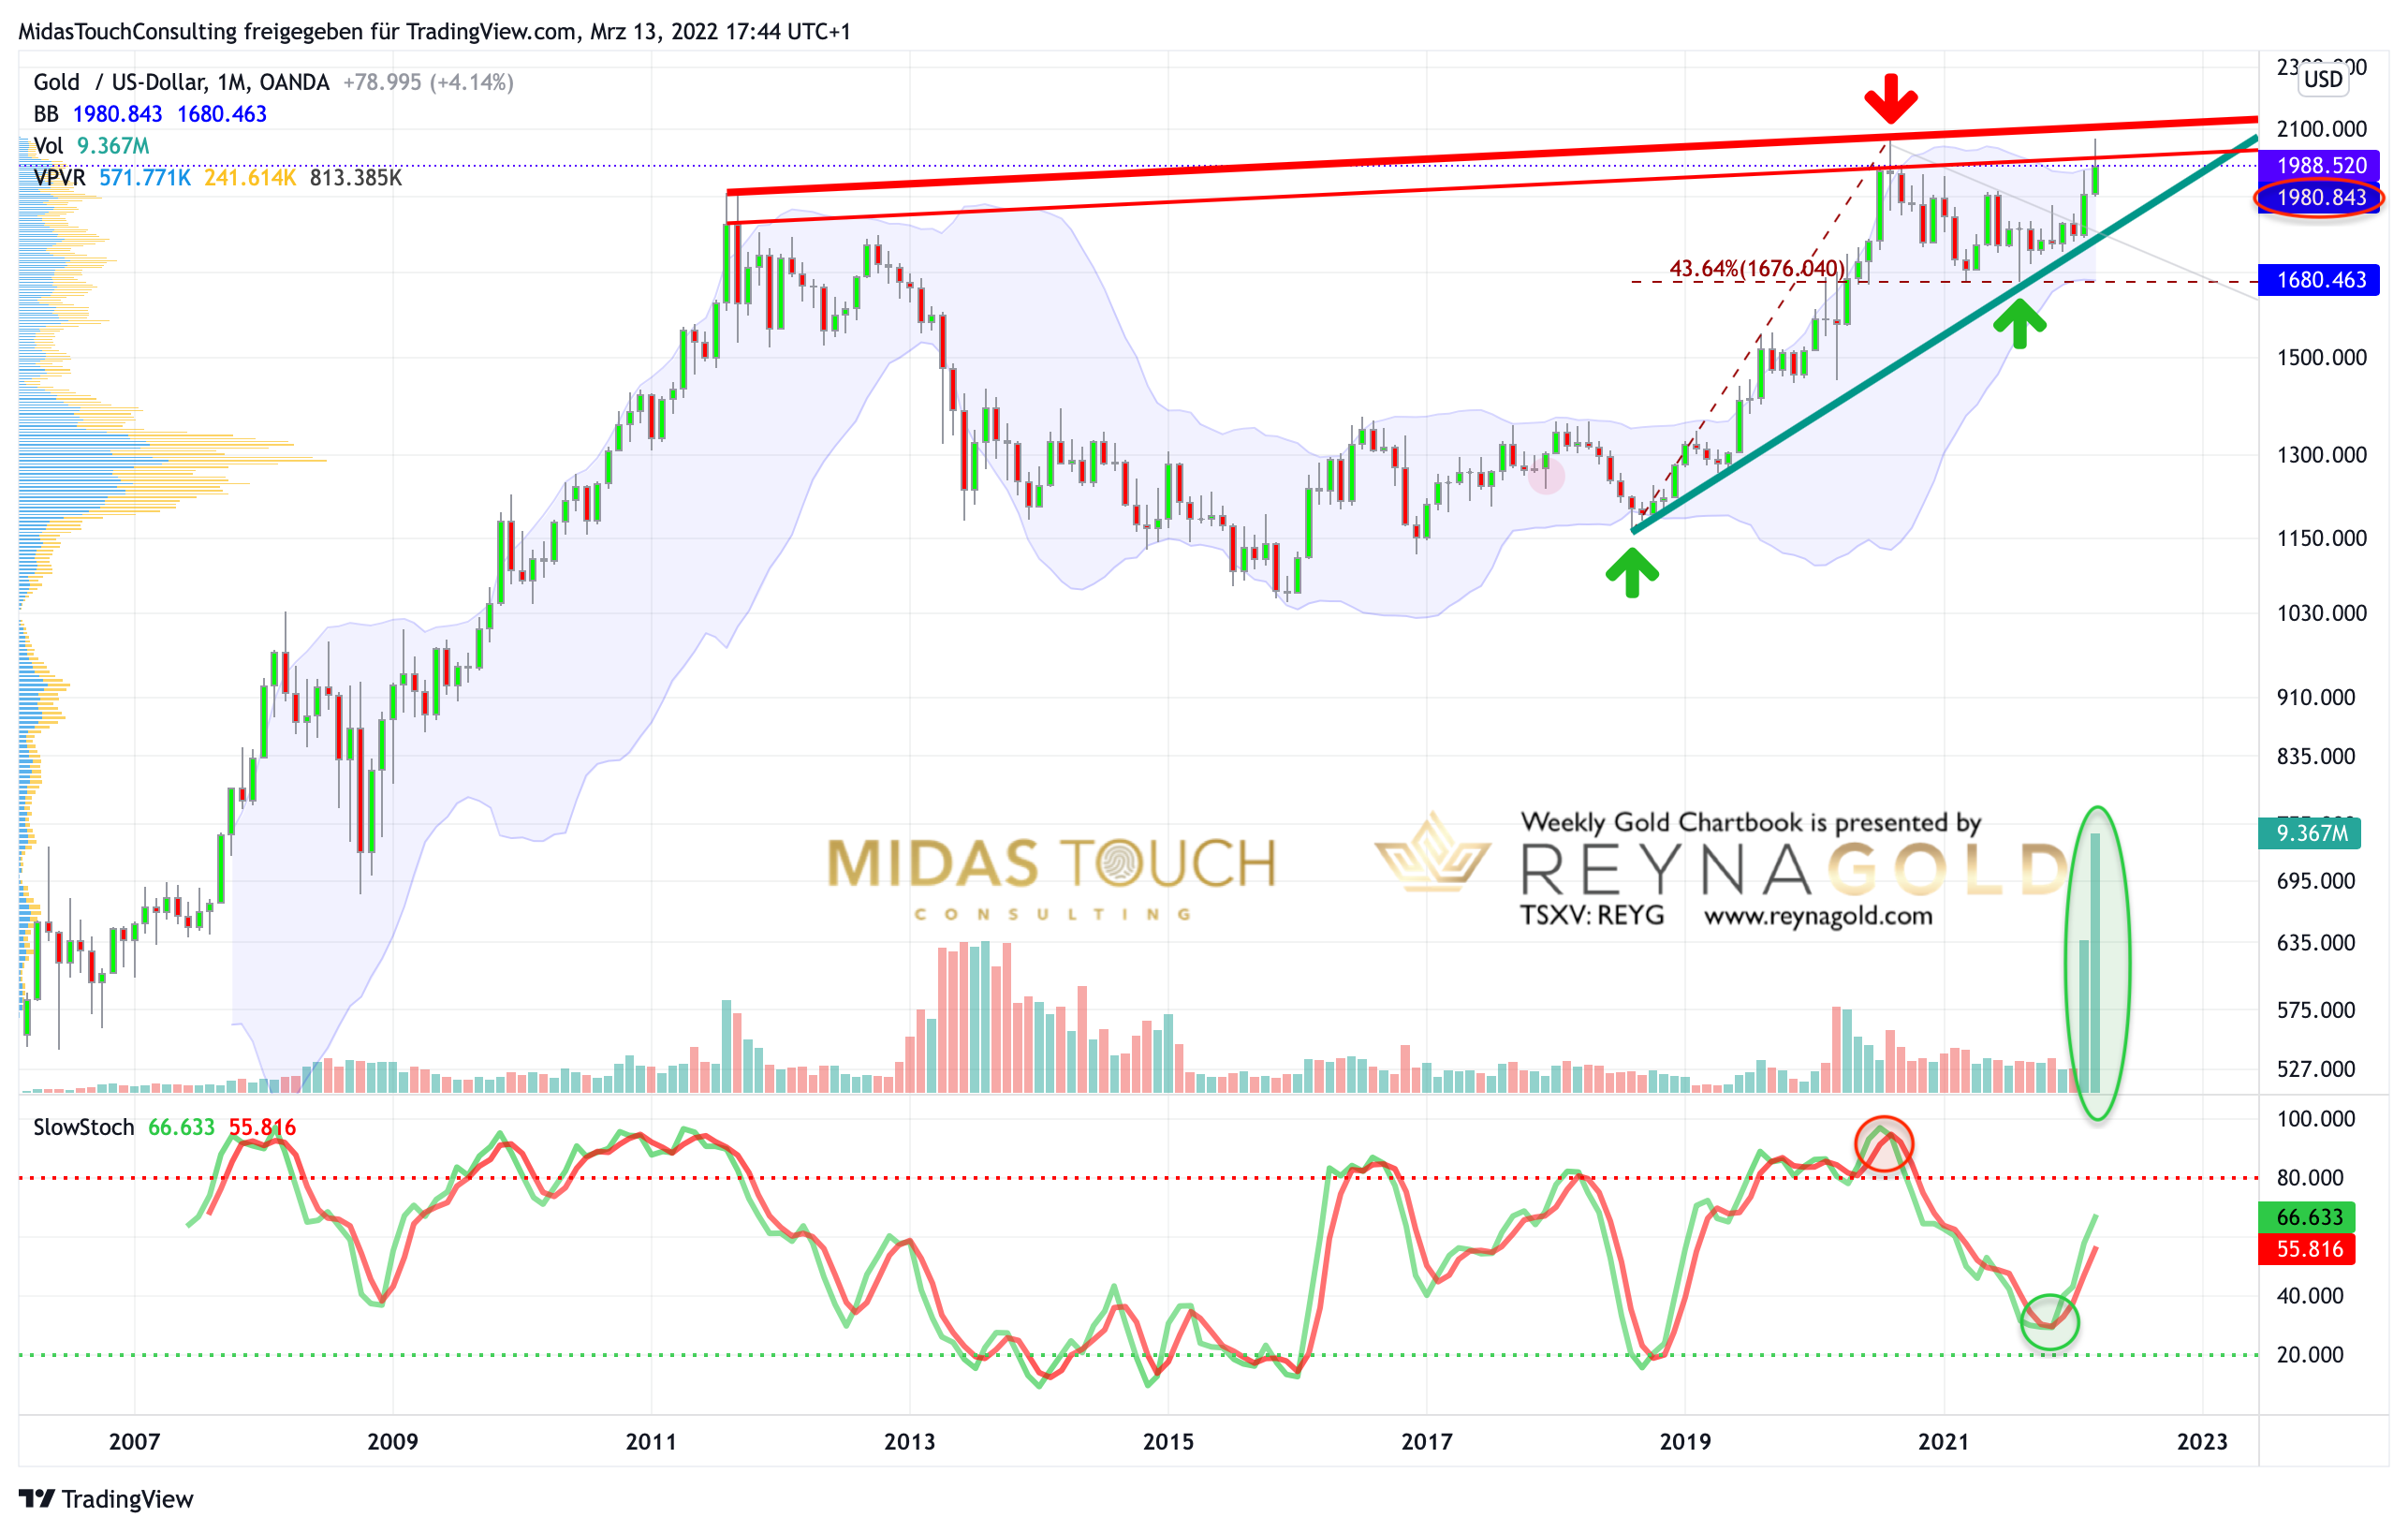 *Gold in US-Dollar, monthly chart as of March 13th, 2022.* Since August 2011, gold has been building a very large cup and handle formation. The most conservatively drawn neckline currently sits at around US$2,100. You could also argue that the whole zone between US$1,900 and US$2,100 is the neckline and once gold will have broken through that resistance zone, the sky will be the limit. The stochastic oscillator has given a clear buy signal on the monthly chart, and recent volume has been dwarfing anything we have seen over the last 25 years! But the monthly Bollinger Band (US$1,980) has so far only allowed a short-lived overshot and is strong resistance, hence any move back above US$2,000 will take an extra effort from the bulls. In total, the monthly chart is bullish and one could argue that the breakout is in full swing. Yet, at the same time the chart indicates massive resistance between US$1,980 and US$2,100. A pullback below the uptrend line, in place since August 2018, at around US$1,800 on the other hand seems unlikely. Hence, gold might consolidate between US1,800 and US$2,100 for some time. ### Gold in US-Dollar, weekly chart as of March 13th, 2022. 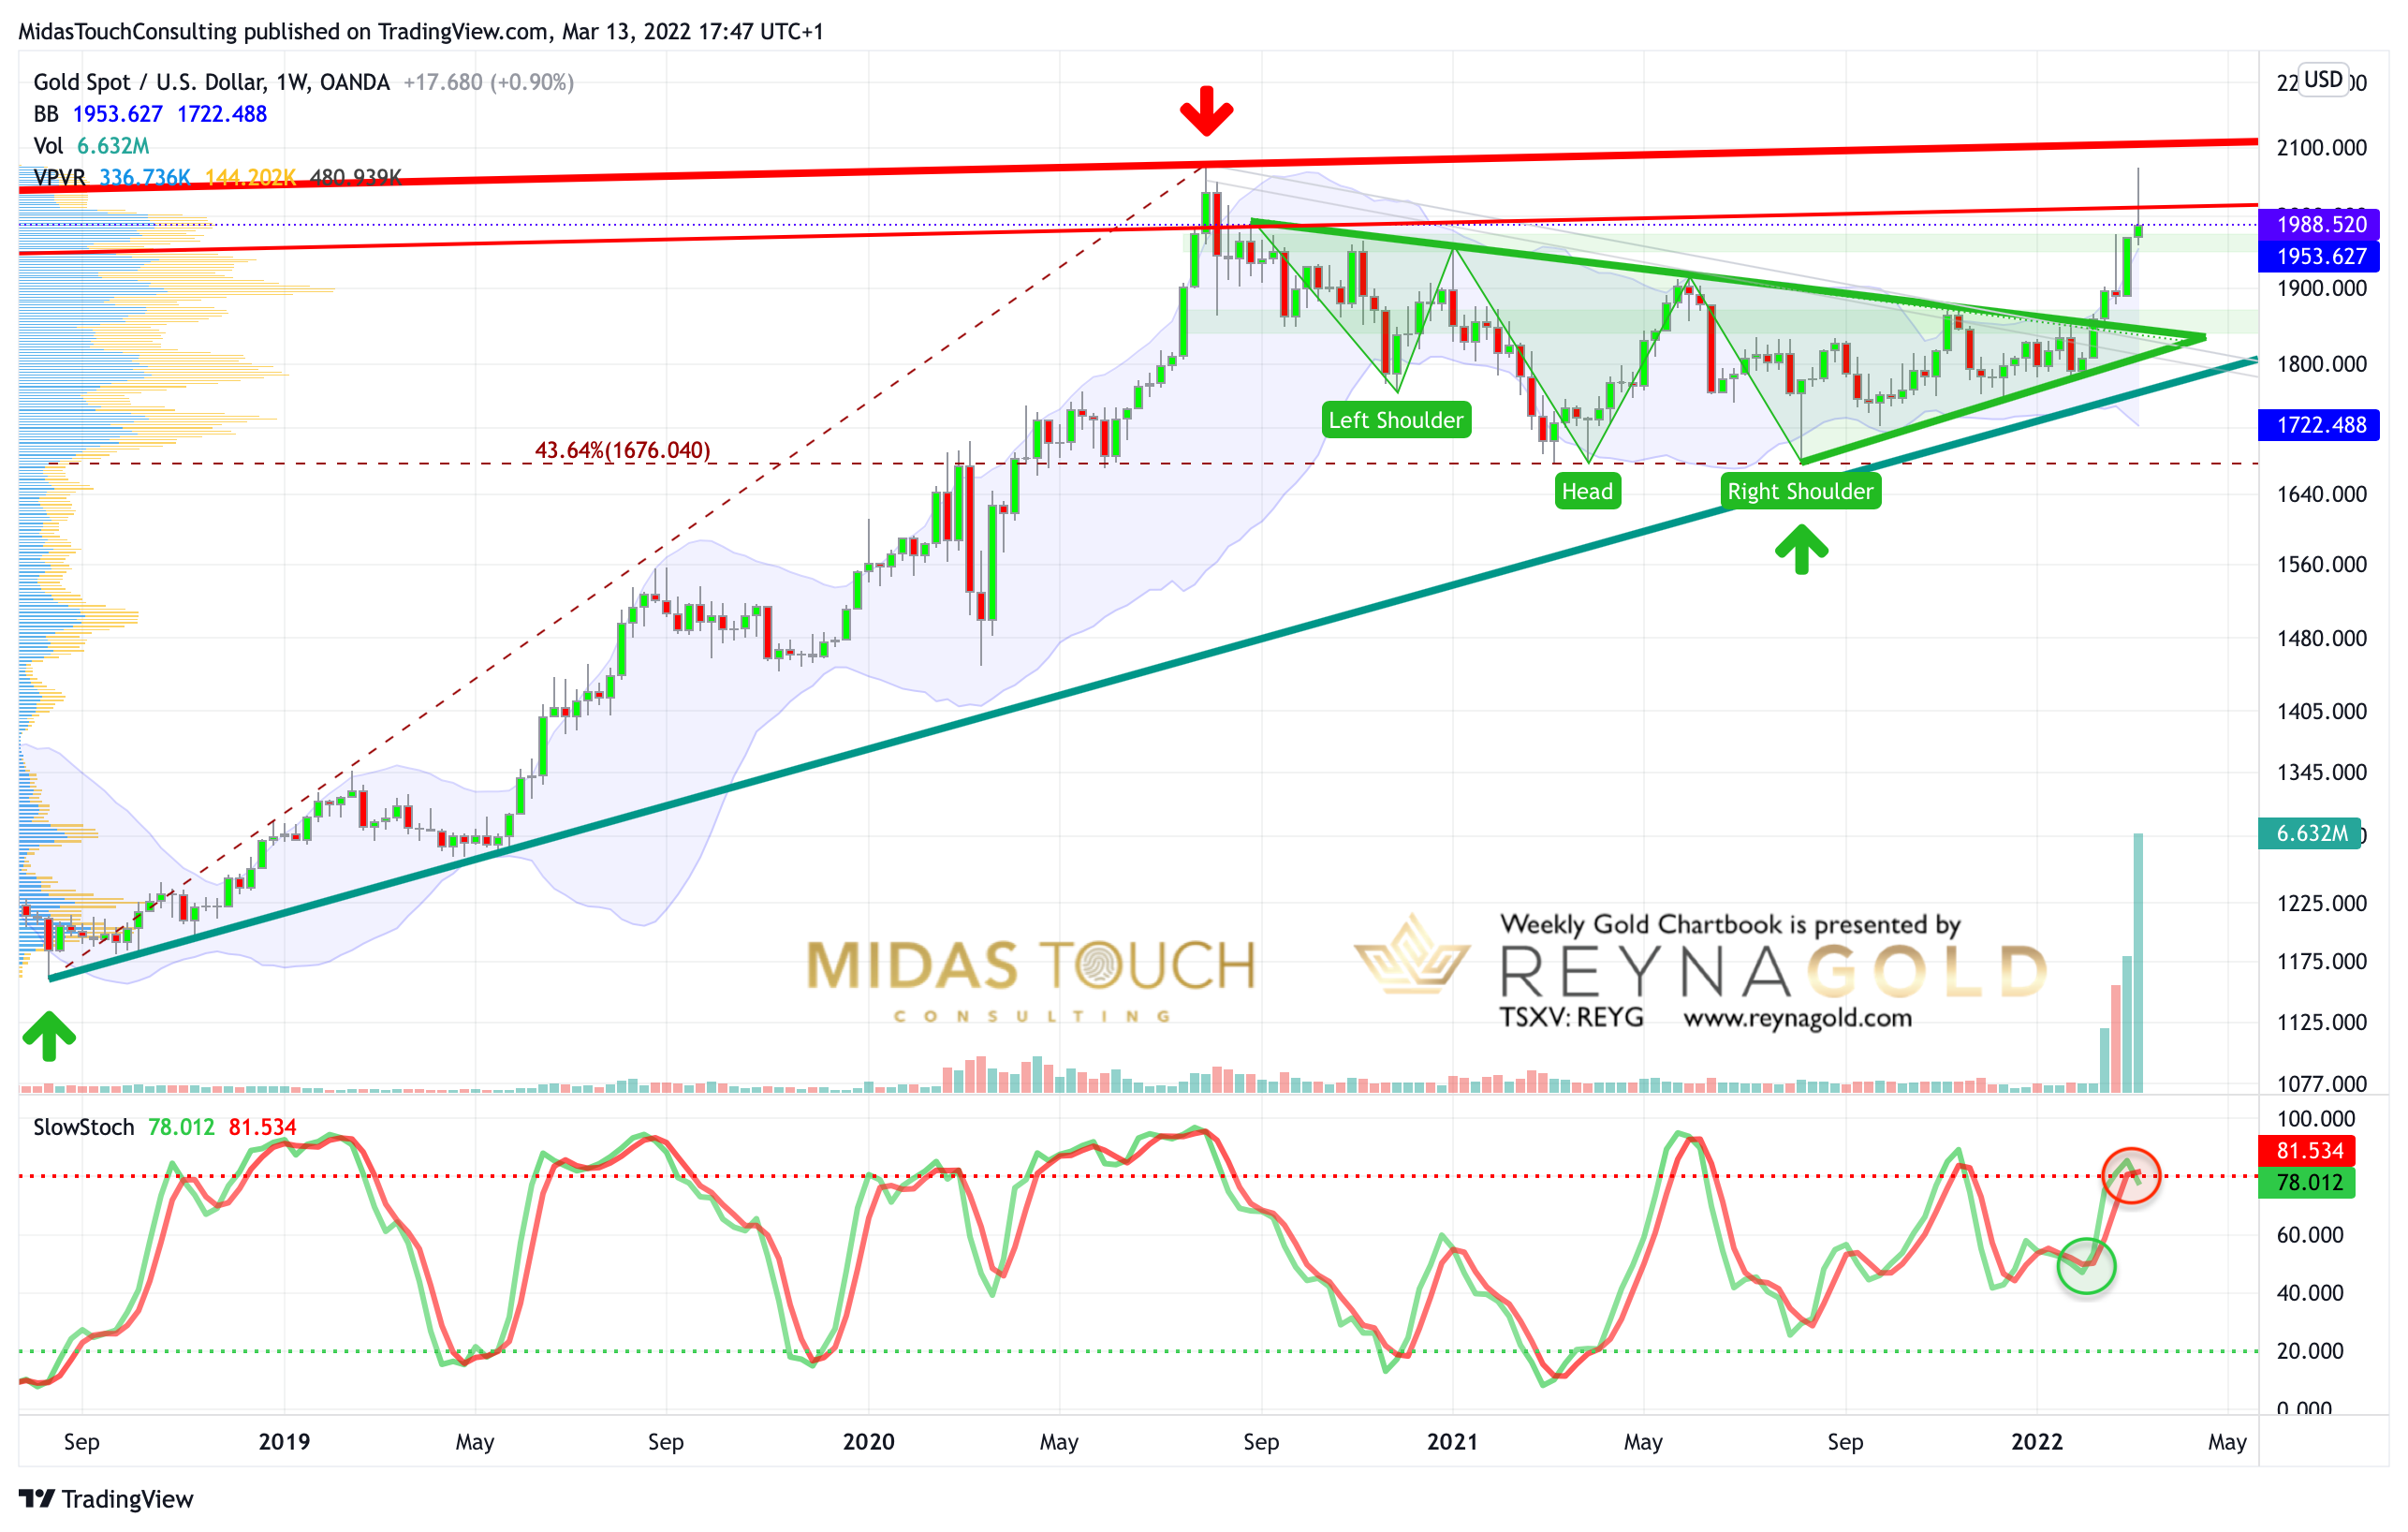 *Gold in US-Dollar, weekly chart as of March 13th, 2022.* On its weekly chart, gold has been pushing trading above the weekly Bollinger Band for the 4th week in a row. Usually, five or six weeks are the maximum that a string trend can stretch these bands. Hence, the air is becoming thinner and thinner for the bulls. As well, the stochastic oscillator has issued a sell signal. Obviously, the uptrend is still intact, but the bulls need to regain the US$2,000 mark rather soon. Otherwise, the overbought setup can easily trigger a larger pullback. A correction back to the neckline of the head and shoulder pattern around US$1,840 would take some time but is not impossible! Overall, the weekly chart is neutral to slightly bullish, but last week’s candle looks like a reversal. Hence, the warning signals are increasing.  ### Gold in US-Dollar, daily chart as of March 13th, 2022. 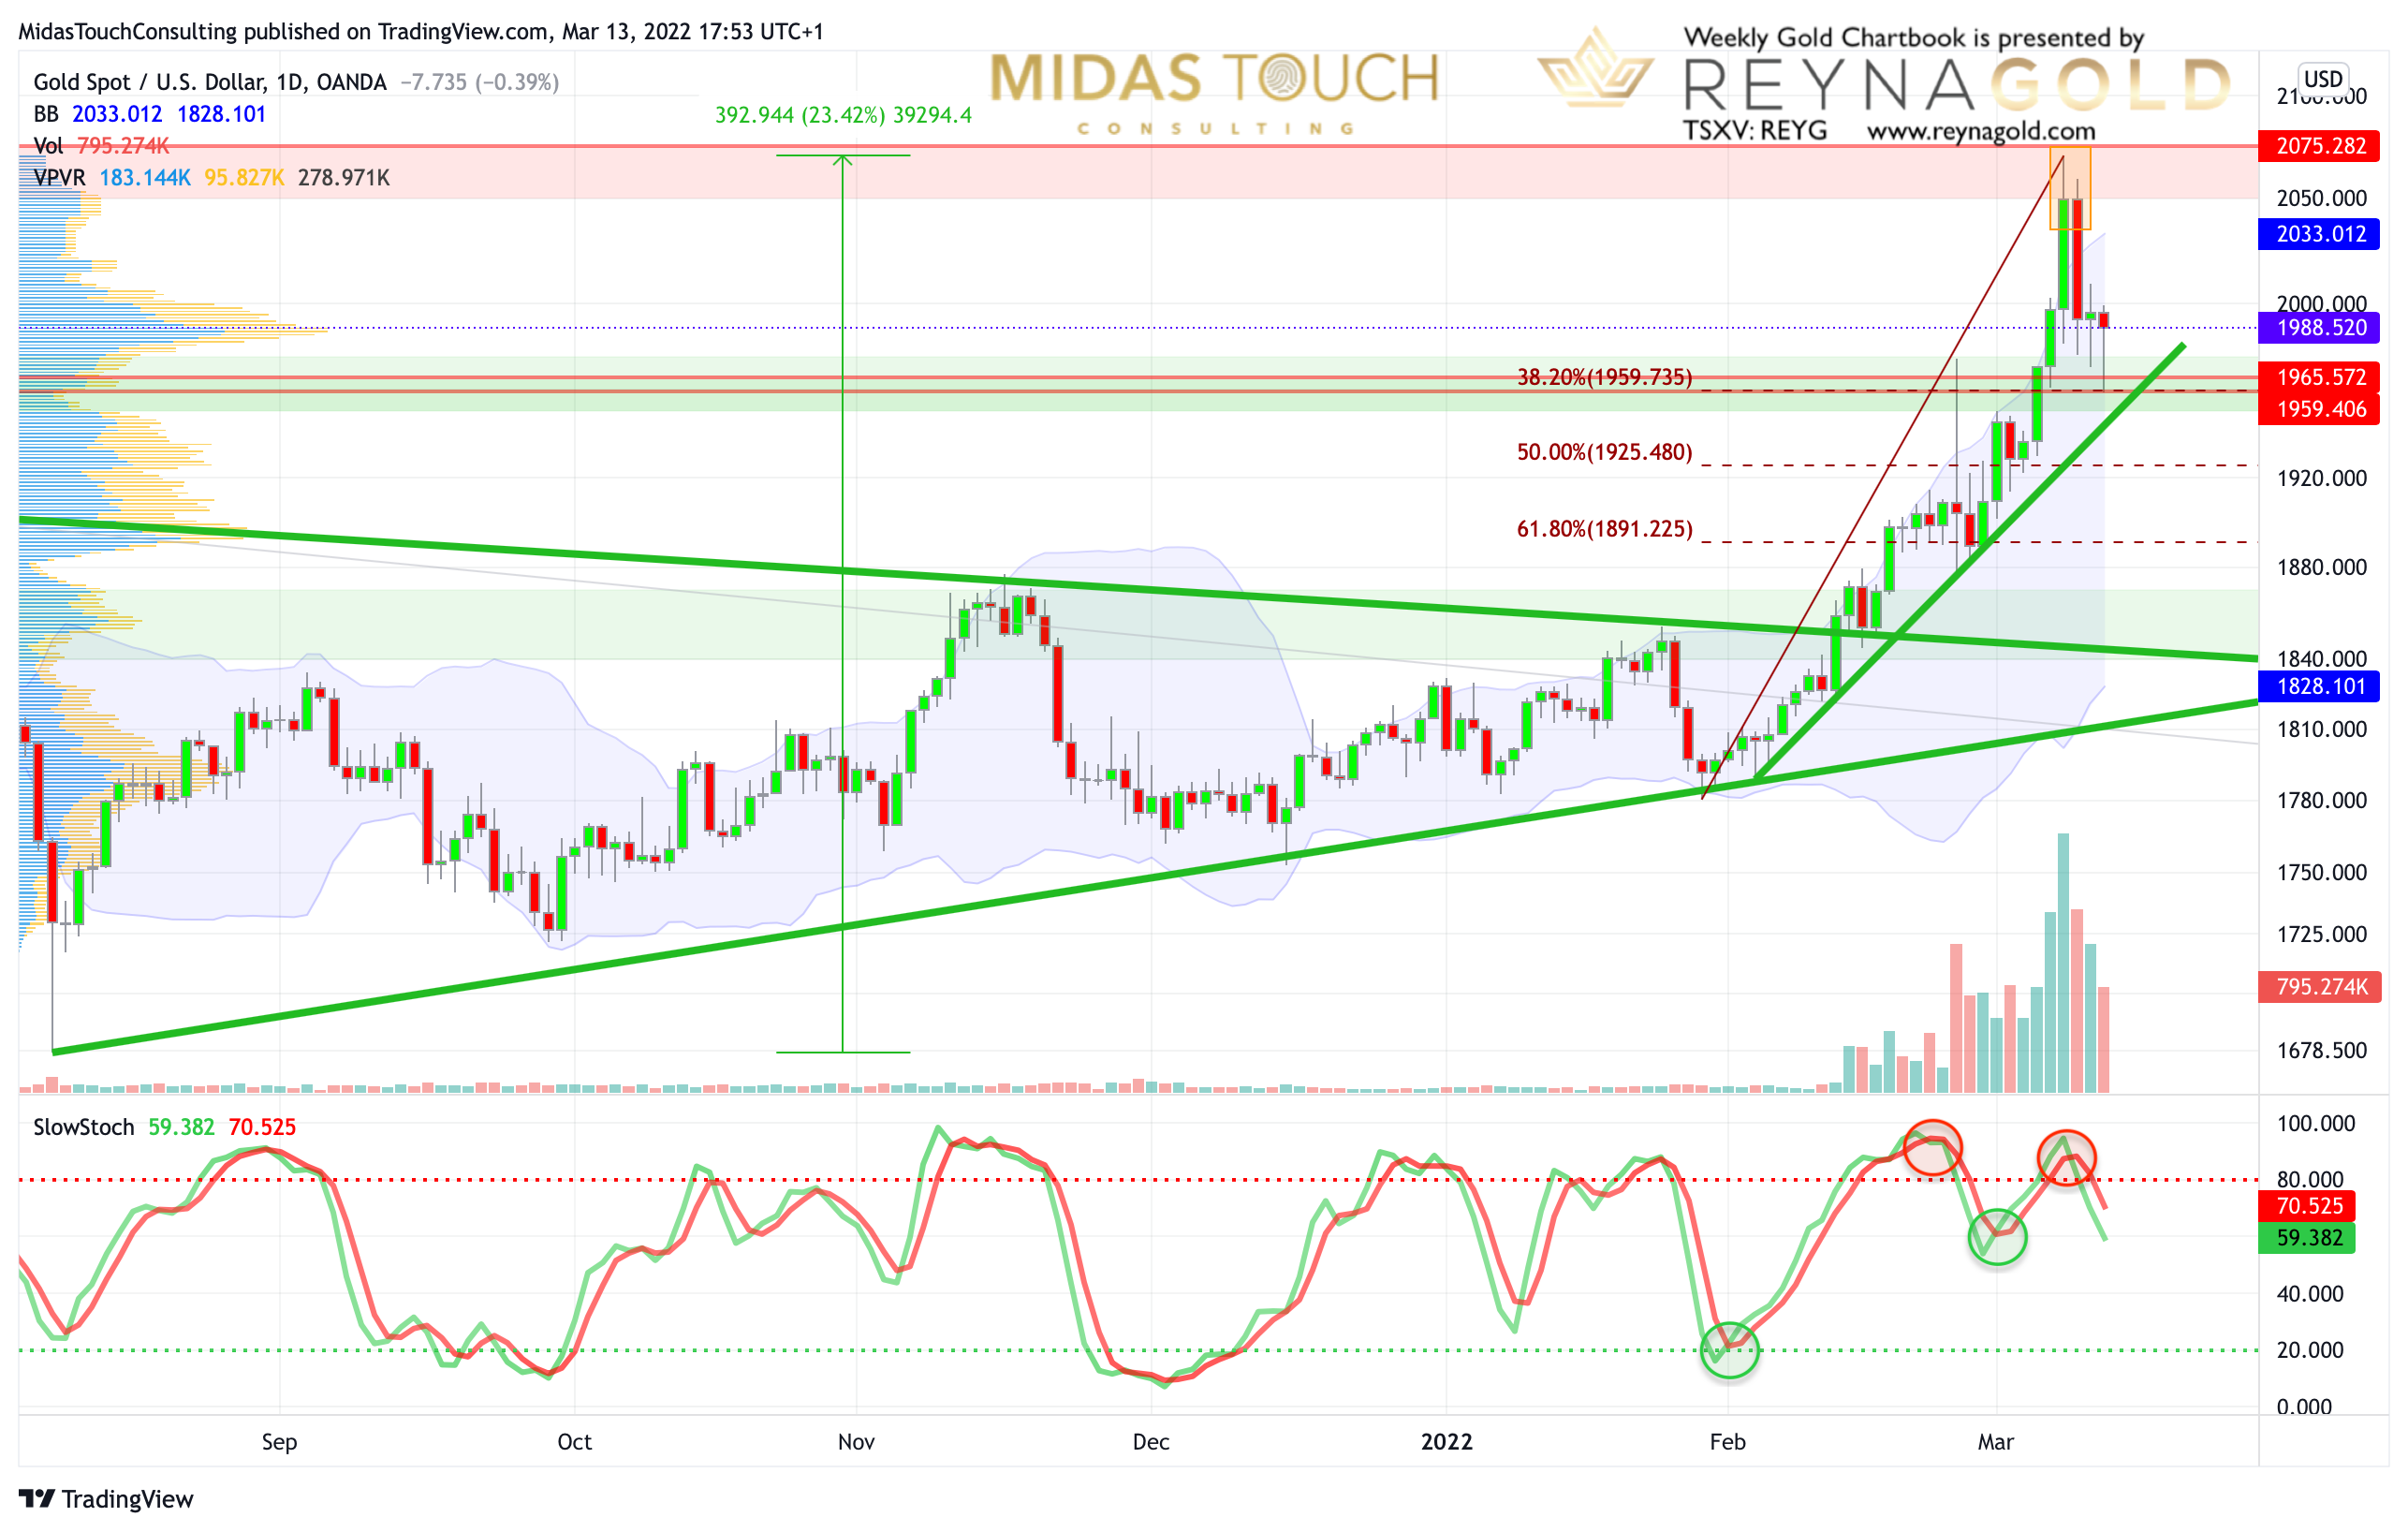 *Gold in US-Dollar, daily chart as of March 13th, 2022.* On the daily chart, gold has gained US$393 or 23.4% since the start of this rally back in August 2021. The steep rise since late January 2022 has delivered a gain of US$290 or 16.3%. The pullback, that started with a big reversal day last Wednesday, has so far exactly retraced 38.2% of the recent rally. Thus, the low on Friday at US$1,958 has brought buyers back into the market. In summary, last week’s price action has a toppy taste and the stochastic oscillator activated a new sell signal. Hence, the strong rally in recent weeks is at risk of transforming into the typical spring top in the gold market. A lower low below Friday’s low at US$1,958 would confirm that the bears have taken over control. ### Gold in US-Dollar, 1-hour chart as of March 13th, 2022. 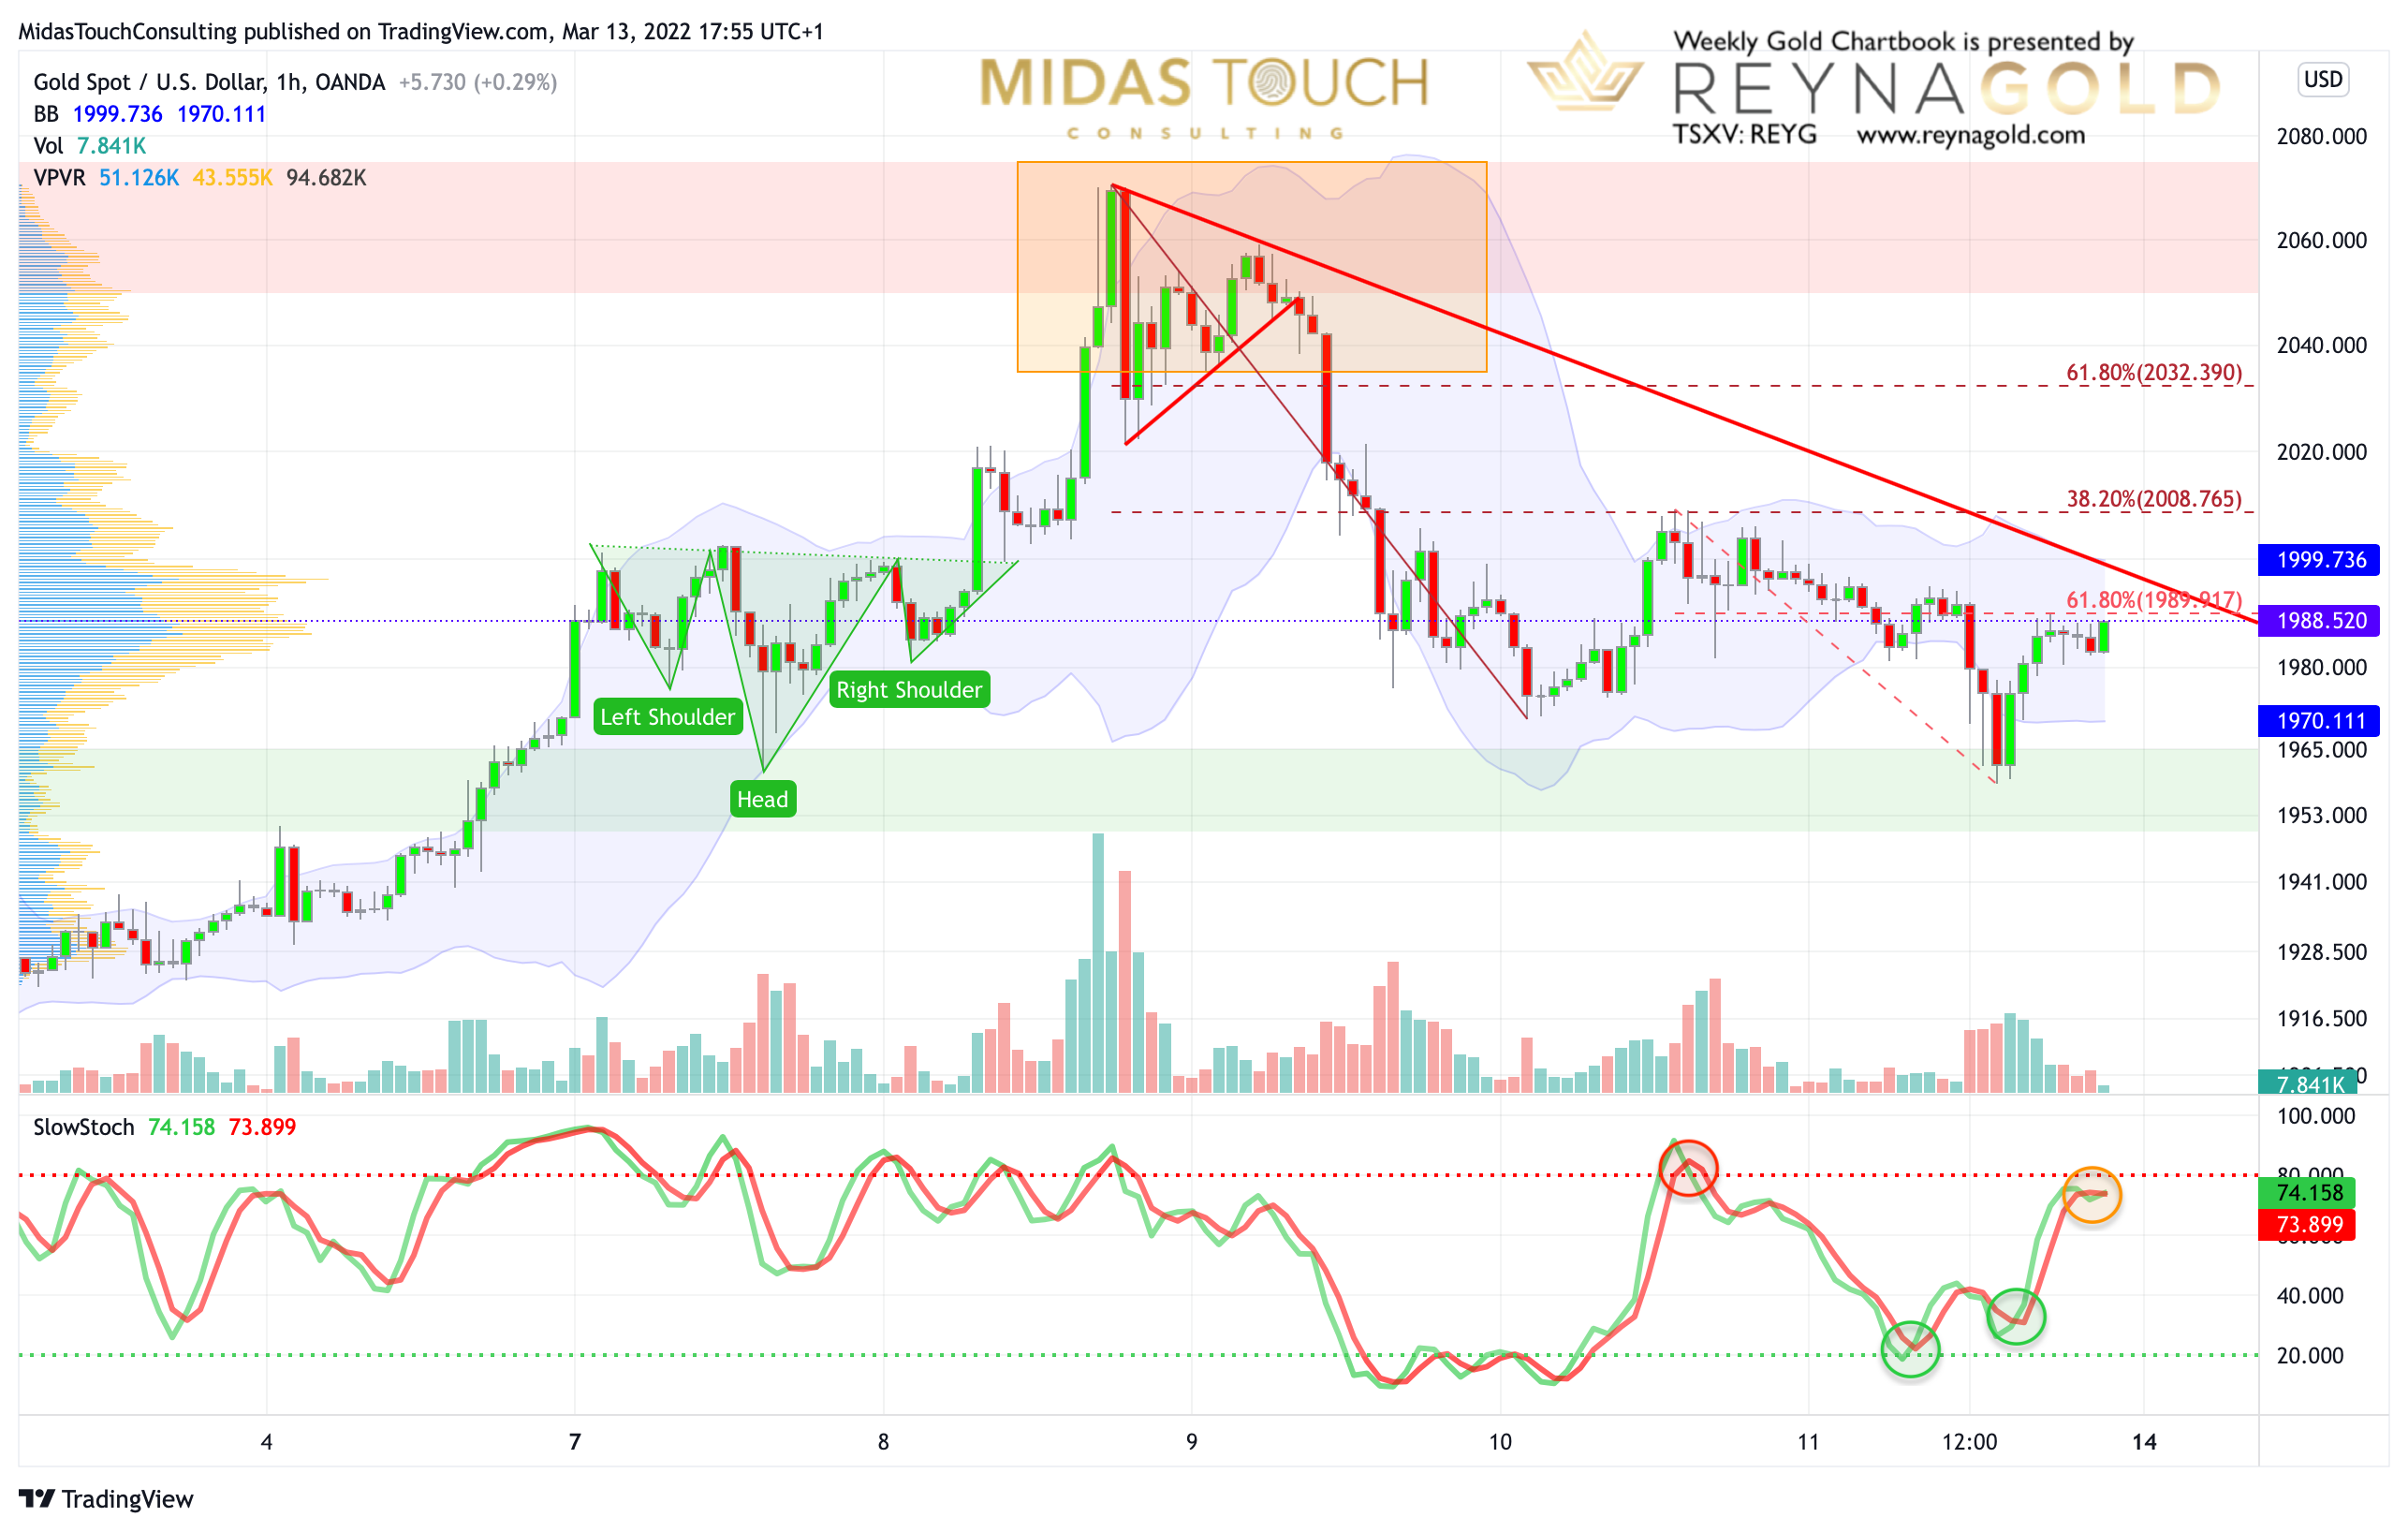 *Gold in US-Dollar, 1-hour chart as of March 13th, 2022.* At this critical juncture, we are zooming further into the price action. The 1-hour chart shows the last 10 days in the gold market. After an initial inverse head and should pattern, the bulls drove gold prices nearly towards the all-time high (US$2,075). But after a brief triangle consolidation, the bears finally came back into the market and managed to push gold nearly $110 lower in two waves. The first bounce failed at the 38.2% retracement at $2,008, while Friday’s sell-off recovered nearly 61.8% (US$1,990) of that 2nd wave down. Hence, if gold wants to continue its bull-run, it has to conquer US$1,990 and US$2,008 urgently. Pretty much in between those two targets, a first bearish downtrend line is waiting that needs to be broken, too. Overall, the microscope analysis on the 1-hour chart clearly shows that gold needs to regain US$2,000 and US$2,030, before we can assume that this rally is not over yet. ### Sentiment – Caution advised 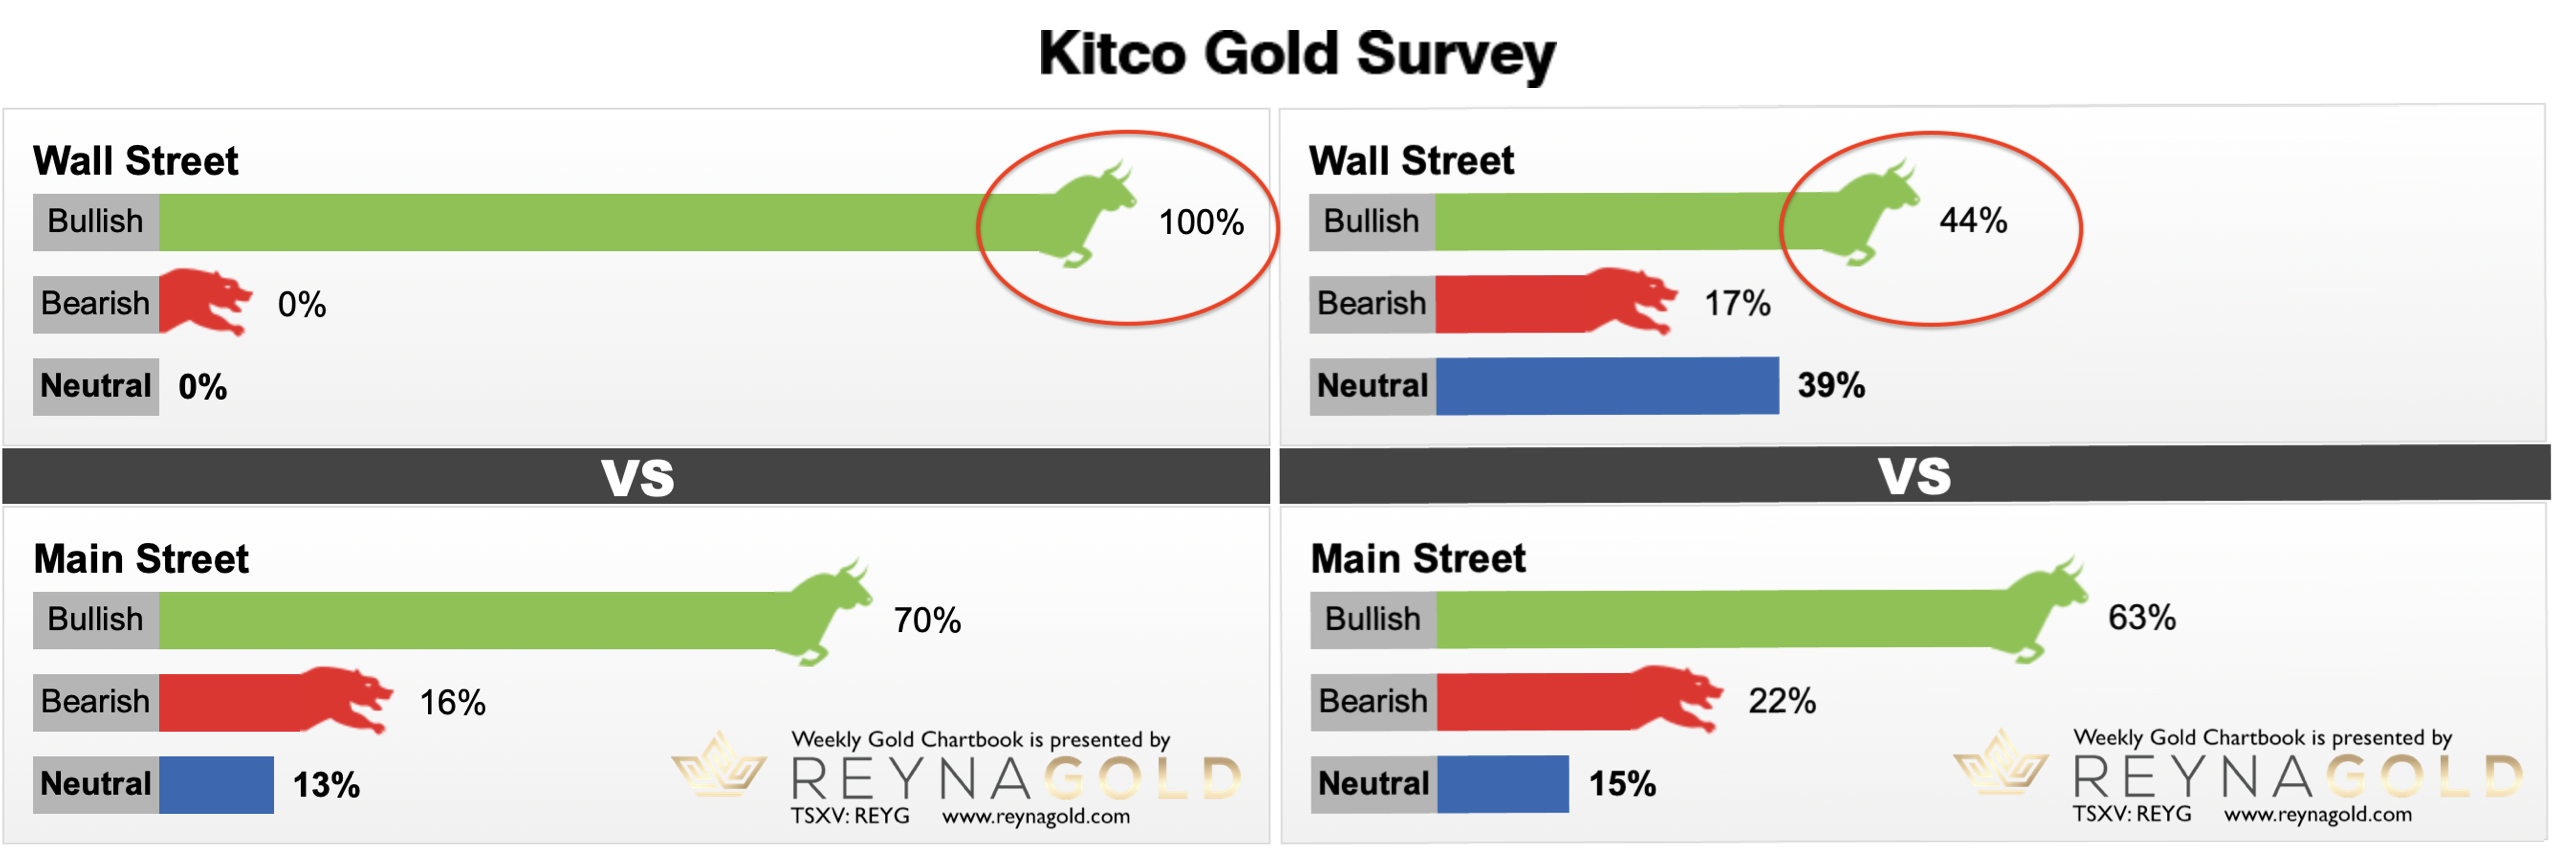 *Kitco Gold Survey as of March 4th, 2022 vs. Kitco Gold Survey as of March 11th, 2022.* Looking at the most recent Kitco Gold Surveys, retail money is still rather bullish. But the professionals have performed a strong U-turn over the last week. As you know, sentiment analysis is the king’s path. You get very few extreme signals per year – usually two to sometimes three. This requires a tremendous amount of patience. And often, only a sharp contrarian mindset will actually see them, let alone act on those rare signals. Obviously, the current reading of the Kitco Gold Survey and the change in expectations among professionals provide a strong warning signal for the bulls! ### Conclusion: Spring correction or further escalation? While the troubling geopolitical developments have somewhat disrupted our roadmap on the upside, the overall price action is in line with our template. From a macroeconomic perspective, the massive and unprecedented sanctions and the resulting imploding Russian economy are certainly deflationary. However, physical gold demand should remain very strong, and commodity prices could continue to explode due to shrinking supply. From a technical perspective, last week looks like a trend reversal, but the bears need to back up their thesis with new lows below US$1,958. Otherwise, the bulls will surely attack again very soon. Another observation that we had already mentioned in one of our last chart-books is the fact, that silver still has not shown up at the ongoing party in the precious metals sector. Gold’s little brother usually comes in just shortly before the peak with a strong outperformance, throwing in a few hit records, only to then crush the party completely. This classic pattern has not been observed so far. If silver were to run towards $30 within a few days, for example, we would become extremely cautious. This typical “top signal” is missing so far. Nevertheless, the risk/reward-ratio for new long trading positions is rather unfavorable, if you plan to hold those paper positions for a few weeks or months. But at the same time, recent developments have once again clearly shown how important long term physical gold and silver holdings indeed are! To summarize, gold is bullish above US$2,030 while bearish below US$1,960. In between those two numbers, it’s hard to come up with a strong bias. _Feel free to join us in our free [Telegram channel](https://t.me/MidasTouchConsulting) for daily real time data and a great community._ _If you like to get regular updates on our gold model, precious metals and cryptocurrencies you can subscribe to our [free newsletter](http://bit.ly/1EUdt2K)._ _This article does not contain investment advice or recommendations. Every investment and trading move involves risk, and readers should conduct their own research when making a decision._ |
| json metadata | {"tags":["silvergoldstackers","steemsilvergold","silver","gold","preciousmetals","trading","investing","exploration"],"image":["https://images.hive.blog/DQmTBjF3wP9cvdKmVDvTAPDoPcpeVGCrugqy1Ub6YEv8NRa/blog-header-gold-reynagold-798x297.jpg","https://images.hive.blog/DQmQQwrPirZsFhpfkwqfgWJAacnTqEiKCgE5oiQ6DB1jzaN/Chart%201%20Gold%20in%20USD%20monthly%20130322.png","https://images.hive.blog/DQmTB4WkCRsnuF6rY188QxuHbA2v3Yj6zz3L5jJwT4ePbKC/Chart%202%20Gold%20in%20USD%20weekly%20130322.png","https://images.hive.blog/DQmbax9GR8h5X7RPKJKdYZMQKnTPsEo6MuzHvsQ5EWZVzu7/2022-01-15%20Why%20Invest%20in%20Reyna%20Gold.png","https://images.hive.blog/DQmbDa8bWWzgMez9JbgxGoikQTJj7p8FvP89Qk9HUEz1cEy/Chart%203%20Gold%20in%20USD%20daily%20130322.png","https://images.hive.blog/DQmVbCUQp3MnYAY8HwTVPvZzDSSGnbeiNk5YZ6tEEMNH5NC/Chart%204%20Gold%20in%20USD%201-hour%20130322.png","https://images.hive.blog/DQmRAoiuXnJC4VDJAgVnTwFgTNWgAVQc1CCDbcU4Kk4eBSr/Chart%205%20Kitco%20Gold%20Surveys%20130322.png"],"links":["https://www.midastouch-consulting.com/gold-chartbook-13032022-spring-correction-or-further-escalation","https://t.me/MidasTouchConsulting","http://bit.ly/1EUdt2K"],"app":"steemit/0.2","format":"markdown"} |
| parent author | |
| parent permlink | silvergoldstackers |
| permlink | march-13th-2022-gold-chartbook-spring-correction-or-further-escalation |
| title | March 13th 2022, Gold Chartbook – Spring correction or further escalation? |
| Transaction Info | Block #62395033/Trx 246549a67554423fb7892fa8ae2e40ef2aa72924 |
View Raw JSON Data
{
"block": 62395033,
"op": [
"comment",
{
"author": "midastouch",
"body": "\n# [March 13th 2022, Gold Chartbook – Spring correction or further escalation?](https://www.midastouch-consulting.com/gold-chartbook-13032022-spring-correction-or-further-escalation) \n\nWhen Gold started to break out of its multi-month triangle in early February, we figured that US$1,975 would be a realistic target. We also stated that a short-lived overshot towards US$2,000 would be a possibility. Little did we know back then about the geopolitical turmoil that unfolded over the last six weeks. The Russian invasion followed by massive sanctions have pushed commodities and gold strongly higher. Even though it appears very challenging to follow your preplanned analysis while at the same remaining an open-minded listener to the markets, we now see a setup where gold has become vulnerable in the short-term. At the same time, the fundamentals have never been more bullish for gold, and it doesn’t take much upside to initiate another run towards the all-time high at US$2,075. Gold – Spring correction or further escalation?\n\nLet’s examine the gold market with a top-down approach.\n\n### Gold in US-Dollar, monthly chart as of March 13th, 2022.\n\n*Gold in US-Dollar, monthly chart as of March 13th, 2022.*\n\nSince August 2011, gold has been building a very large cup and handle formation. The most conservatively drawn neckline currently sits at around US$2,100. You could also argue that the whole zone between US$1,900 and US$2,100 is the neckline and once gold will have broken through that resistance zone, the sky will be the limit. The stochastic oscillator has given a clear buy signal on the monthly chart, and recent volume has been dwarfing anything we have seen over the last 25 years! But the monthly Bollinger Band (US$1,980) has so far only allowed a short-lived overshot and is strong resistance, hence any move back above US$2,000 will take an extra effort from the bulls.\n\nIn total, the monthly chart is bullish and one could argue that the breakout is in full swing. Yet, at the same time the chart indicates massive resistance between US$1,980 and US$2,100. A pullback below the uptrend line, in place since August 2018, at around US$1,800 on the other hand seems unlikely. Hence, gold might consolidate between US1,800 and US$2,100 for some time.\n\n### Gold in US-Dollar, weekly chart as of March 13th, 2022.\n\n*Gold in US-Dollar, weekly chart as of March 13th, 2022.*\n\nOn its weekly chart, gold has been pushing trading above the weekly Bollinger Band for the 4th week in a row. Usually, five or six weeks are the maximum that a string trend can stretch these bands. Hence, the air is becoming thinner and thinner for the bulls. As well, the stochastic oscillator has issued a sell signal.\n\nObviously, the uptrend is still intact, but the bulls need to regain the US$2,000 mark rather soon. Otherwise, the overbought setup can easily trigger a larger pullback. A correction back to the neckline of the head and shoulder pattern around US$1,840 would take some time but is not impossible!\n\nOverall, the weekly chart is neutral to slightly bullish, but last week’s candle looks like a reversal. Hence, the warning signals are increasing.\n\n \n\n\n### Gold in US-Dollar, daily chart as of March 13th, 2022.\n\n*Gold in US-Dollar, daily chart as of March 13th, 2022.*\n\nOn the daily chart, gold has gained US$393 or 23.4% since the start of this rally back in August 2021. The steep rise since late January 2022 has delivered a gain of US$290 or 16.3%. The pullback, that started with a big reversal day last Wednesday, has so far exactly retraced 38.2% of the recent rally. Thus, the low on Friday at US$1,958 has brought buyers back into the market.\n\nIn summary, last week’s price action has a toppy taste and the stochastic oscillator activated a new sell signal. Hence, the strong rally in recent weeks is at risk of transforming into the typical spring top in the gold market. A lower low below Friday’s low at US$1,958 would confirm that the bears have taken over control.\n\n### Gold in US-Dollar, 1-hour chart as of March 13th, 2022.\n\n*Gold in US-Dollar, 1-hour chart as of March 13th, 2022.*\n\nAt this critical juncture, we are zooming further into the price action. The 1-hour chart shows the last 10 days in the gold market. After an initial inverse head and should pattern, the bulls drove gold prices nearly towards the all-time high (US$2,075). But after a brief triangle consolidation, the bears finally came back into the market and managed to push gold nearly $110 lower in two waves. The first bounce failed at the 38.2% retracement at $2,008, while Friday’s sell-off recovered nearly 61.8% (US$1,990) of that 2nd wave down.\n\nHence, if gold wants to continue its bull-run, it has to conquer US$1,990 and US$2,008 urgently. Pretty much in between those two targets, a first bearish downtrend line is waiting that needs to be broken, too.\n\nOverall, the microscope analysis on the 1-hour chart clearly shows that gold needs to regain US$2,000 and US$2,030, before we can assume that this rally is not over yet.\n\n### Sentiment – Caution advised\n\n*Kitco Gold Survey as of March 4th, 2022 vs. Kitco Gold Survey as of March 11th, 2022.*\n\nLooking at the most recent Kitco Gold Surveys, retail money is still rather bullish. But the professionals have performed a strong U-turn over the last week. As you know, sentiment analysis is the king’s path. You get very few extreme signals per year – usually two to sometimes three. This requires a tremendous amount of patience. And often, only a sharp contrarian mindset will actually see them, let alone act on those rare signals.\n\nObviously, the current reading of the Kitco Gold Survey and the change in expectations among professionals provide a strong warning signal for the bulls!\n\n### Conclusion: Spring correction or further escalation?\n\nWhile the troubling geopolitical developments have somewhat disrupted our roadmap on the upside, the overall price action is in line with our template. From a macroeconomic perspective, the massive and unprecedented sanctions and the resulting imploding Russian economy are certainly deflationary. However, physical gold demand should remain very strong, and commodity prices could continue to explode due to shrinking supply.\n\nFrom a technical perspective, last week looks like a trend reversal, but the bears need to back up their thesis with new lows below US$1,958. Otherwise, the bulls will surely attack again very soon.\n\nAnother observation that we had already mentioned in one of our last chart-books is the fact, that silver still has not shown up at the ongoing party in the precious metals sector. Gold’s little brother usually comes in just shortly before the peak with a strong outperformance, throwing in a few hit records, only to then crush the party completely. This classic pattern has not been observed so far. If silver were to run towards $30 within a few days, for example, we would become extremely cautious. This typical “top signal” is missing so far.\n\nNevertheless, the risk/reward-ratio for new long trading positions is rather unfavorable, if you plan to hold those paper positions for a few weeks or months. But at the same time, recent developments have once again clearly shown how important long term physical gold and silver holdings indeed are!\n\nTo summarize, gold is bullish above US$2,030 while bearish below US$1,960. In between those two numbers, it’s hard to come up with a strong bias.\n\n_Feel free to join us in our free [Telegram channel](https://t.me/MidasTouchConsulting) for daily real time data and a great community._ \n\n_If you like to get regular updates on our gold model, precious metals and cryptocurrencies you can subscribe to our [free newsletter](http://bit.ly/1EUdt2K)._ \n\n_This article does not contain investment advice or recommendations. Every investment and trading move involves risk, and readers should conduct their own research when making a decision._",
"json_metadata": "{\"tags\":[\"silvergoldstackers\",\"steemsilvergold\",\"silver\",\"gold\",\"preciousmetals\",\"trading\",\"investing\",\"exploration\"],\"image\":[\"https://images.hive.blog/DQmTBjF3wP9cvdKmVDvTAPDoPcpeVGCrugqy1Ub6YEv8NRa/blog-header-gold-reynagold-798x297.jpg\",\"https://images.hive.blog/DQmQQwrPirZsFhpfkwqfgWJAacnTqEiKCgE5oiQ6DB1jzaN/Chart%201%20Gold%20in%20USD%20monthly%20130322.png\",\"https://images.hive.blog/DQmTB4WkCRsnuF6rY188QxuHbA2v3Yj6zz3L5jJwT4ePbKC/Chart%202%20Gold%20in%20USD%20weekly%20130322.png\",\"https://images.hive.blog/DQmbax9GR8h5X7RPKJKdYZMQKnTPsEo6MuzHvsQ5EWZVzu7/2022-01-15%20Why%20Invest%20in%20Reyna%20Gold.png\",\"https://images.hive.blog/DQmbDa8bWWzgMez9JbgxGoikQTJj7p8FvP89Qk9HUEz1cEy/Chart%203%20Gold%20in%20USD%20daily%20130322.png\",\"https://images.hive.blog/DQmVbCUQp3MnYAY8HwTVPvZzDSSGnbeiNk5YZ6tEEMNH5NC/Chart%204%20Gold%20in%20USD%201-hour%20130322.png\",\"https://images.hive.blog/DQmRAoiuXnJC4VDJAgVnTwFgTNWgAVQc1CCDbcU4Kk4eBSr/Chart%205%20Kitco%20Gold%20Surveys%20130322.png\"],\"links\":[\"https://www.midastouch-consulting.com/gold-chartbook-13032022-spring-correction-or-further-escalation\",\"https://t.me/MidasTouchConsulting\",\"http://bit.ly/1EUdt2K\"],\"app\":\"steemit/0.2\",\"format\":\"markdown\"}",
"parent_author": "",
"parent_permlink": "silvergoldstackers",
"permlink": "march-13th-2022-gold-chartbook-spring-correction-or-further-escalation",
"title": "March 13th 2022, Gold Chartbook – Spring correction or further escalation?"
}
],
"op_in_trx": 0,
"timestamp": "2022-03-13T20:48:33",
"trx_id": "246549a67554423fb7892fa8ae2e40ef2aa72924",
"trx_in_block": 2,
"virtual_op": 0
}Manabar
Voting Power100.00%
Downvote Power100.00%
Resource Credits100.00%
Reputation Progress95.22%
{
  "voting_manabar": {
    "current_mana": "10384941213",
    "last_update_time": 1687282050
  },
  "downvote_manabar": {
    "current_mana": 2649219697,
    "last_update_time": 1687282050
  },
  "rc_account": {
    "account": "midastouch",
    "max_rc": "12617627762",
    "max_rc_creation_adjustment": {
      "amount": "2020748973",
      "nai": "@@000000037",
      "precision": 6
    },
    "rc_manabar": {
      "current_mana": "5106882614",
      "last_update_time": 1687282050
    }
  }
}
Account Metadata
| POSTING JSON METADATA | |
| profile | {"name":"MidasTouchConsulting","location":"Munich","about":"Our mission is to help investor and traders to become profitable & wealthy","website":"https://www.midastouch-consulting.com","cover_image":"https://cdn.steemitimages.com/DQmWE9M5BHdDJYiSU9SXgJsQ6FxpXZPAeEpMaSuc3B38TsS/Bitcoin%20&%20Gold.jpg","profile_image":"https://postimg.org/image/eqeafo8d7/","version":2} |
| JSON METADATA | |
| profile | {"name":"MidasTouchConsulting","location":"Munich","about":"Our mission is to help investor and traders to become profitable & wealthy","website":"https://www.midastouch-consulting.com","cover_image":"https://www.midastouch-consulting.com/wp-content/uploads/2018/03/midas-touch-share-motiv-f.jpg","profile_image":"https://postimg.org/image/eqeafo8d7/"} |
{
  "posting_json_metadata": {
    "profile": {
      "name": "MidasTouchConsulting",
      "location": "Munich",
      "about": "Our mission is to help investor and traders to become profitable & wealthy",
      "website": "https://www.midastouch-consulting.com",
      "cover_image": "https://cdn.steemitimages.com/DQmWE9M5BHdDJYiSU9SXgJsQ6FxpXZPAeEpMaSuc3B38TsS/Bitcoin%20&%20Gold.jpg",
      "profile_image": "https://postimg.org/image/eqeafo8d7/",
      "version": 2
    }
  },
  "json_metadata": {
    "profile": {
      "name": "MidasTouchConsulting",
      "location": "Munich",
      "about": "Our mission is to help investor and traders to become profitable & wealthy",
      "website": "https://www.midastouch-consulting.com",
      "cover_image": "https://www.midastouch-consulting.com/wp-content/uploads/2018/03/midas-touch-share-motiv-f.jpg",
      "profile_image": "https://postimg.org/image/eqeafo8d7/"
    }
  }
}
Auth Keys
Owner
Single Signature
Public Keys
STM7qnW5aLRaEC478SV8q51qPdzFUxMCAHZ7dq1Da2tDrxRhRYPsD1/1
Active
Single Signature
Public Keys
STM6nErtHyDKMfNTQm9zHwZhKZaY6jx73HvWZGa528E2GeGotLU4n1/1
Posting
Single Signature
Public Keys
STM5ZjdDXzNP35hTAdWW1vRdavFQLbnV5bg4rXkgjPS65tBz2bR2y1/1
Memo
STM6nXES3DY2mv1C44ZqstuL9sqTH16i2gUWqc1p3YJboT3s7oTLm
{
  "owner": {
    "account_auths": [],
    "key_auths": [
      [
        "STM7qnW5aLRaEC478SV8q51qPdzFUxMCAHZ7dq1Da2tDrxRhRYPsD",
        1
      ]
    ],
    "weight_threshold": 1
  },
  "active": {
    "account_auths": [],
    "key_auths": [
      [
        "STM6nErtHyDKMfNTQm9zHwZhKZaY6jx73HvWZGa528E2GeGotLU4n",
        1
      ]
    ],
    "weight_threshold": 1
  },
  "posting": {
    "account_auths": [],
    "key_auths": [
      [
        "STM5ZjdDXzNP35hTAdWW1vRdavFQLbnV5bg4rXkgjPS65tBz2bR2y",
        1
      ]
    ],
    "weight_threshold": 1
  },
  "memo": "STM6nXES3DY2mv1C44ZqstuL9sqTH16i2gUWqc1p3YJboT3s7oTLm"
}
Witness Votes
0 / 30
No active witness votes.
[]