VOTING POWER100.00%
DOWNVOTE POWER100.00%
RESOURCE CREDITS100.00%
REPUTATION PROGRESS0.00%
Net Worth
0.037USD
STEEM
0.000STEEM
SBD
0.000SBD
Effective Power
5.007SP
├── Own SP
0.631SP
└── Incoming DelegationsDeleg
+4.376SP
Detailed Balance
| STEEM | ||
| balance | 0.000STEEM | STEEM |
| market_balance | 0.000STEEM | STEEM |
| savings_balance | 0.000STEEM | STEEM |
| reward_steem_balance | 0.000STEEM | STEEM |
| STEEM POWER | ||
| Own SP | 0.631SP | SP |
| Delegated Out | 0.000SP | SP |
| Delegation In | 4.376SP | SP |
| Effective Power | 5.007SP | SP |
| Reward SP (pending) | 0.000SP | SP |
| SBD | ||
| sbd_balance | 0.000SBD | SBD |
| sbd_conversions | 0.000SBD | SBD |
| sbd_market_balance | 0.000SBD | SBD |
| savings_sbd_balance | 0.000SBD | SBD |
| reward_sbd_balance | 0.000SBD | SBD |
{
  "balance": "0.000 STEEM",
  "savings_balance": "0.000 STEEM",
  "reward_steem_balance": "0.000 STEEM",
  "vesting_shares": "1027.013288 VESTS",
  "delegated_vesting_shares": "0.000000 VESTS",
  "received_vesting_shares": "7116.646518 VESTS",
  "sbd_balance": "0.000 SBD",
  "savings_sbd_balance": "0.000 SBD",
  "reward_sbd_balance": "0.000 SBD",
  "conversions": []
}
Account Info
| name | vanddar4 |
| id | 449084 |
| rank | 1,325,500 |
| reputation | 179281042 |
| created | 2017-11-15T04:07:48 |
| recovery_account | steem |
| proxy | None |
| post_count | 29 |
| comment_count | 0 |
| lifetime_vote_count | 0 |
| witnesses_voted_for | 0 |
| last_post | 2018-08-29T21:40:36 |
| last_root_post | 2018-08-29T21:40:36 |
| last_vote_time | 2018-06-12T23:09:12 |
| proxied_vsf_votes | 0, 0, 0, 0 |
| can_vote | 1 |
| voting_power | 0 |
| delayed_votes | 0 |
| balance | 0.000 STEEM |
| savings_balance | 0.000 STEEM |
| sbd_balance | 0.000 SBD |
| savings_sbd_balance | 0.000 SBD |
| vesting_shares | 1027.013288 VESTS |
| delegated_vesting_shares | 0.000000 VESTS |
| received_vesting_shares | 7116.646518 VESTS |
| reward_vesting_balance | 0.000000 VESTS |
| vesting_balance | 0.000 STEEM |
| vesting_withdraw_rate | 0.000000 VESTS |
| next_vesting_withdrawal | 1969-12-31T23:59:59 |
| withdrawn | 0 |
| to_withdraw | 0 |
| withdraw_routes | 0 |
| savings_withdraw_requests | 0 |
| last_account_recovery | 1970-01-01T00:00:00 |
| reset_account | null |
| last_owner_update | 1970-01-01T00:00:00 |
| last_account_update | 1970-01-01T00:00:00 |
| mined | No |
| sbd_seconds | 0 |
| sbd_last_interest_payment | 1970-01-01T00:00:00 |
| savings_sbd_last_interest_payment | 1970-01-01T00:00:00 |
{
  "active": {
    "account_auths": [],
    "key_auths": [
      [
        "STM5E81NHdyv7Eq93nysTkr6q7xwVbjYMxc6EjpoC6YqJkVLVZk9c",
        1
      ]
    ],
    "weight_threshold": 1
  },
  "balance": "0.000 STEEM",
  "can_vote": true,
  "comment_count": 0,
  "created": "2017-11-15T04:07:48",
  "curation_rewards": 0,
  "delegated_vesting_shares": "0.000000 VESTS",
  "downvote_manabar": {
    "current_mana": 2035914951,
    "last_update_time": 1779090792
  },
  "guest_bloggers": [],
  "id": 449084,
  "json_metadata": "",
  "last_account_recovery": "1970-01-01T00:00:00",
  "last_account_update": "1970-01-01T00:00:00",
  "last_owner_update": "1970-01-01T00:00:00",
  "last_post": "2018-08-29T21:40:36",
  "last_root_post": "2018-08-29T21:40:36",
  "last_vote_time": "2018-06-12T23:09:12",
  "lifetime_vote_count": 0,
  "market_history": [],
  "memo_key": "STM69bvgnQVoLztrb7zu1GvQrfw5k9RdkXiwUR34AwsBUFMpCuLji",
  "mined": false,
  "name": "vanddar4",
  "next_vesting_withdrawal": "1969-12-31T23:59:59",
  "other_history": [],
  "owner": {
    "account_auths": [],
    "key_auths": [
      [
        "STM76oUzMiXSYi6vwhTt4NhsTpc1Xz7Fb9pZCkWaRGbPR7TX12As8",
        1
      ]
    ],
    "weight_threshold": 1
  },
  "pending_claimed_accounts": 0,
  "post_bandwidth": 0,
  "post_count": 29,
  "post_history": [],
  "posting": {
    "account_auths": [],
    "key_auths": [
      [
        "STM53rYxcgMBm1Hj1xaY6hq1VG33wU6RGpnVab5tcHQq4dMAyqJLb",
        1
      ]
    ],
    "weight_threshold": 1
  },
  "posting_json_metadata": "",
  "posting_rewards": 0,
  "proxied_vsf_votes": [
    0,
    0,
    0,
    0
  ],
  "proxy": "",
  "received_vesting_shares": "7116.646518 VESTS",
  "recovery_account": "steem",
  "reputation": 179281042,
  "reset_account": "null",
  "reward_sbd_balance": "0.000 SBD",
  "reward_steem_balance": "0.000 STEEM",
  "reward_vesting_balance": "0.000000 VESTS",
  "reward_vesting_steem": "0.000 STEEM",
  "savings_balance": "0.000 STEEM",
  "savings_sbd_balance": "0.000 SBD",
  "savings_sbd_last_interest_payment": "1970-01-01T00:00:00",
  "savings_sbd_seconds": "0",
  "savings_sbd_seconds_last_update": "1970-01-01T00:00:00",
  "savings_withdraw_requests": 0,
  "sbd_balance": "0.000 SBD",
  "sbd_last_interest_payment": "1970-01-01T00:00:00",
  "sbd_seconds": "0",
  "sbd_seconds_last_update": "1970-01-01T00:00:00",
  "tags_usage": [],
  "to_withdraw": 0,
  "transfer_history": [],
  "vesting_balance": "0.000 STEEM",
  "vesting_shares": "1027.013288 VESTS",
  "vesting_withdraw_rate": "0.000000 VESTS",
  "vote_history": [],
  "voting_manabar": {
    "current_mana": "8143659806",
    "last_update_time": 1779090792
  },
  "voting_power": 0,
  "withdraw_routes": 0,
  "withdrawn": 0,
  "witness_votes": [],
  "witnesses_voted_for": 0,
  "rank": 1325500
}
Withdraw Routes
| Incoming | Outgoing |
|---|---|
Empty | Empty |
{
  "incoming": [],
  "outgoing": []
}From Date
To Date
2026/05/18 07:53:12
2026/05/18 07:53:12
| delegatee | vanddar4 |
| delegator | steem |
| vesting shares | 7116.646518 VESTS |
| Transaction Info | Block #106152571/Trx 9d3cf7ee5bc67a5ac382c6ea628f174bf5668c90 |
View Raw JSON Data
{
  "block": 106152571,
  "op": [
    "delegate_vesting_shares",
    {
      "delegatee": "vanddar4",
      "delegator": "steem",
      "vesting_shares": "7116.646518 VESTS"
    }
  ],
  "op_in_trx": 0,
  "timestamp": "2026-05-18T07:53:12",
  "trx_id": "9d3cf7ee5bc67a5ac382c6ea628f174bf5668c90",
  "trx_in_block": 1,
  "virtual_op": 0
}2026/05/13 10:49:24
2026/05/13 10:49:24
| delegatee | vanddar4 |
| delegator | steem |
| vesting shares | 4404.436113 VESTS |
| Transaction Info | Block #106012803/Trx 71cf87d9249f8c914180aa98b79f48aba9aac31c |
View Raw JSON Data
{
  "block": 106012803,
  "op": [
    "delegate_vesting_shares",
    {
      "delegatee": "vanddar4",
      "delegator": "steem",
      "vesting_shares": "4404.436113 VESTS"
    }
  ],
  "op_in_trx": 0,
  "timestamp": "2026-05-13T10:49:24",
  "trx_id": "71cf87d9249f8c914180aa98b79f48aba9aac31c",
  "trx_in_block": 2,
  "virtual_op": 0
}2026/04/26 07:02:54
2026/04/26 07:02:54
| delegatee | vanddar4 |
| delegator | steem |
| vesting shares | 7129.162274 VESTS |
| Transaction Info | Block #105520014/Trx a9df86ad0471e03f62d45f2616ba5b33826f9b8d |
View Raw JSON Data
{
  "block": 105520014,
  "op": [
    "delegate_vesting_shares",
    {
      "delegatee": "vanddar4",
      "delegator": "steem",
      "vesting_shares": "7129.162274 VESTS"
    }
  ],
  "op_in_trx": 0,
  "timestamp": "2026-04-26T07:02:54",
  "trx_id": "a9df86ad0471e03f62d45f2616ba5b33826f9b8d",
  "trx_in_block": 0,
  "virtual_op": 0
}2026/01/24 04:18:54
2026/01/24 04:18:54
| delegatee | vanddar4 |
| delegator | steem |
| vesting shares | 4445.982932 VESTS |
| Transaction Info | Block #102876375/Trx 811ff65051d9287206874df97eb259aacd7bc0cf |
View Raw JSON Data
{
  "block": 102876375,
  "op": [
    "delegate_vesting_shares",
    {
      "delegatee": "vanddar4",
      "delegator": "steem",
      "vesting_shares": "4445.982932 VESTS"
    }
  ],
  "op_in_trx": 0,
  "timestamp": "2026-01-24T04:18:54",
  "trx_id": "811ff65051d9287206874df97eb259aacd7bc0cf",
  "trx_in_block": 0,
  "virtual_op": 0
}2024/12/17 23:27:39
2024/12/17 23:27:39
| delegatee | vanddar4 |
| delegator | steem |
| vesting shares | 4610.202129 VESTS |
| Transaction Info | Block #91322572/Trx 6b8f3d5496a1bd0bba39195d1fc7737bf3c72036 |
View Raw JSON Data
{
  "block": 91322572,
  "op": [
    "delegate_vesting_shares",
    {
      "delegatee": "vanddar4",
      "delegator": "steem",
      "vesting_shares": "4610.202129 VESTS"
    }
  ],
  "op_in_trx": 0,
  "timestamp": "2024-12-17T23:27:39",
  "trx_id": "6b8f3d5496a1bd0bba39195d1fc7737bf3c72036",
  "trx_in_block": 4,
  "virtual_op": 0
}2023/11/14 15:06:18
2023/11/14 15:06:18
| delegatee | vanddar4 |
| delegator | steem |
| vesting shares | 4779.335661 VESTS |
| Transaction Info | Block #79876659/Trx 14c08f5c9b740855ad359da7283eea888c5faea2 |
View Raw JSON Data
{
  "block": 79876659,
  "op": [
    "delegate_vesting_shares",
    {
      "delegatee": "vanddar4",
      "delegator": "steem",
      "vesting_shares": "4779.335661 VESTS"
    }
  ],
  "op_in_trx": 0,
  "timestamp": "2023-11-14T15:06:18",
  "trx_id": "14c08f5c9b740855ad359da7283eea888c5faea2",
  "trx_in_block": 2,
  "virtual_op": 0
}2023/09/22 12:16:21
2023/09/22 12:16:21
| delegatee | vanddar4 |
| delegator | steem |
| vesting shares | 7716.244447 VESTS |
| Transaction Info | Block #78365114/Trx 3372a10c8f1586b48116134cd47ff0f586201c8e |
View Raw JSON Data
{
  "block": 78365114,
  "op": [
    "delegate_vesting_shares",
    {
      "delegatee": "vanddar4",
      "delegator": "steem",
      "vesting_shares": "7716.244447 VESTS"
    }
  ],
  "op_in_trx": 0,
  "timestamp": "2023-09-22T12:16:21",
  "trx_id": "3372a10c8f1586b48116134cd47ff0f586201c8e",
  "trx_in_block": 5,
  "virtual_op": 0
}2022/11/03 19:30:48
2022/11/03 19:30:48
| delegatee | vanddar4 |
| delegator | steem |
| vesting shares | 7938.295885 VESTS |
| Transaction Info | Block #69122589/Trx ba88f675c21afdf494ad44772b624f427194f5d0 |
View Raw JSON Data
{
  "block": 69122589,
  "op": [
    "delegate_vesting_shares",
    {
      "delegatee": "vanddar4",
      "delegator": "steem",
      "vesting_shares": "7938.295885 VESTS"
    }
  ],
  "op_in_trx": 0,
  "timestamp": "2022-11-03T19:30:48",
  "trx_id": "ba88f675c21afdf494ad44772b624f427194f5d0",
  "trx_in_block": 1,
  "virtual_op": 0
}2022/01/18 00:33:18
2022/01/18 00:33:18
| delegatee | vanddar4 |
| delegator | steem |
| vesting shares | 8158.403486 VESTS |
| Transaction Info | Block #60825650/Trx f991d369b474b99c674e4daecba8cfb91873ecf2 |
View Raw JSON Data
{
  "block": 60825650,
  "op": [
    "delegate_vesting_shares",
    {
      "delegatee": "vanddar4",
      "delegator": "steem",
      "vesting_shares": "8158.403486 VESTS"
    }
  ],
  "op_in_trx": 0,
  "timestamp": "2022-01-18T00:33:18",
  "trx_id": "f991d369b474b99c674e4daecba8cfb91873ecf2",
  "trx_in_block": 10,
  "virtual_op": 0
}2021/06/14 07:40:12
2021/06/14 07:40:12
| delegatee | vanddar4 |
| delegator | steem |
| vesting shares | 8342.597774 VESTS |
| Transaction Info | Block #54615890/Trx 889512b937edac2d0a58c76b0ce8cc7d726b2027 |
View Raw JSON Data
{
  "block": 54615890,
  "op": [
    "delegate_vesting_shares",
    {
      "delegatee": "vanddar4",
      "delegator": "steem",
      "vesting_shares": "8342.597774 VESTS"
    }
  ],
  "op_in_trx": 0,
  "timestamp": "2021-06-14T07:40:12",
  "trx_id": "889512b937edac2d0a58c76b0ce8cc7d726b2027",
  "trx_in_block": 35,
  "virtual_op": 0
}2020/12/11 17:51:00
2020/12/11 17:51:00
| delegatee | vanddar4 |
| delegator | steem |
| vesting shares | 8530.019748 VESTS |
| Transaction Info | Block #49363103/Trx 6571b60c5237e6fbed920ba185feb45c5b342b36 |
View Raw JSON Data
{
  "block": 49363103,
  "op": [
    "delegate_vesting_shares",
    {
      "delegatee": "vanddar4",
      "delegator": "steem",
      "vesting_shares": "8530.019748 VESTS"
    }
  ],
  "op_in_trx": 0,
  "timestamp": "2020-12-11T17:51:00",
  "trx_id": "6571b60c5237e6fbed920ba185feb45c5b342b36",
  "trx_in_block": 2,
  "virtual_op": 0
}2020/12/06 11:26:06
2020/12/06 11:26:06
| delegatee | vanddar4 |
| delegator | steem |
| vesting shares | 1912.543513 VESTS |
| Transaction Info | Block #49214615/Trx 394cfc64cdfc0a2f7d19e88b66f3b5665f2777d5 |
View Raw JSON Data
{
  "block": 49214615,
  "op": [
    "delegate_vesting_shares",
    {
      "delegatee": "vanddar4",
      "delegator": "steem",
      "vesting_shares": "1912.543513 VESTS"
    }
  ],
  "op_in_trx": 0,
  "timestamp": "2020-12-06T11:26:06",
  "trx_id": "394cfc64cdfc0a2f7d19e88b66f3b5665f2777d5",
  "trx_in_block": 2,
  "virtual_op": 0
}2020/12/05 21:28:48
2020/12/05 21:28:48
| delegatee | vanddar4 |
| delegator | steem |
| vesting shares | 8536.227602 VESTS |
| Transaction Info | Block #49198186/Trx 625cb4c8d022f22ed668103e8a1429a14849181e |
View Raw JSON Data
{
  "block": 49198186,
  "op": [
    "delegate_vesting_shares",
    {
      "delegatee": "vanddar4",
      "delegator": "steem",
      "vesting_shares": "8536.227602 VESTS"
    }
  ],
  "op_in_trx": 0,
  "timestamp": "2020-12-05T21:28:48",
  "trx_id": "625cb4c8d022f22ed668103e8a1429a14849181e",
  "trx_in_block": 4,
  "virtual_op": 0
}2020/11/03 05:36:24
2020/11/03 05:36:24
| delegatee | vanddar4 |
| delegator | steem |
| vesting shares | 1920.017158 VESTS |
| Transaction Info | Block #48274248/Trx 329209241cd90fe44f9db64956db8d4a81764cc7 |
View Raw JSON Data
{
  "block": 48274248,
  "op": [
    "delegate_vesting_shares",
    {
      "delegatee": "vanddar4",
      "delegator": "steem",
      "vesting_shares": "1920.017158 VESTS"
    }
  ],
  "op_in_trx": 0,
  "timestamp": "2020-11-03T05:36:24",
  "trx_id": "329209241cd90fe44f9db64956db8d4a81764cc7",
  "trx_in_block": 0,
  "virtual_op": 0
}2020/05/09 12:30:39
2020/05/09 12:30:39
| delegatee | vanddar4 |
| delegator | steem |
| vesting shares | 8739.032961 VESTS |
| Transaction Info | Block #43224970/Trx 09d7fa7bd35d37525e5a5194796556412eafb38c |
View Raw JSON Data
{
  "block": 43224970,
  "op": [
    "delegate_vesting_shares",
    {
      "delegatee": "vanddar4",
      "delegator": "steem",
      "vesting_shares": "8739.032961 VESTS"
    }
  ],
  "op_in_trx": 0,
  "timestamp": "2020-05-09T12:30:39",
  "trx_id": "09d7fa7bd35d37525e5a5194796556412eafb38c",
  "trx_in_block": 9,
  "virtual_op": 0
}2020/05/08 17:07:45
2020/05/08 17:07:45
| delegatee | vanddar4 |
| delegator | steem |
| vesting shares | 1953.311140 VESTS |
| Transaction Info | Block #43202256/Trx 922e2ccbed5bc48c45165bffe3a9ef088d182917 |
View Raw JSON Data
{
  "block": 43202256,
  "op": [
    "delegate_vesting_shares",
    {
      "delegatee": "vanddar4",
      "delegator": "steem",
      "vesting_shares": "1953.311140 VESTS"
    }
  ],
  "op_in_trx": 0,
  "timestamp": "2020-05-08T17:07:45",
  "trx_id": "922e2ccbed5bc48c45165bffe3a9ef088d182917",
  "trx_in_block": 24,
  "virtual_op": 0
}2019/11/15 05:41:54
2019/11/15 05:41:54
| author | steemitboard |
| body | Congratulations @vanddar4! You received a personal award! <table><tr><td>https://steemitimages.com/70x70/http://steemitboard.com/@vanddar4/birthday2.png</td><td>Happy Birthday! - You are on the Steem blockchain for 2 years!</td></tr></table> <sub>_You can view [your badges on your Steem Board](https://steemitboard.com/@vanddar4) and compare to others on the [Steem Ranking](https://steemitboard.com/ranking/index.php?name=vanddar4)_</sub> ###### [Vote for @Steemitboard as a witness](https://v2.steemconnect.com/sign/account-witness-vote?witness=steemitboard&approve=1) to get one more award and increased upvotes! |
| json metadata | {"image":["https://steemitboard.com/img/notify.png"]} |
| parent author | vanddar4 |
| parent permlink | bitcoin-bullish-until-daily-618-fib-retracement |
| permlink | steemitboard-notify-vanddar4-20191115t054153000z |
| title | |
| Transaction Info | Block #38188039/Trx 258a6f0e13077be9a09ad5651120ec8db3d6e24f |
View Raw JSON Data
{
  "block": 38188039,
  "op": [
    "comment",
    {
      "author": "steemitboard",
      "body": "Congratulations @vanddar4! You received a personal award!\n\n<table><tr><td>https://steemitimages.com/70x70/http://steemitboard.com/@vanddar4/birthday2.png</td><td>Happy Birthday! - You are on the Steem blockchain for 2 years!</td></tr></table>\n\n<sub>_You can view [your badges on your Steem Board](https://steemitboard.com/@vanddar4) and compare to others on the [Steem Ranking](https://steemitboard.com/ranking/index.php?name=vanddar4)_</sub>\n\n\n###### [Vote for @Steemitboard as a witness](https://v2.steemconnect.com/sign/account-witness-vote?witness=steemitboard&approve=1) to get one more award and increased upvotes!",
      "json_metadata": "{\"image\":[\"https://steemitboard.com/img/notify.png\"]}",
      "parent_author": "vanddar4",
      "parent_permlink": "bitcoin-bullish-until-daily-618-fib-retracement",
      "permlink": "steemitboard-notify-vanddar4-20191115t054153000z",
      "title": ""
    }
  ],
  "op_in_trx": 0,
  "timestamp": "2019-11-15T05:41:54",
  "trx_id": "258a6f0e13077be9a09ad5651120ec8db3d6e24f",
  "trx_in_block": 9,
  "virtual_op": 0
}2019/11/03 09:49:03
2019/11/03 09:49:03
| delegatee | vanddar4 |
| delegator | steem |
| vesting shares | 8844.179065 VESTS |
| Transaction Info | Block #37848054/Trx fcc495db32e1181a61c172b05168ade690727710 |
View Raw JSON Data
{
  "block": 37848054,
  "op": [
    "delegate_vesting_shares",
    {
      "delegatee": "vanddar4",
      "delegator": "steem",
      "vesting_shares": "8844.179065 VESTS"
    }
  ],
  "op_in_trx": 0,
  "timestamp": "2019-11-03T09:49:03",
  "trx_id": "fcc495db32e1181a61c172b05168ade690727710",
  "trx_in_block": 18,
  "virtual_op": 0
}2018/11/28 23:19:30
2018/11/28 23:19:30
| delegatee | vanddar4 |
| delegator | steem |
| vesting shares | 9041.626238 VESTS |
| Transaction Info | Block #28108508/Trx ce2ad58100f3dcf834797d36f1d03bcdd7e1c16d |
View Raw JSON Data
{
  "block": 28108508,
  "op": [
    "delegate_vesting_shares",
    {
      "delegatee": "vanddar4",
      "delegator": "steem",
      "vesting_shares": "9041.626238 VESTS"
    }
  ],
  "op_in_trx": 0,
  "timestamp": "2018-11-28T23:19:30",
  "trx_id": "ce2ad58100f3dcf834797d36f1d03bcdd7e1c16d",
  "trx_in_block": 1,
  "virtual_op": 0
}2018/11/15 05:07:57
2018/11/15 05:07:57
| author | steemitboard |
| body | Congratulations @vanddar4! You have received a personal award! [](http://steemitboard.com/@vanddar4) 1 Year on Steemit <sub>_Click on the badge to view your Board of Honor._</sub> **Do not miss the last post from @steemitboard:** <table><tr><td><a href="https://steemit.com/steemfest/@steemitboard/the-meet-the-steemians-contest-is-over-results-are-coming-soon"><img src="https://steemitimages.com/64x128/https://cdn.steemitimages.com/DQmeLukvNFRsa7RURqsFpiLGEZZD49MiU52JtWmjS5S2wtW/image.png"></a></td><td><a href="https://steemit.com/steemfest/@steemitboard/the-meet-the-steemians-contest-is-over-results-are-coming-soon">The Meet the Steemians Contest is over - Results are coming soon ...</a></td></tr></table> > Support [SteemitBoard's project](https://steemit.com/@steemitboard)! **[Vote for its witness](https://v2.steemconnect.com/sign/account-witness-vote?witness=steemitboard&approve=1)** and **get one more award**! |
| json metadata | {"image":["https://steemitboard.com/img/notify.png"]} |
| parent author | vanddar4 |
| parent permlink | bitcoin-bullish-until-daily-618-fib-retracement |
| permlink | steemitboard-notify-vanddar4-20181115t050757000z |
| title | |
| Transaction Info | Block #27712475/Trx 35d960cb4131f7983ff457dc28dd64410dcab7c9 |
View Raw JSON Data
{
"block": 27712475,
"op": [
"comment",
{
"author": "steemitboard",
"body": "Congratulations @vanddar4! You have received a personal award!\n\n[](http://steemitboard.com/@vanddar4) 1 Year on Steemit\n<sub>_Click on the badge to view your Board of Honor._</sub>\n\n\n**Do not miss the last post from @steemitboard:**\n<table><tr><td><a href=\"https://steemit.com/steemfest/@steemitboard/the-meet-the-steemians-contest-is-over-results-are-coming-soon\"><img src=\"https://steemitimages.com/64x128/https://cdn.steemitimages.com/DQmeLukvNFRsa7RURqsFpiLGEZZD49MiU52JtWmjS5S2wtW/image.png\"></a></td><td><a href=\"https://steemit.com/steemfest/@steemitboard/the-meet-the-steemians-contest-is-over-results-are-coming-soon\">The Meet the Steemians Contest is over - Results are coming soon ...</a></td></tr></table>\n\n> Support [SteemitBoard's project](https://steemit.com/@steemitboard)! **[Vote for its witness](https://v2.steemconnect.com/sign/account-witness-vote?witness=steemitboard&approve=1)** and **get one more award**!",
"json_metadata": "{\"image\":[\"https://steemitboard.com/img/notify.png\"]}",
"parent_author": "vanddar4",
"parent_permlink": "bitcoin-bullish-until-daily-618-fib-retracement",
"permlink": "steemitboard-notify-vanddar4-20181115t050757000z",
"title": ""
}
],
"op_in_trx": 0,
"timestamp": "2018-11-15T05:07:57",
"trx_id": "35d960cb4131f7983ff457dc28dd64410dcab7c9",
"trx_in_block": 2,
"virtual_op": 0
}2018/10/12 10:33:51
2018/10/12 10:33:51
| delegatee | vanddar4 |
| delegator | steem |
| vesting shares | 29256.859265 VESTS |
| Transaction Info | Block #26740517/Trx 56cdb646a0eabb8f9d088702581173da903c2d84 |
View Raw JSON Data
{
  "block": 26740517,
  "op": [
    "delegate_vesting_shares",
    {
      "delegatee": "vanddar4",
      "delegator": "steem",
      "vesting_shares": "29256.859265 VESTS"
    }
  ],
  "op_in_trx": 0,
  "timestamp": "2018-10-12T10:33:51",
  "trx_id": "56cdb646a0eabb8f9d088702581173da903c2d84",
  "trx_in_block": 13,
  "virtual_op": 0
}vanddar4published a new post: bitcoin-bullish-until-daily-618-fib-retracement2018/08/29 21:40:36
vanddar4published a new post: bitcoin-bullish-until-daily-618-fib-retracement
2018/08/29 21:40:36
| author | vanddar4 |
| body | On the hourly logarithmic Bitcoin Bitfinex chart, I have created a new standard pitchfork from the pivot low on August 13th to the swing high on August 21st and the swing low the next day on the 22nd. Price has stayed pretty tightly in the lower half of the pitchfork alternating between the the blue and green channel. Price has not yet successfully broken the red median line and if this bullish rally should continue we will most likely see price battle again with the median line where it currently sits around $7,250 and rising. There are quite a few bullish indicators on the longer time frames, but it appears over the next few hours price needs to head lower to consolidate some more. Price is currently sitting in the blue channel and I believe that a further dip down to the edge of the pitchfork and the yellow-line appears possible. There is also a black horizontal support line at around $6,875 that could also provide as a downside target. Momentum continues upward however, and price may bounce around the top of the blue channel for a while before deciding to pullback more. There was some good volume on the downdraft around 11am EST, but volume has slowed down and price has already headed steadily higher on lower volume and the volume is now bullishly picking back up as well. The RSI action is in an uptrend over the last few days. The red candle downward from earlier today was inevitable with the bearish divergence from price’s higher highs and the RSI's lower highs and marked with the lime green lines. The RSI dipped slightly back into a bearish zone at 39, but has since recovered and sitting now fairly neutral at 51. The MACD is EMA lines are steadily trending downwards toward the zero bound, but the blue trigger line is curling upward already with the histogram ticking upward giving some bullish signs similar to that on Sunday August 26th and both circled in red. There may be another ascending triangle forming here, which would likely break upward if the blue lines continued to hold. I put a green target of at least $7,300 up there in the upper right corner until we can see how things unfold. 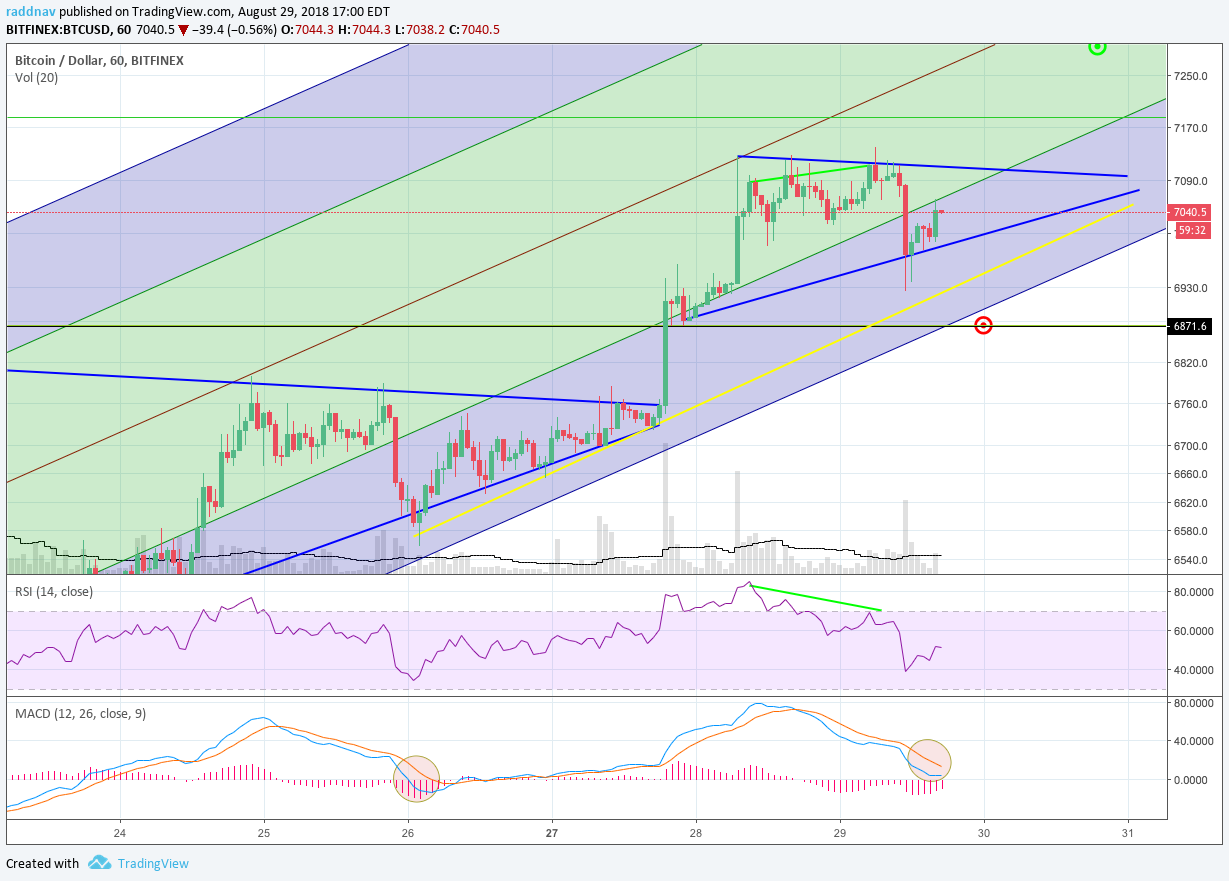 On the daily logarithmic Bitcoin Bitfinex chart, you have a better view of the pitchfork discussed on the hourly chart and see this red long-term downtrend line repelling price from a few weeks ago. I have drawn a inverse Fibonacci retracement from the highs back on July 24th all the way down to the low on August 14th and you can how far price has retraced. On the last two bearish trends over the past few months, the price has retraced back to at least the .618 level before heading lower. Under that assumption on this trend, we would have a target at that greenish line .618 line at $7,497. I think the $7,185 green line at the .5 retracement level also could put up some far resistance and this steady grind higher might last for a few more weeks. Many people have been trained for expectation for dips at this point and I think profit taking is going to become more prevalent on any price rises for the bulls. The buying support has been solid so far, but it’s important to take these things one day at a time. The volume has been steadily increasing bullishly the past few days, but today's may not provide the same. Today’s candle is currently putting up a bearish spinning top, so we will have to see what the next few hours hold. The RSI is currently sitting neutral at 58 and just below the bullish zone and it certainly appears there is some additional upside coming, but it may next a few days. The last time RSI was at this RSI resistance at 60, price was around $6,750. The MACD EMA lines have bullishly crossed over and are heading higher, but there is a gap forming indicating the possibility of a temporary pullback especially if one of those histogram bars begins to tick lower. On the other hand, that blue trigger line is about to cross the zero bound and should give price a boost. I think remain bullish until price can signal otherwise. -More on Vanddar.com 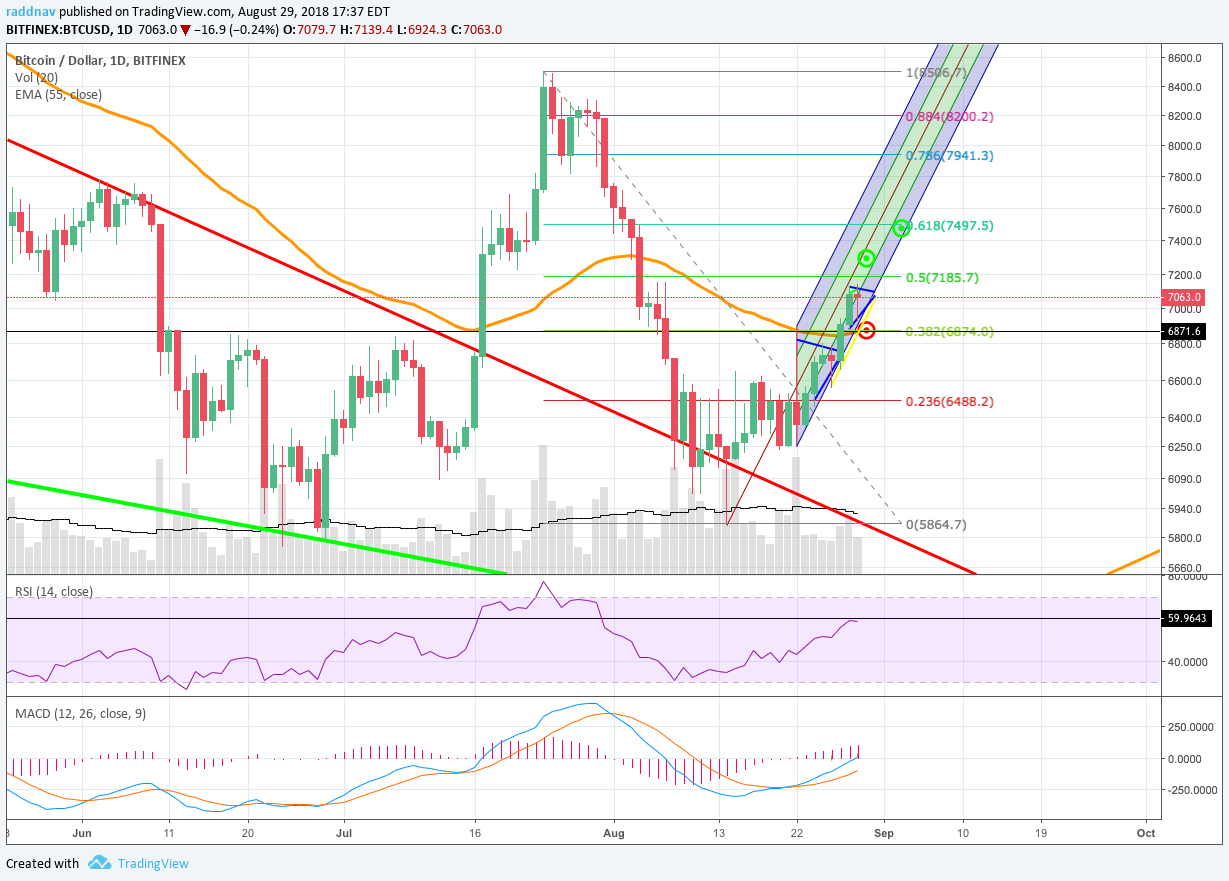 |
| json metadata | {"tags":["bitcoin","btc","cryptocurrency"],"image":["https://cdn.steemitimages.com/DQmRKkSsXDovY2NTmmRzYRUwc8xvTKfqfC8j8ZBJVBFmY18/image.png","https://cdn.steemitimages.com/DQmdWSf7MEKTXcoMt1GZ8B51caJ39rA4y16wqMADtpDxtC7/image.png"],"app":"steemit/0.1","format":"markdown"} |
| parent author | |
| parent permlink | bitcoin |
| permlink | bitcoin-bullish-until-daily-618-fib-retracement |
| title | Bitcoin Bullish Until Daily .618 Fib Retracement |
| Transaction Info | Block #25503139/Trx 3ef1a38a1de707e76132b1cab8e38d07d5f5dc87 |
View Raw JSON Data
{
"block": 25503139,
"op": [
"comment",
{
"author": "vanddar4",
"body": "On the hourly logarithmic Bitcoin Bitfinex chart, I have created a new standard pitchfork from the pivot low on August 13th to the swing high on August 21st and the swing low the next day on the 22nd. Price has stayed pretty tightly in the lower half of the pitchfork alternating between the the blue and green channel. \n\nPrice has not yet successfully broken the red median line and if this bullish rally should continue we will most likely see price battle again with the median line where it currently sits around $7,250 and rising. There are quite a few bullish indicators on the longer time frames, but it appears over the next few hours price needs to head lower to consolidate some more. \n\nPrice is currently sitting in the blue channel and I believe that a further dip down to the edge of the pitchfork and the yellow-line appears possible. There is also a black horizontal support line at around $6,875 that could also provide as a downside target.\n\nMomentum continues upward however, and price may bounce around the top of the blue channel for a while before deciding to pullback more. There was some good volume on the downdraft around 11am EST, but volume has slowed down and price has already headed steadily higher on lower volume and the volume is now bullishly picking back up as well. \n\nThe RSI action is in an uptrend over the last few days. The red candle downward from earlier today was inevitable with the bearish divergence from price’s higher highs and the RSI's lower highs and marked with the lime green lines. The RSI dipped slightly back into a bearish zone at 39, but has since recovered and sitting now fairly neutral at 51.\n\nThe MACD is EMA lines are steadily trending downwards toward the zero bound, but the blue trigger line is curling upward already with the histogram ticking upward giving some bullish signs similar to that on Sunday August 26th and both circled in red.\n\nThere may be another ascending triangle forming here, which would likely break upward if the blue lines continued to hold. I put a green target of at least $7,300 up there in the upper right corner until we can see how things unfold.\n\n\n\nOn the daily logarithmic Bitcoin Bitfinex chart, you have a better view of the pitchfork discussed on the hourly chart and see this red long-term downtrend line repelling price from a few weeks ago. \n\nI have drawn a inverse Fibonacci retracement from the highs back on July 24th all the way down to the low on August 14th and you can how far price has retraced. On the last two bearish trends over the past few months, the price has retraced back to at least the .618 level before heading lower. Under that assumption on this trend, we would have a target at that greenish line .618 line at $7,497.\n\nI think the $7,185 green line at the .5 retracement level also could put up some far resistance and this steady grind higher might last for a few more weeks. Many people have been trained for expectation for dips at this point and I think profit taking is going to become more prevalent on any price rises for the bulls. The buying support has been solid so far, but it’s important to take these things one day at a time.\n\nThe volume has been steadily increasing bullishly the past few days, but today's may not provide the same. Today’s candle is currently putting up a bearish spinning top, so we will have to see what the next few hours hold.\n\nThe RSI is currently sitting neutral at 58 and just below the bullish zone and it certainly appears there is some additional upside coming, but it may next a few days. The last time RSI was at this RSI resistance at 60, price was around $6,750.\n\nThe MACD EMA lines have bullishly crossed over and are heading higher, but there is a gap forming indicating the possibility of a temporary pullback especially if one of those histogram bars begins to tick lower. On the other hand, that blue trigger line is about to cross the zero bound and should give price a boost. I think remain bullish until price can signal otherwise. \n\n-More on Vanddar.com\n\n",
"json_metadata": "{\"tags\":[\"bitcoin\",\"btc\",\"cryptocurrency\"],\"image\":[\"https://cdn.steemitimages.com/DQmRKkSsXDovY2NTmmRzYRUwc8xvTKfqfC8j8ZBJVBFmY18/image.png\",\"https://cdn.steemitimages.com/DQmdWSf7MEKTXcoMt1GZ8B51caJ39rA4y16wqMADtpDxtC7/image.png\"],\"app\":\"steemit/0.1\",\"format\":\"markdown\"}",
"parent_author": "",
"parent_permlink": "bitcoin",
"permlink": "bitcoin-bullish-until-daily-618-fib-retracement",
"title": "Bitcoin Bullish Until Daily .618 Fib Retracement"
}
],
"op_in_trx": 0,
"timestamp": "2018-08-29T21:40:36",
"trx_id": "3ef1a38a1de707e76132b1cab8e38d07d5f5dc87",
"trx_in_block": 44,
"virtual_op": 0
}vanddar4published a new post: bitcoin-hourly-bearish-patterns-taking-shape2018/08/24 16:36:18
vanddar4published a new post: bitcoin-hourly-bearish-patterns-taking-shape
2018/08/24 16:36:18
| author | vanddar4 |
| body | On the hourly analog Bitcoin Bitfinex chart, you can see the price steadily rising over the past few hours. The standard pitchfork has done a great job tracking some of the key levels for price current sitting in the lower blue channel around $6,500. There is a rising wedge pattern that has formed between the two pink lines and that top pink resistance line and the turquoise line together form a bearish pennant. Both these patterns indicate a bearish move, so the question becomes how deep might it go. Additionally, the candle from 7:00 am EST this morning indicate a rejection off that red down-trending long term trend line. I would expect some more candles to go up and challenge it again, however it’s time for the bulls to step up they are going to do something about bears moving into position. The orange 55 EMA is providing decent support for now, but that may not last much longer, so I have drawn a potential target of where price may visit if the outside of the pitchfork does not hold at a round $6,420. Perhaps price may have a wick stretch down to $6,340 or go as far as $6,250 and retest that low on Wednesday, which would also converge with the bottom of the purple channel on the pitchfork. The RSI is sitting at 51.07 in neutral territory with no major divergences, and the bullish 63 level seems to be providing some horizontal resistance there. A reset of the RSI to lower levels is needed to provide any bullish reversal indicators. The MACD has now crossed over bearishly and begun down ticking on the histogram. It appears destined to break back below that zero bound which will also provide further momentum for the bears. The OBV is also not provide much indication either way as well, but the overall theme looks bearish over the next few hours. 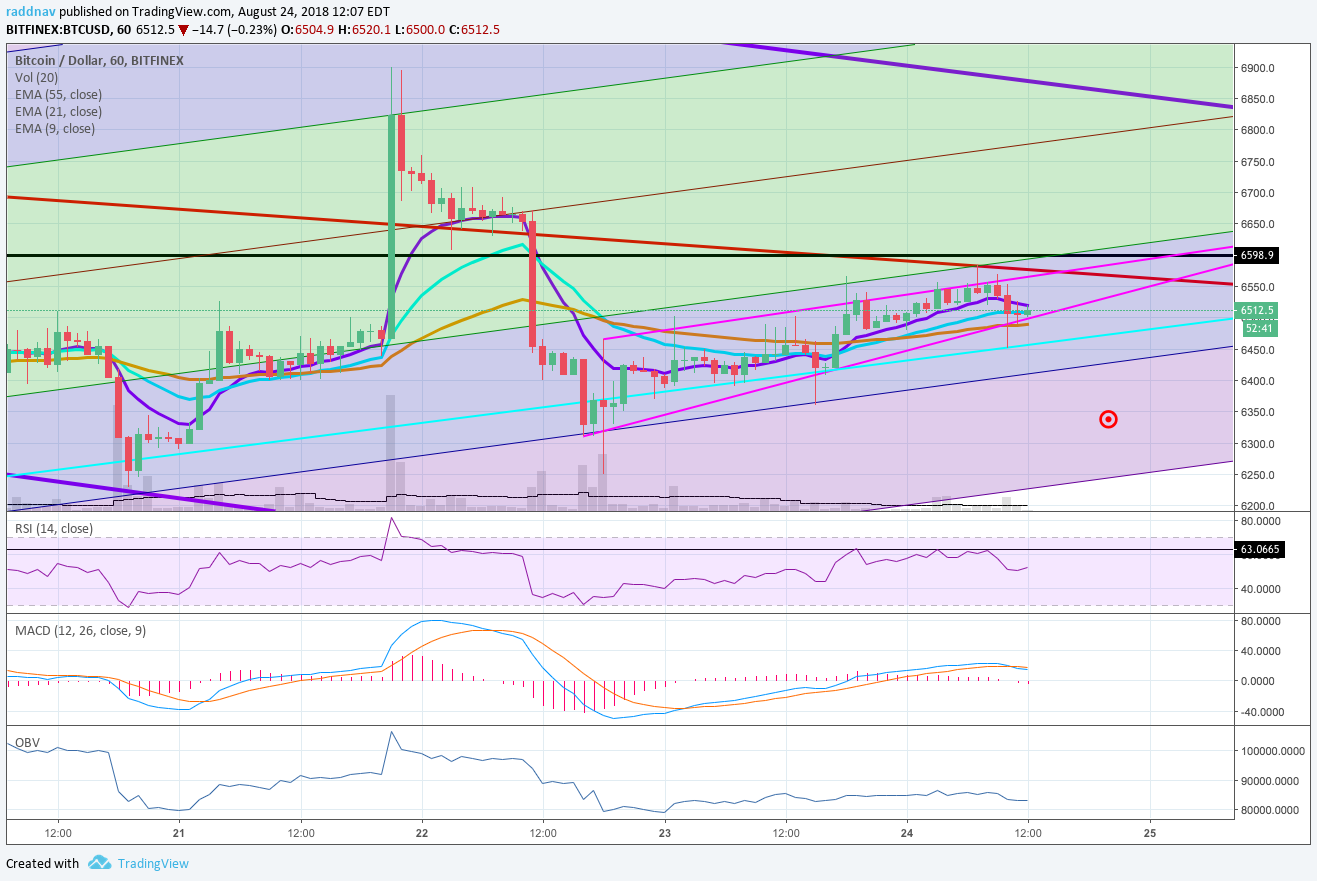 I looked at the daily and weekly charts yesterday, so I am going to take a look at the 8 hour analog Bitcoin Bitfinex chart today. The orange 55 EMA line here is providing resistance around $6,565, with the purple 9 candle EMA line providing support at $6,488 as their range narrows. Volume has been dropping predicating what could be a big move, there’s multiple levels of significant resistance with the red long term downtrend line and the black horizontal line as well. The RSI here is finding horizontal resistance around 55 and the interesting thing is the MACD lines are both above the zero bound barely at about 18 and 5. This is just slightly bullish because the lines are so close to one another and any price movement to the downside would quickly complete a bearish crossover and send the lines bearishly back below the zero bound. If price does manage to push upwards over the weekend, a target around $6,800 as the confluence between the medium line on the pitchfork and purple down-trending line might be a reasonable level before expecting major resistance again. Have a good weekend! -More on vanddar.com 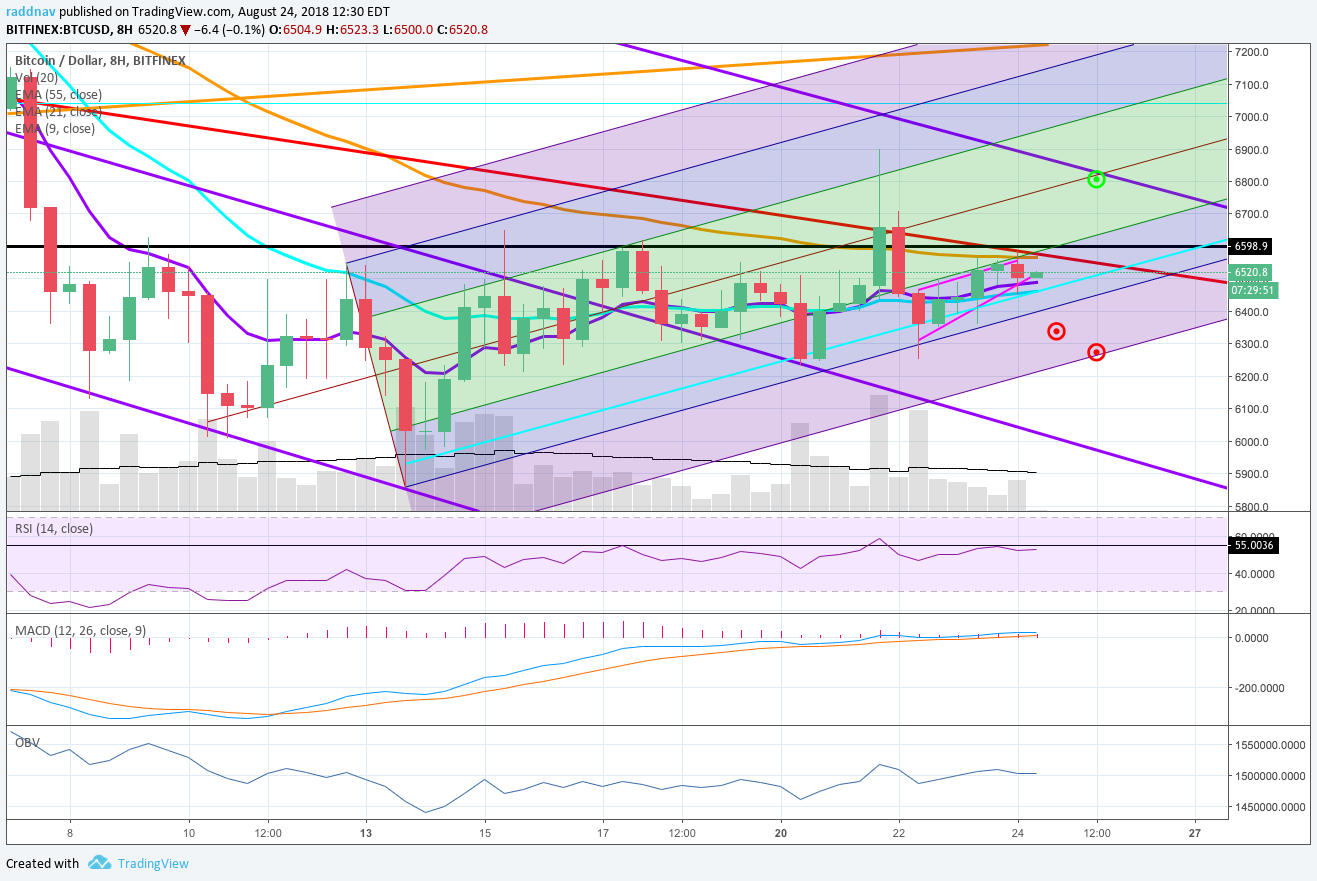 |
| json metadata | {"tags":["bitcoin","btc","cryptocurrency"],"image":["https://cdn.steemitimages.com/DQmSMFzc5PPii89PLUJiaiVXtM6D5amk2hRmrPzw1wgDUjZ/image.png","https://cdn.steemitimages.com/DQmPg8cFENd6gYbKWLnnFMf4GvEQKV73fF8i1ScdJufzRhE/image.png"],"app":"steemit/0.1","format":"markdown"} |
| parent author | |
| parent permlink | bitcoin |
| permlink | bitcoin-hourly-bearish-patterns-taking-shape |
| title | Bitcoin Hourly Bearish Patterns Taking Shape |
| Transaction Info | Block #25353138/Trx 8b28d977582b893883a829d8356f6fafe1bf1a01 |
View Raw JSON Data
{
"block": 25353138,
"op": [
"comment",
{
"author": "vanddar4",
"body": "On the hourly analog Bitcoin Bitfinex chart, you can see the price steadily rising over the past few hours. The standard pitchfork has done a great job tracking some of the key levels for price current sitting in the lower blue channel around $6,500.\n\nThere is a rising wedge pattern that has formed between the two pink lines and that top pink resistance line and the turquoise line together form a bearish pennant. Both these patterns indicate a bearish move, so the question becomes how deep might it go. \n\nAdditionally, the candle from 7:00 am EST this morning indicate a rejection off that red down-trending long term trend line. I would expect some more candles to go up and challenge it again, however it’s time for the bulls to step up they are going to do something about bears moving into position.\n\nThe orange 55 EMA is providing decent support for now, but that may not last much longer, so I have drawn a potential target of where price may visit if the outside of the pitchfork does not hold at a round $6,420. Perhaps price may have a wick stretch down to $6,340 or go as far as $6,250 and retest that low on Wednesday, which would also converge with the bottom of the purple channel on the pitchfork.\n\nThe RSI is sitting at 51.07 in neutral territory with no major divergences, and the bullish 63 level seems to be providing some horizontal resistance there. A reset of the RSI to lower levels is needed to provide any bullish reversal indicators.\n\nThe MACD has now crossed over bearishly and begun down ticking on the histogram. It appears destined to break back below that zero bound which will also provide further momentum for the bears. The OBV is also not provide much indication either way as well, but the overall theme looks bearish over the next few hours.\n\n\n\nI looked at the daily and weekly charts yesterday, so I am going to take a look at the 8 hour analog Bitcoin Bitfinex chart today. The orange 55 EMA line here is providing resistance around $6,565, with the purple 9 candle EMA line providing support at $6,488 as their range narrows.\n\nVolume has been dropping predicating what could be a big move, there’s multiple levels of significant resistance with the red long term downtrend line and the black horizontal line as well. The RSI here is finding horizontal resistance around 55 and the interesting thing is the MACD lines are both above the zero bound barely at about 18 and 5.\n\nThis is just slightly bullish because the lines are so close to one another and any price movement to the downside would quickly complete a bearish crossover and send the lines bearishly back below the zero bound.\n\nIf price does manage to push upwards over the weekend, a target around $6,800 as the confluence between the medium line on the pitchfork and purple down-trending line might be a reasonable level before expecting major resistance again. Have a good weekend!\n\n-More on vanddar.com\n\n",
"json_metadata": "{\"tags\":[\"bitcoin\",\"btc\",\"cryptocurrency\"],\"image\":[\"https://cdn.steemitimages.com/DQmSMFzc5PPii89PLUJiaiVXtM6D5amk2hRmrPzw1wgDUjZ/image.png\",\"https://cdn.steemitimages.com/DQmPg8cFENd6gYbKWLnnFMf4GvEQKV73fF8i1ScdJufzRhE/image.png\"],\"app\":\"steemit/0.1\",\"format\":\"markdown\"}",
"parent_author": "",
"parent_permlink": "bitcoin",
"permlink": "bitcoin-hourly-bearish-patterns-taking-shape",
"title": "Bitcoin Hourly Bearish Patterns Taking Shape"
}
],
"op_in_trx": 0,
"timestamp": "2018-08-24T16:36:18",
"trx_id": "8b28d977582b893883a829d8356f6fafe1bf1a01",
"trx_in_block": 28,
"virtual_op": 0
}d1360xupvoted (100.00%) @vanddar4 / bitcoin-retesting-resistance-of-the-weekly-falling-wedge2018/08/23 21:25:51
d1360xupvoted (100.00%) @vanddar4 / bitcoin-retesting-resistance-of-the-weekly-falling-wedge
2018/08/23 21:25:51
| author | vanddar4 |
| permlink | bitcoin-retesting-resistance-of-the-weekly-falling-wedge |
| voter | d1360x |
| weight | 10000 (100.00%) |
| Transaction Info | Block #25330145/Trx f88469e018d98ffbdca7c1b7a3fb3131b5c7f63a |
View Raw JSON Data
{
  "block": 25330145,
  "op": [
    "vote",
    {
      "author": "vanddar4",
      "permlink": "bitcoin-retesting-resistance-of-the-weekly-falling-wedge",
      "voter": "d1360x",
      "weight": 10000
    }
  ],
  "op_in_trx": 0,
  "timestamp": "2018-08-23T21:25:51",
  "trx_id": "f88469e018d98ffbdca7c1b7a3fb3131b5c7f63a",
  "trx_in_block": 13,
  "virtual_op": 0
}vanddar4published a new post: bitcoin-retesting-resistance-of-the-weekly-falling-wedge2018/08/23 21:24:39
vanddar4published a new post: bitcoin-retesting-resistance-of-the-weekly-falling-wedge
2018/08/23 21:24:39
| author | vanddar4 |
| body | On the daily analog Bitcoin Bitfinex chart, I have been tracking an up-trending pitchfork that has been capturing the pricing action nicely within 1 standard deviation. Even though the bears firmly denied the uptrend breakout with yesterday’s wick and red candle, price is not in bad shape. The issue could have been due to the Bitmex maintenance issues that handcuffed the bears at the time, and price just reverted to the mean. Bitcoin also had to survive the news of several ETF derivative rejections, but the news had much less of an effect on price than it did just a few weeks ago. From the high of $8,390 on July 24th price has retraced over .884 near that pink line at $6,061 to a low of $5,858. This has been a good stabilization level and good news for the bulls who did not give way to another 2018 low for price. Right now price is back at the bottom of the pitchfork and consolidating around the blue $6,275 resistance/support line. There is a decent chance that price swings back to the other edge of this pitchfork, where it’s currently is a weak bull trend. The purple lines running down across the chart are key support and resistance lines over the past few months on the analog and logarithmic chart that will be important going forward as well. I have identified 4 waves of what could be a leading diagonal structure where it’s possible price grinds higher over the next several days and ends around the wave 5 at $7,200. After that, we would most definitely see another pullback in price. That long term orange up-trending support line would also now provide resistance. The RSI is currently sitting at 44.52 and relatively neutral, but there is some weak hidden continued bearish divergence. The MACD blue trigger line did crossover the orange EMA line bullishly, with the histogram continuing to tick higher, with is good news for the bulls. Volume overall is looking good and is improving since the lows back in June and even though, some days have had pretty low volume over the past few weeks, there have also been some big volume volatility days as well. The bulls will want to see volume continue to improve to mark a turn around in prices for the market. 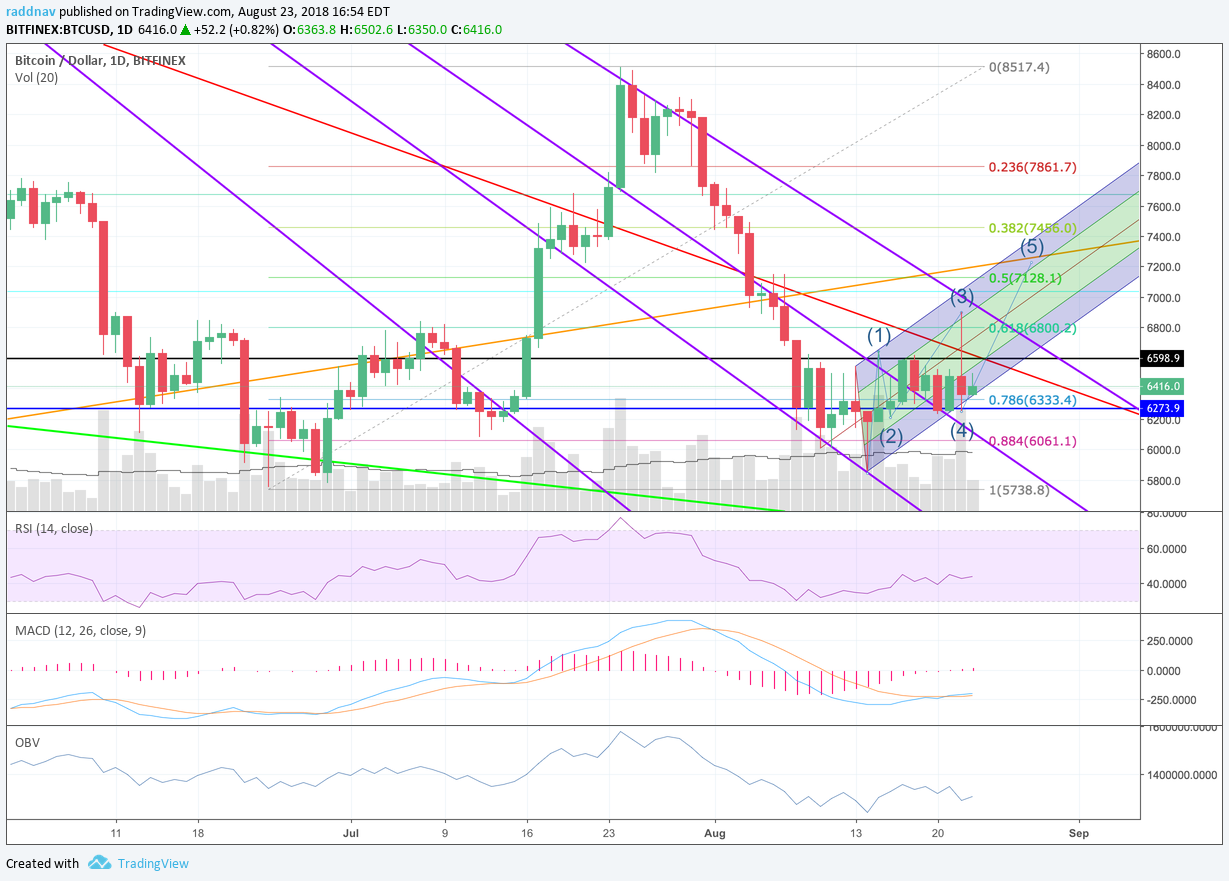 On the weekly analog Bitcoin Bitfinex chart, price has made a big falling wedge between the red resistance line and the lime green support line. The breakout back above the red support line on the week of July 24th spelled a bull trap which sent prices careening back into this wedge. The falling wedge is typically a bullish pattern that usually needs time to run it’s course. The good news for the bulls is that price hasn’t continued to break downward violently and the $6,000 level has remained as strong buying support. We have a few days left in the current candle and it appears like price is retesting the red line, finding resistance which would mean the next move would be for the bears to take price down to that lime green for support. I have put a little blue box down there that could be a fantastic buying opportunity around $5,500. If on the other hand price grinds higher into Sunday and can close back above that $6,712 level. That would be a another great sign for the bulls. Price may continue to ride the red line lower for a few weeks, but it would be another significant resistance level broken as Bitcoin attempt to shed it’s chains. The RSI is sitting at 44.49 and isn’t giving away much divergence besides some weak bullishness, but it is finding solid support above the typically bearish 40 level. The MACD looks to be in great shape as that blue trigger line is almost ready to cross back above the orange EMA. Price certainly could continue lower here for other reasons, but a crossover is becoming an inevitable over the next few weeks and would provide solid momentum to the upside when the close happens. The OBV is relatively stable and I think many people are waiting around for other indicators to buy before any money into the exchange. Time will tell, but there are some positive technical signs blinking. -More on Vanddar.com 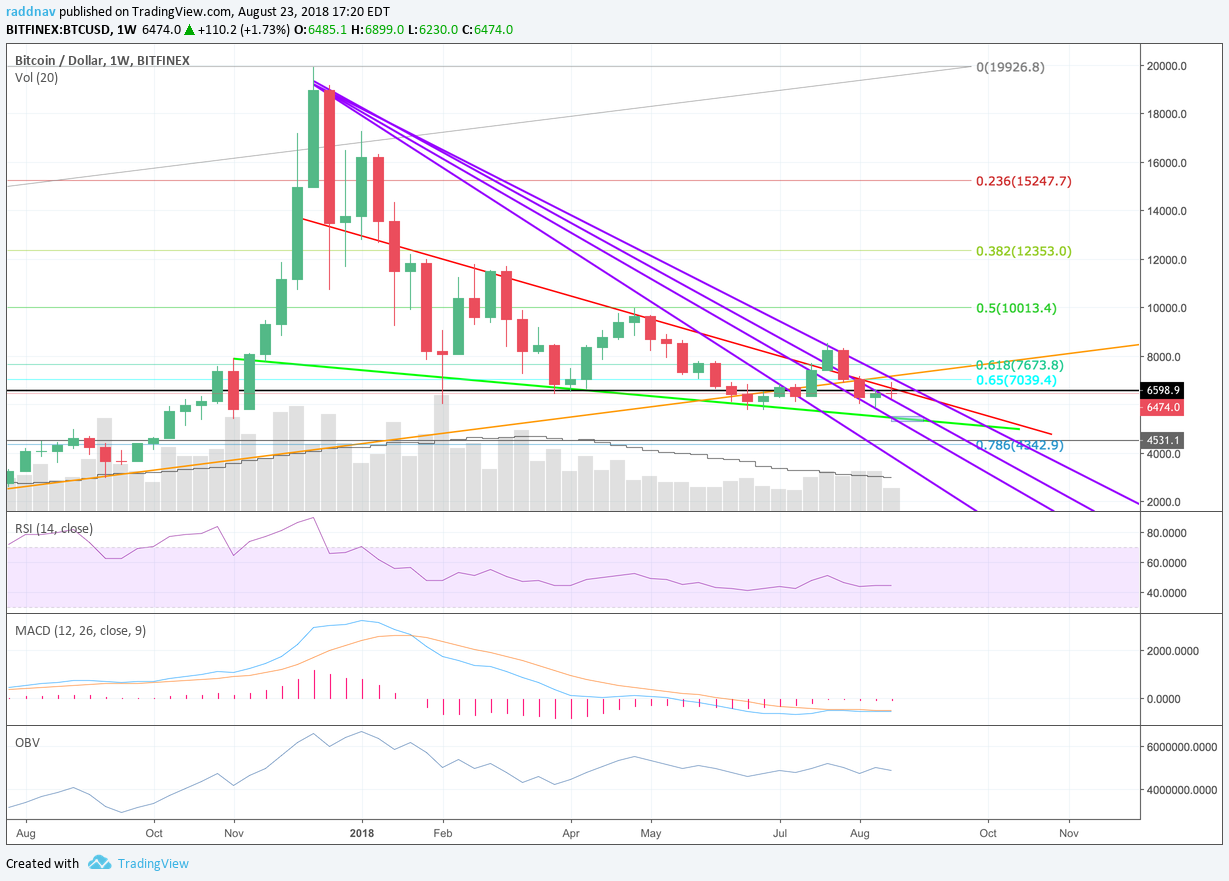 |
| json metadata | {"tags":["btc","bitcoin","cryptocurrency"],"image":["https://cdn.steemitimages.com/DQmYZDg2EfKwtXQNrYT45tpBVbMcho4Gt9ZCcx66CuzUxed/image.png","https://cdn.steemitimages.com/DQmaRcM3YhVapzZ8ubYaGmtYs6UxDUc8VBoaBkAz4Mg7LcE/image.png"],"app":"steemit/0.1","format":"markdown"} |
| parent author | |
| parent permlink | btc |
| permlink | bitcoin-retesting-resistance-of-the-weekly-falling-wedge |
| title | Bitcoin Retesting Resistance of the Weekly Falling Wedge |
| Transaction Info | Block #25330121/Trx 36196641271e607c53171a29fa48065b8557ac30 |
View Raw JSON Data
{
"block": 25330121,
"op": [
"comment",
{
"author": "vanddar4",
"body": "On the daily analog Bitcoin Bitfinex chart, I have been tracking an up-trending pitchfork that has been capturing the pricing action nicely within 1 standard deviation. Even though the bears firmly denied the uptrend breakout with yesterday’s wick and red candle, price is not in bad shape. \n\nThe issue could have been due to the Bitmex maintenance issues that handcuffed the bears at the time, and price just reverted to the mean. Bitcoin also had to survive the news of several ETF derivative rejections, but the news had much less of an effect on price than it did just a few weeks ago.\n\nFrom the high of $8,390 on July 24th price has retraced over .884 near that pink line at $6,061 to a low of $5,858. This has been a good stabilization level and good news for the bulls who did not give way to another 2018 low for price.\n\nRight now price is back at the bottom of the pitchfork and consolidating around the blue $6,275 resistance/support line. There is a decent chance that price swings back to the other edge of this pitchfork, where it’s currently is a weak bull trend.\n\nThe purple lines running down across the chart are key support and resistance lines over the past few months on the analog and logarithmic chart that will be important going forward as well.\n\nI have identified 4 waves of what could be a leading diagonal structure where it’s possible price grinds higher over the next several days and ends around the wave 5 at $7,200. After that, we would most definitely see another pullback in price. That long term orange up-trending support line would also now provide resistance.\n\nThe RSI is currently sitting at 44.52 and relatively neutral, but there is some weak hidden continued bearish divergence. The MACD blue trigger line did crossover the orange EMA line bullishly, with the histogram continuing to tick higher, with is good news for the bulls. \n\nVolume overall is looking good and is improving since the lows back in June and even though, some days have had pretty low volume over the past few weeks, there have also been some big volume volatility days as well. The bulls will want to see volume continue to improve to mark a turn around in prices for the market. \n\n\n\nOn the weekly analog Bitcoin Bitfinex chart, price has made a big falling wedge between the red resistance line and the lime green support line. The breakout back above the red support line on the week of July 24th spelled a bull trap which sent prices careening back into this wedge. \n\nThe falling wedge is typically a bullish pattern that usually needs time to run it’s course. The good news for the bulls is that price hasn’t continued to break downward violently and the $6,000 level has remained as strong buying support. \n\nWe have a few days left in the current candle and it appears like price is retesting the red line, finding resistance which would mean the next move would be for the bears to take price down to that lime green for support. I have put a little blue box down there that could be a fantastic buying opportunity around $5,500.\n\nIf on the other hand price grinds higher into Sunday and can close back above that $6,712 level. That would be a another great sign for the bulls. Price may continue to ride the red line lower for a few weeks, but it would be another significant resistance level broken as Bitcoin attempt to shed it’s chains.\n\nThe RSI is sitting at 44.49 and isn’t giving away much divergence besides some weak bullishness, but it is finding solid support above the typically bearish 40 level. \n\nThe MACD looks to be in great shape as that blue trigger line is almost ready to cross back above the orange EMA. Price certainly could continue lower here for other reasons, but a crossover is becoming an inevitable over the next few weeks and would provide solid momentum to the upside when the close happens.\n\nThe OBV is relatively stable and I think many people are waiting around for other indicators to buy before any money into the exchange. Time will tell, but there are some positive technical signs blinking.\n\n-More on Vanddar.com\n\n",
"json_metadata": "{\"tags\":[\"btc\",\"bitcoin\",\"cryptocurrency\"],\"image\":[\"https://cdn.steemitimages.com/DQmYZDg2EfKwtXQNrYT45tpBVbMcho4Gt9ZCcx66CuzUxed/image.png\",\"https://cdn.steemitimages.com/DQmaRcM3YhVapzZ8ubYaGmtYs6UxDUc8VBoaBkAz4Mg7LcE/image.png\"],\"app\":\"steemit/0.1\",\"format\":\"markdown\"}",
"parent_author": "",
"parent_permlink": "btc",
"permlink": "bitcoin-retesting-resistance-of-the-weekly-falling-wedge",
"title": "Bitcoin Retesting Resistance of the Weekly Falling Wedge"
}
],
"op_in_trx": 0,
"timestamp": "2018-08-23T21:24:39",
"trx_id": "36196641271e607c53171a29fa48065b8557ac30",
"trx_in_block": 11,
"virtual_op": 0
}vanddar4published a new post: bitcoin-drifting-away-from-down-trending-pitchfork2018/08/17 16:03:21
vanddar4published a new post: bitcoin-drifting-away-from-down-trending-pitchfork
2018/08/17 16:03:21
| author | vanddar4 |
| body | On the hourly Bitcoin Bitfinex chart, I have been tracking this down-trending pitchfork that started back on July 24th and price has been moving outside of it for the past 2 days now. Price did dip back inside the upper red channel of the pitchfork, but found support at the orange 55 EMA line as well as the up trending blue line I have drawn. There have now been about 3 retests on the outside of the pitchfork that have provided support and price is moving away from this bearish down-trend. That blue line compared to the black horizontal line at $6,500 make an ascending wedge pattern, which typically breaks upward. Over the past few hours, there are maybe 4 wicks running up through that $6,500 level as the bulls are really putting increasing pressure on the bears. I have also drawn a purple up-trending line showing the price increase since 5pm EST yesterday and giving additional support. The orange 55 hour EMA line is sitting below the turquoise 21 hour EMA, which is another bullish sign and the 21 EMA is also providing some price support as well. I have also placed pink two parallel lines that are indicating a bullish flag. Price has broken out of this level, but perhaps needs to retest it again, before heading higher. That could be a level around $6,384. RSI is relatively neutral here around 55.62 and could head either way. The MACD lines are flat and could roll over bearishly, but are still sitting above the zero bound bullishly. The histogram has a steady down-tick, but has three sets of higher lows, so further downside could prove to be limited here as well. The OBV also looks stronger from where prices were earlier in the week and could be a good sign. It would be good for the bulls to see volume increase significantly again on any price breaks above that $6,500 level. 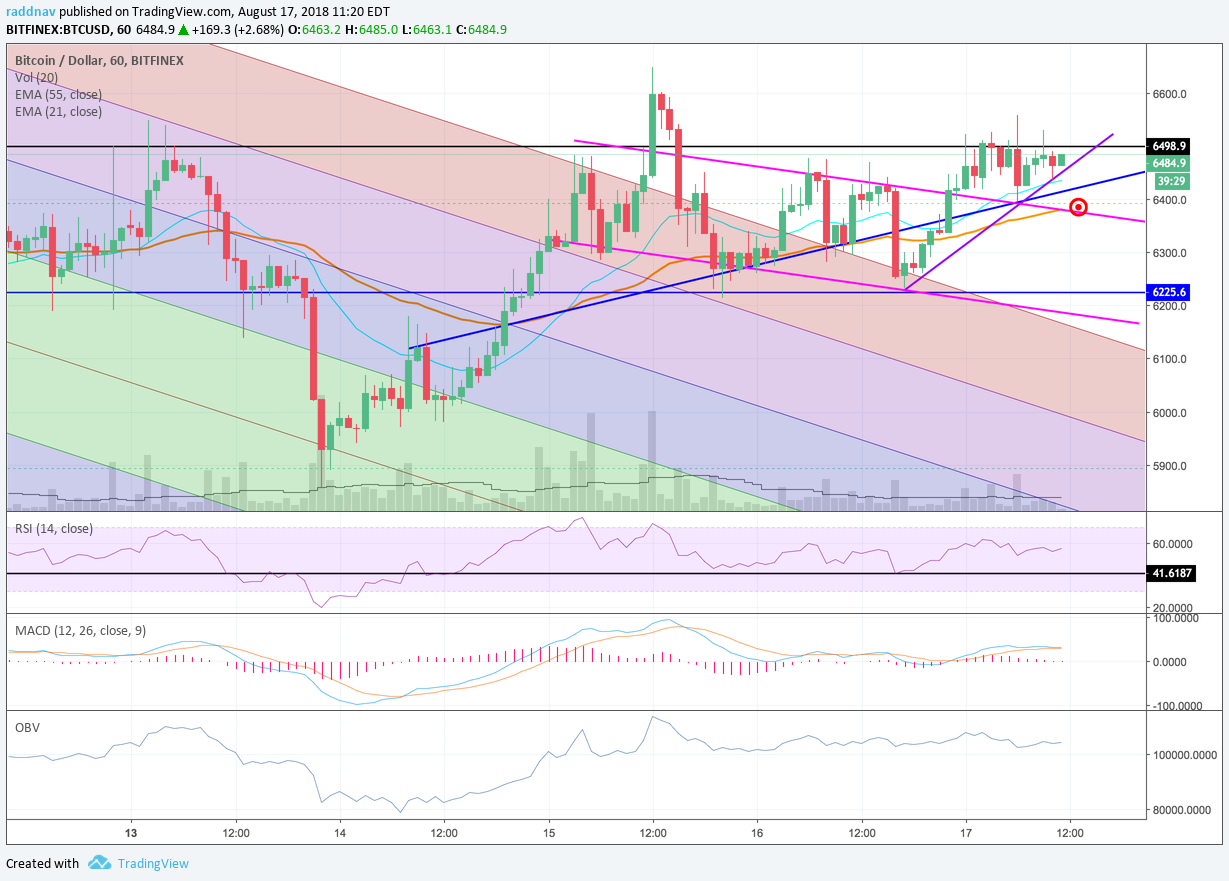 On the daily analog Bitcoin Bitfinex chart that big hammer candle from August 14th proved to be significant in rejecting that $5,892 level at the long-term .618 Fibonacci retracement and as of now there has been just a steady grind higher. If price does breakout higher a good target would be that red down-trending line around $6,800 over the weekend. However, if price does get there and the bulls cannot drive price higher then I would see a potential big head and shoulders top with the neck line at the blue horizontal line at $6,225. The bears would like that and we could see shorts begin piling in again. Overall, there are many people looking to short Bitcoin right now as well that may be new to it and looking to take advantage of the potential precipitous breakdown. I could see a big short squeeze occur depending on what the contracts look like when we get to that period. Ideally, for the bulls a rally back above that orange up-trending line at $7,200 would be hopeful. As of now, price has put in a higher low from June 24th at $5,755 to August 14th at $5,858, which is a good sign for the bulls. RSI is sitting at 42.99 and presently above the black horizontal support/ resistance line and there is some moderate hidden bullish divergence that I have marked with the pink line there. The MACD EMAs are curling upward bullishly and the histogram is ticking upward as well. It is still below the zero bound, so the momentum is with the bearish still, but things are encouraging in the short-term for the bulls. OBV is trending higher in the short-term as well. -More on Vanddar.com 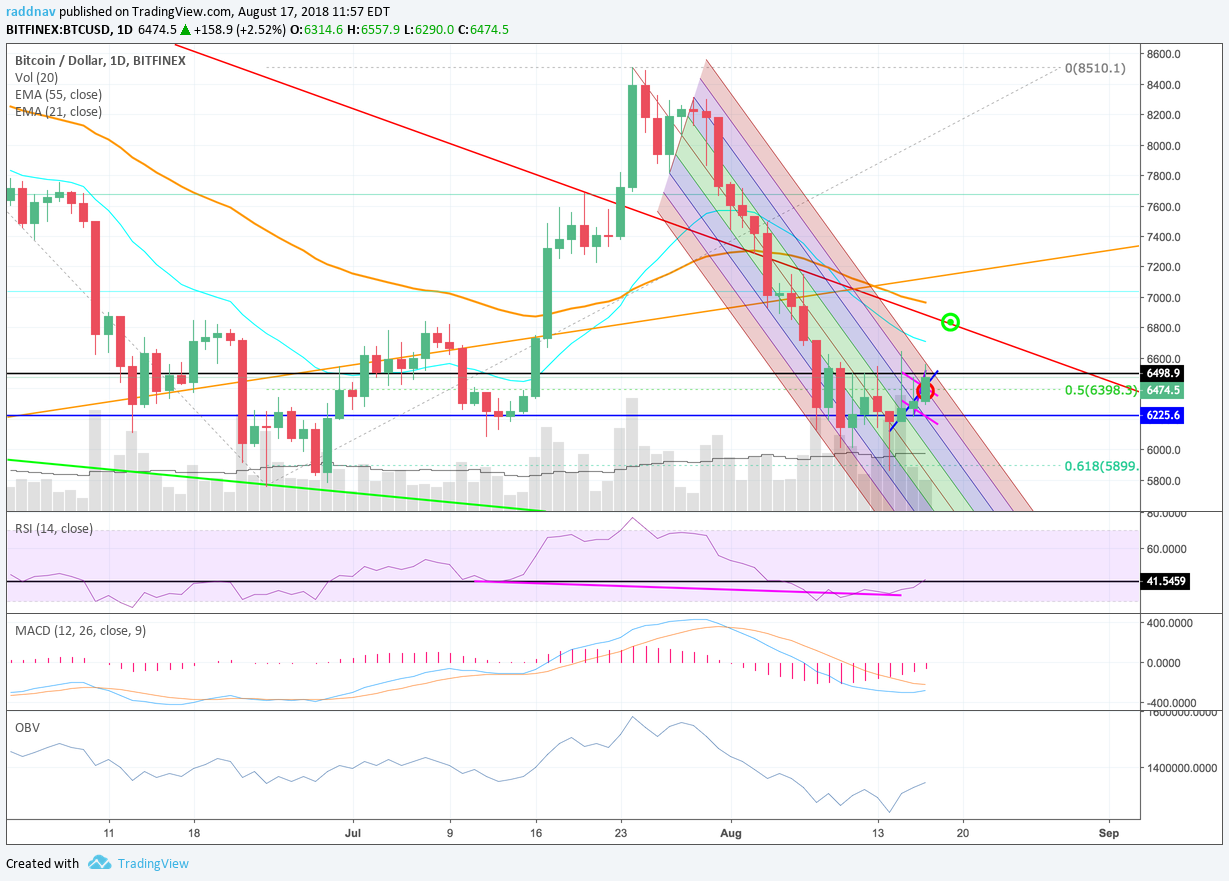 |
| json metadata | {"tags":["bitcoin","btc","cryptocurrency"],"image":["https://cdn.steemitimages.com/DQmNnu9Aix4LbE5HChu1k1j8AjVgBJjxUBxVhMjttnotjUz/image.png","https://cdn.steemitimages.com/DQmY48THAqBh9fNdtuQ4DCkCGyhvLUjU2gQ9aW9qtbed7pe/image.png"],"app":"steemit/0.1","format":"markdown"} |
| parent author | |
| parent permlink | bitcoin |
| permlink | bitcoin-drifting-away-from-down-trending-pitchfork |
| title | Bitcoin Drifting Away from Down-trending Pitchfork |
| Transaction Info | Block #25150959/Trx fac044e25e52270a9dd0145931bb0ce80a83fc61 |
View Raw JSON Data
{
"block": 25150959,
"op": [
"comment",
{
"author": "vanddar4",
"body": "On the hourly Bitcoin Bitfinex chart, I have been tracking this down-trending pitchfork that started back on July 24th and price has been moving outside of it for the past 2 days now. Price did dip back inside the upper red channel of the pitchfork, but found support at the orange 55 EMA line as well as the up trending blue line I have drawn. \n\nThere have now been about 3 retests on the outside of the pitchfork that have provided support and price is moving away from this bearish down-trend. That blue line compared to the black horizontal line at $6,500 make an ascending wedge pattern, which typically breaks upward. \n\nOver the past few hours, there are maybe 4 wicks running up through that $6,500 level as the bulls are really putting increasing pressure on the bears. I have also drawn a purple up-trending line showing the price increase since 5pm EST yesterday and giving additional support. \n\nThe orange 55 hour EMA line is sitting below the turquoise 21 hour EMA, which is another bullish sign and the 21 EMA is also providing some price support as well. I have also placed pink two parallel lines that are indicating a bullish flag. Price has broken out of this level, but perhaps needs to retest it again, before heading higher. That could be a level around $6,384.\n\nRSI is relatively neutral here around 55.62 and could head either way. The MACD lines are flat and could roll over bearishly, but are still sitting above the zero bound bullishly. The histogram has a steady down-tick, but has three sets of higher lows, so further downside could prove to be limited here as well. \n\nThe OBV also looks stronger from where prices were earlier in the week and could be a good sign. It would be good for the bulls to see volume increase significantly again on any price breaks above that $6,500 level. \n\n\n\nOn the daily analog Bitcoin Bitfinex chart that big hammer candle from August 14th proved to be significant in rejecting that $5,892 level at the long-term .618 Fibonacci retracement and as of now there has been just a steady grind higher. \n\nIf price does breakout higher a good target would be that red down-trending line around $6,800 over the weekend. However, if price does get there and the bulls cannot drive price higher then I would see a potential big head and shoulders top with the neck line at the blue horizontal line at $6,225. \n\nThe bears would like that and we could see shorts begin piling in again. Overall, there are many people looking to short Bitcoin right now as well that may be new to it and looking to take advantage of the potential precipitous breakdown. I could see a big short squeeze occur depending on what the contracts look like when we get to that period.\n\nIdeally, for the bulls a rally back above that orange up-trending line at $7,200 would be hopeful. As of now, price has put in a higher low from June 24th at $5,755 to August 14th at $5,858, which is a good sign for the bulls. \n\nRSI is sitting at 42.99 and presently above the black horizontal support/ resistance line and there is some moderate hidden bullish divergence that I have marked with the pink line there.\n\nThe MACD EMAs are curling upward bullishly and the histogram is ticking upward as well. It is still below the zero bound, so the momentum is with the bearish still, but things are encouraging in the short-term for the bulls. OBV is trending higher in the short-term as well. \n\n-More on Vanddar.com\n\n",
"json_metadata": "{\"tags\":[\"bitcoin\",\"btc\",\"cryptocurrency\"],\"image\":[\"https://cdn.steemitimages.com/DQmNnu9Aix4LbE5HChu1k1j8AjVgBJjxUBxVhMjttnotjUz/image.png\",\"https://cdn.steemitimages.com/DQmY48THAqBh9fNdtuQ4DCkCGyhvLUjU2gQ9aW9qtbed7pe/image.png\"],\"app\":\"steemit/0.1\",\"format\":\"markdown\"}",
"parent_author": "",
"parent_permlink": "bitcoin",
"permlink": "bitcoin-drifting-away-from-down-trending-pitchfork",
"title": "Bitcoin Drifting Away from Down-trending Pitchfork"
}
],
"op_in_trx": 0,
"timestamp": "2018-08-17T16:03:21",
"trx_id": "fac044e25e52270a9dd0145931bb0ce80a83fc61",
"trx_in_block": 18,
"virtual_op": 0
}2018/08/16 06:17:39
2018/08/16 06:17:39
| author | cheetah |
| body | Hi! I am a robot. I just upvoted you! I found similar content that readers might be interested in: https://www.tradingview.com/chart/BTCUSD/5ivJQ1tN-Bitcoin-Corrective-Wave-Before-New-Lows/ |
| json metadata | |
| parent author | vanddar4 |
| parent permlink | bitcoin-corrective-wave-before-new-lows |
| permlink | cheetah-re-vanddar4bitcoin-corrective-wave-before-new-lows |
| title | |
| Transaction Info | Block #25110456/Trx bbeb612adb06c13a6502079b55b0e545ee55bdff |
View Raw JSON Data
{
  "block": 25110456,
  "op": [
    "comment",
    {
      "author": "cheetah",
      "body": "Hi! I am a robot. I just upvoted you! I found similar content that readers might be interested in:\nhttps://www.tradingview.com/chart/BTCUSD/5ivJQ1tN-Bitcoin-Corrective-Wave-Before-New-Lows/",
      "json_metadata": "",
      "parent_author": "vanddar4",
      "parent_permlink": "bitcoin-corrective-wave-before-new-lows",
      "permlink": "cheetah-re-vanddar4bitcoin-corrective-wave-before-new-lows",
      "title": ""
    }
  ],
  "op_in_trx": 0,
  "timestamp": "2018-08-16T06:17:39",
  "trx_id": "bbeb612adb06c13a6502079b55b0e545ee55bdff",
  "trx_in_block": 14,
  "virtual_op": 0
}cheetahupvoted (0.08%) @vanddar4 / bitcoin-corrective-wave-before-new-lows2018/08/16 06:17:21
cheetahupvoted (0.08%) @vanddar4 / bitcoin-corrective-wave-before-new-lows
2018/08/16 06:17:21
| author | vanddar4 |
| permlink | bitcoin-corrective-wave-before-new-lows |
| voter | cheetah |
| weight | 8 (0.08%) |
| Transaction Info | Block #25110450/Trx b7702ba667c3385a140a1ed81e1a0a4ef86c7504 |
View Raw JSON Data
{
  "block": 25110450,
  "op": [
    "vote",
    {
      "author": "vanddar4",
      "permlink": "bitcoin-corrective-wave-before-new-lows",
      "voter": "cheetah",
      "weight": 8
    }
  ],
  "op_in_trx": 0,
  "timestamp": "2018-08-16T06:17:21",
  "trx_id": "b7702ba667c3385a140a1ed81e1a0a4ef86c7504",
  "trx_in_block": 53,
  "virtual_op": 0
}vanddar4published a new post: bitcoin-corrective-wave-before-new-lows2018/08/15 15:24:12
vanddar4published a new post: bitcoin-corrective-wave-before-new-lows
2018/08/15 15:24:12
| author | vanddar4 |
| body | On the hourly analog Bitcoin Bitfinex chart, you can see how price has been tracking the levels in this downtrending pitchfork quite closely. The pitchfork starts from the pivot high on July 24th and takes the swing low from July 27th to the swing high on July 28th. It has now been over two weeks of price bouncing around in the pitchfork and it is now pressuring the outside of the red channel that could potentially lead to a breakout. However, price did stall around the $6,445 level from 3-5 am EST this morning, with 3 big wicks running through the top of the red channel and pitchfork. The bears put up a big wall there and look to take control over next 24 hours. The trend the past few days for the bears has been to reach lower lows each and every time that price heads south and right now I see no reason to expect otherwise. There is strong bearish hidden continued divergence marked on the RSI indicator with a lime green line, and it appears likely price will at least revisit the $5,885 level, maybe around the top of the upper blue channel in the pitchfork and the .618 bearish Fib Extension. Price was overbought on the hourly RSI earlier today, but has come down to 57.75 currently. The bulls have defended $6,225 at the blue horizontal line well, and that could be a potential bounce point for another small bull rally if RSI resets to oversold levels, but this appears unlikely. The MACD indictor is about to have the blue trigger line break bearishly under the orange EMA line and the histogram is already down ticking below the zero-bound. The OBV is additionally not strengthens much at these level either. 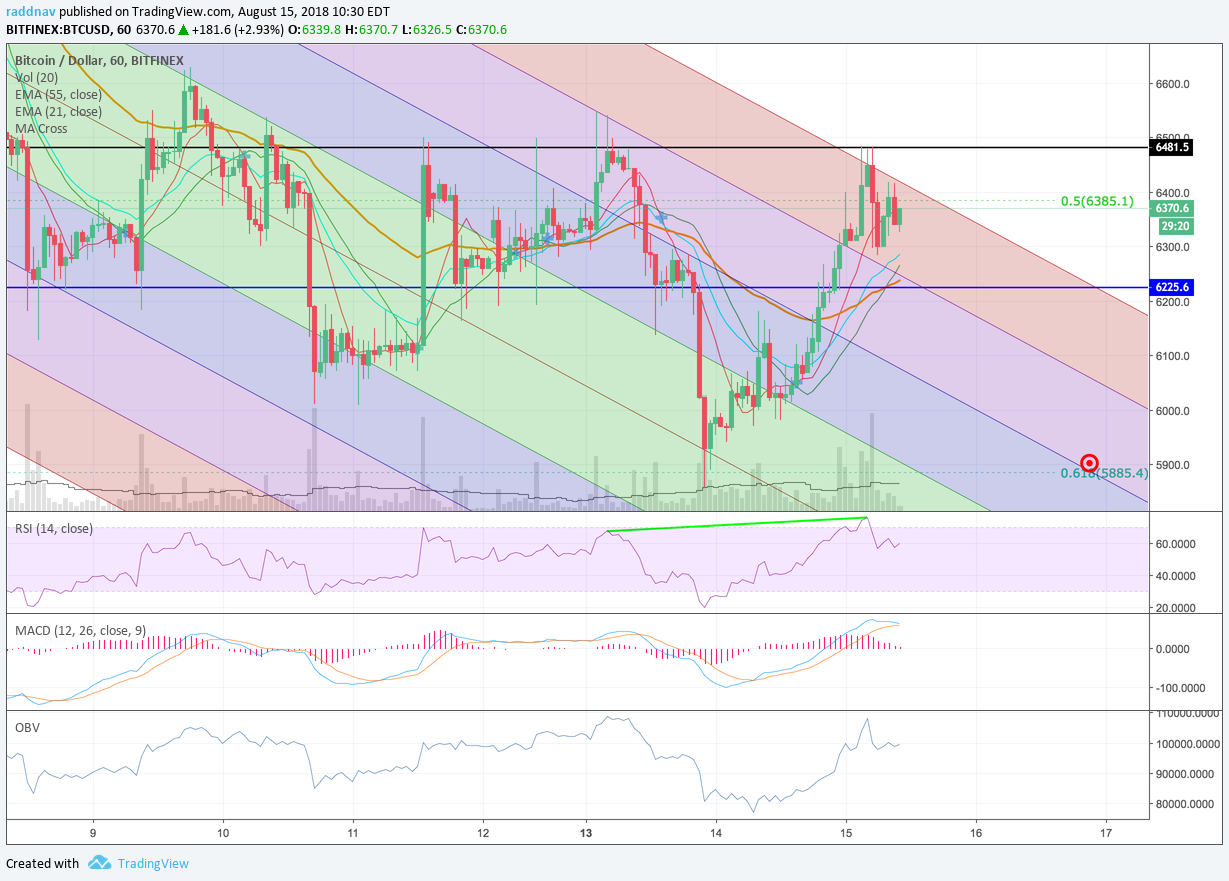 On the daily analog Bitcoin Bitfinex chart, you see the bulls efforts yesterday to defend that $5,892, where there is a big hammer candle placed in there and a subsequent bullish rally up to $6,481 level. It will be interesting to see where today’s candle ends up because I don’t think it will remain so bullish. It is nice to see the volume remaining relatively strong and the bearish volume decreasing slightly in respect to other recent big red candles, but I think the bears are waiting to see how well the bulls defend this positions first. It is possible that price does rally over the next 3-5 days back up to the red long-term downtrend line at the $6,700 - $6,800 and we end up with a corrective wave before another wave down downwards to the lime green support line at the .786 Fib Extension at $5,181. The turquoise line on the RSI indicator is still a reminder of that strong hidden bearish divergence related to price. RSI tapped 30.79 on August 8th and has had a tiny bit of bullish reversal divergence from there, but it would be nice if price could have a new closing low with the RSI giving a higher low to confirm that. MACD does appear decent for a bull rally where the blue and orange lines are converging again, but it still has bearish momentum on the southern side of the zero bound and could continue lower. OBV has really dropped off, and does not look great either. I am staying out of this for now to wait and see if we can get some more conclusive information. -More on vanddar.com 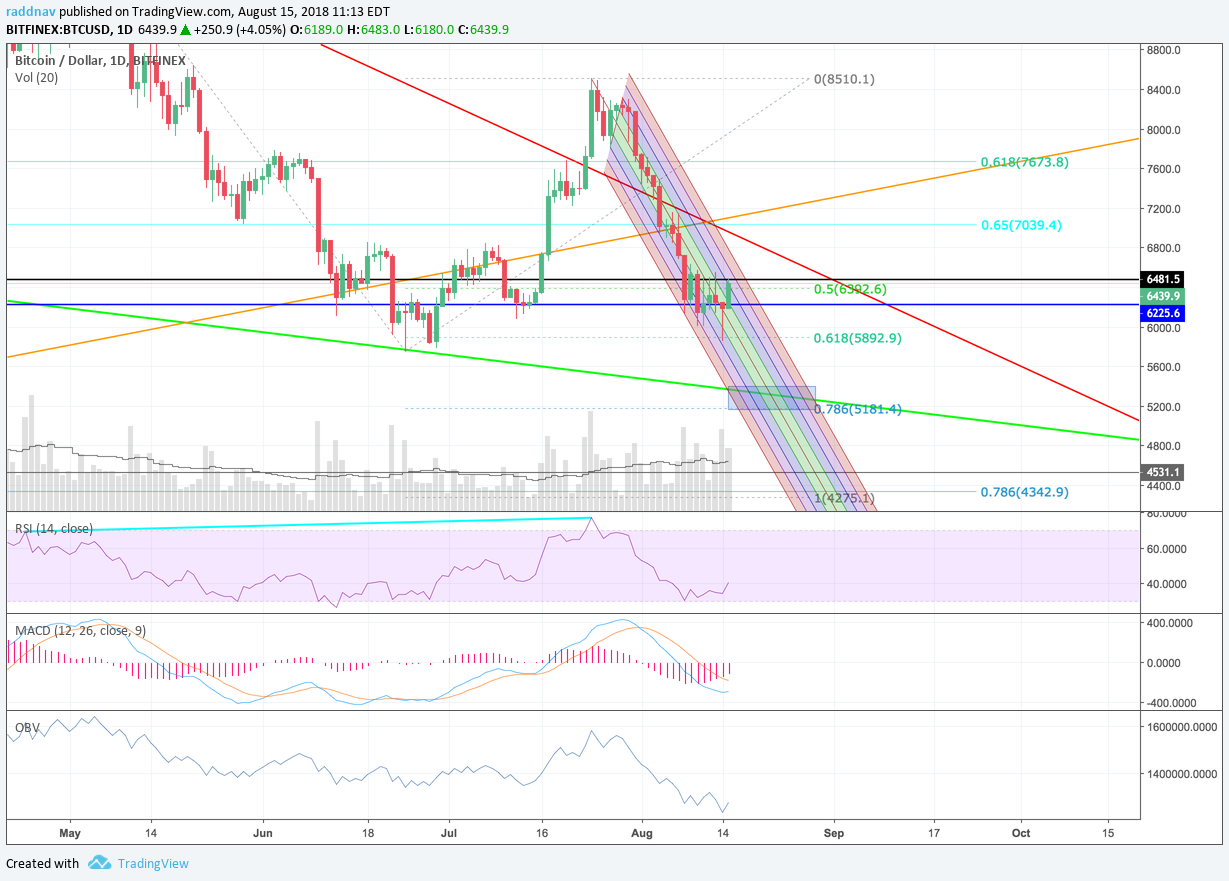 |
| json metadata | {"tags":["btc","bitcoin","cryptocurrency"],"image":["https://cdn.steemitimages.com/DQmYWSLvrnx9avtYsuMRwNaDbrHzff38DAEbWas38ErVbpL/image.png","https://cdn.steemitimages.com/DQmV2WLGJeePgYEhJgscwzaCqVrsJ5iGEuXtxz2eiPFMVtk/image.png"],"app":"steemit/0.1","format":"markdown"} |
| parent author | |
| parent permlink | btc |
| permlink | bitcoin-corrective-wave-before-new-lows |
| title | Bitcoin Corrective Wave Before New Lows? |
| Transaction Info | Block #25092591/Trx 5a1d4fc8172e879c330fb47c75b5aac1f4f0fcb4 |
View Raw JSON Data
{
"block": 25092591,
"op": [
"comment",
{
"author": "vanddar4",
"body": "On the hourly analog Bitcoin Bitfinex chart, you can see how price has been tracking the levels in this downtrending pitchfork quite closely. The pitchfork starts from the pivot high on July 24th and takes the swing low from July 27th to the swing high on July 28th.\n\nIt has now been over two weeks of price bouncing around in the pitchfork and it is now pressuring the outside of the red channel that could potentially lead to a breakout. However, price did stall around the $6,445 level from 3-5 am EST this morning, with 3 big wicks running through the top of the red channel and pitchfork. The bears put up a big wall there and look to take control over next 24 hours.\n\nThe trend the past few days for the bears has been to reach lower lows each and every time that price heads south and right now I see no reason to expect otherwise. \n\nThere is strong bearish hidden continued divergence marked on the RSI indicator with a lime green line, and it appears likely price will at least revisit the $5,885 level, maybe around the top of the upper blue channel in the pitchfork and the .618 bearish Fib Extension. \n\nPrice was overbought on the hourly RSI earlier today, but has come down to 57.75 currently. The bulls have defended $6,225 at the blue horizontal line well, and that could be a potential bounce point for another small bull rally if RSI resets to oversold levels, but this appears unlikely.\n\nThe MACD indictor is about to have the blue trigger line break bearishly under the orange EMA line and the histogram is already down ticking below the zero-bound. The OBV is additionally not strengthens much at these level either.\n\n\n\nOn the daily analog Bitcoin Bitfinex chart, you see the bulls efforts yesterday to defend that $5,892, where there is a big hammer candle placed in there and a subsequent bullish rally up to $6,481 level. It will be interesting to see where today’s candle ends up because I don’t think it will remain so bullish.\n\nIt is nice to see the volume remaining relatively strong and the bearish volume decreasing slightly in respect to other recent big red candles, but I think the bears are waiting to see how well the bulls defend this positions first. \n\nIt is possible that price does rally over the next 3-5 days back up to the red long-term downtrend line at the $6,700 - $6,800 and we end up with a corrective wave before another wave down downwards to the lime green support line at the .786 Fib Extension at $5,181.\n\nThe turquoise line on the RSI indicator is still a reminder of that strong hidden bearish divergence related to price. RSI tapped 30.79 on August 8th and has had a tiny bit of bullish reversal divergence from there, but it would be nice if price could have a new closing low with the RSI giving a higher low to confirm that. \n\nMACD does appear decent for a bull rally where the blue and orange lines are converging again, but it still has bearish momentum on the southern side of the zero bound and could continue lower. \n\nOBV has really dropped off, and does not look great either. I am staying out of this for now to wait and see if we can get some more conclusive information.\n\n-More on vanddar.com\n\n",
"json_metadata": "{\"tags\":[\"btc\",\"bitcoin\",\"cryptocurrency\"],\"image\":[\"https://cdn.steemitimages.com/DQmYWSLvrnx9avtYsuMRwNaDbrHzff38DAEbWas38ErVbpL/image.png\",\"https://cdn.steemitimages.com/DQmV2WLGJeePgYEhJgscwzaCqVrsJ5iGEuXtxz2eiPFMVtk/image.png\"],\"app\":\"steemit/0.1\",\"format\":\"markdown\"}",
"parent_author": "",
"parent_permlink": "btc",
"permlink": "bitcoin-corrective-wave-before-new-lows",
"title": "Bitcoin Corrective Wave Before New Lows?"
}
],
"op_in_trx": 0,
"timestamp": "2018-08-15T15:24:12",
"trx_id": "5a1d4fc8172e879c330fb47c75b5aac1f4f0fcb4",
"trx_in_block": 27,
"virtual_op": 0
}tondorupvoted (100.00%) @vanddar4 / bitcoin-clinging-to-786-fibonacci-level2018/08/09 21:02:12
tondorupvoted (100.00%) @vanddar4 / bitcoin-clinging-to-786-fibonacci-level
2018/08/09 21:02:12
| author | vanddar4 |
| permlink | bitcoin-clinging-to-786-fibonacci-level |
| voter | tondor |
| weight | 10000 (100.00%) |
| Transaction Info | Block #24926605/Trx 32b66512a44068f2bc6eb4645cd81e1db4c1b96a |
View Raw JSON Data
{
  "block": 24926605,
  "op": [
    "vote",
    {
      "author": "vanddar4",
      "permlink": "bitcoin-clinging-to-786-fibonacci-level",
      "voter": "tondor",
      "weight": 10000
    }
  ],
  "op_in_trx": 0,
  "timestamp": "2018-08-09T21:02:12",
  "trx_id": "32b66512a44068f2bc6eb4645cd81e1db4c1b96a",
  "trx_in_block": 2,
  "virtual_op": 0
}vanddar4published a new post: bitcoin-capitulation-event-and-fake-out-expected-on-weekly2018/08/09 20:52:57
vanddar4published a new post: bitcoin-capitulation-event-and-fake-out-expected-on-weekly
2018/08/09 20:52:57
| author | vanddar4 |
| body | On the hourly Bitcoin Bitfinex chart, we are looking at the beginnings of a decent consolidation and possibly accumulation pattern. Price stabilized for the majority of the past 24 hours around $6,300, while a blue ascending triangle formed with the resistance sitting at the .786 Fib retracement at $6,343. Price then began to roll over earlier this morning on weakening volume and a fake-out occurred with price bouncing off the lower end of the green channel. With that, the bulls went on a bit of offense taking price back up to the orange 55 hour EMA line at $6,523. The bears won’t relinquish much more ground from there though as we now have 3 wicks poking up through that level. I would expect price to move back down and test that turquoise 21 hour EMA line first, before maybe another attempt to break through the 55 EMA line. A crossover of the 21 EMA back above the 55 EMA would be a positive sign for further bull relief and I think we could see a situation where price possibility rallies back to the outside of the blue channel within the pitchfork at the green target. Overall though the trend still remains in the bears favor. The volume that the bulls mounted earlier today was not enough to top the bearish volume yesterday. If price does roll over and not hold that $6,340 level at the blue horizontal line we could see another torrent of selling. The RSI is sitting at 56.76 and appears reset for lower lows, the MACD blue trigger line looks like it could begin to cross over and head down and the histogram is already reflecting that too. 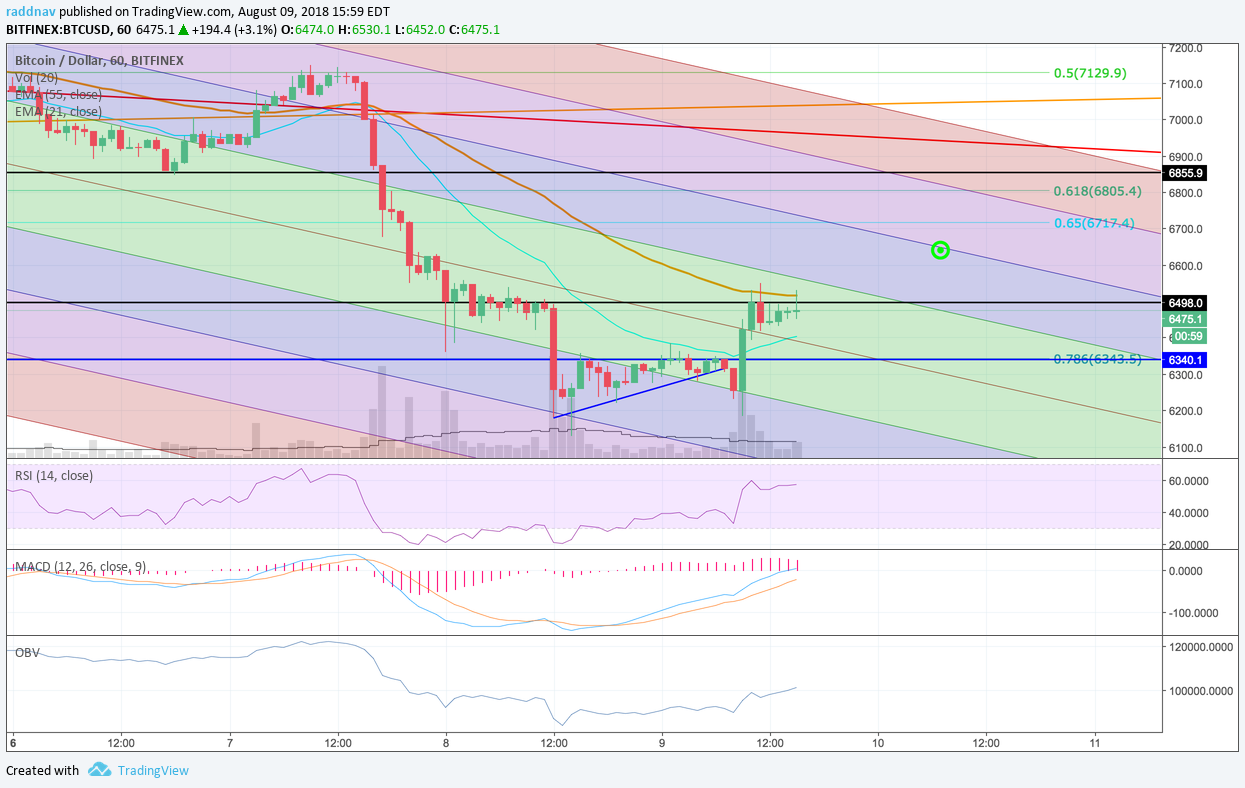 Today I want to take a look at the weekly analog Bitcoin Bitfinex chart, because it’s been a while. I have drawn a Fibonacci Retracement from the flash crash low from the week of February 10th, 2014 to the peak in December and you can see how that golden area between green .618 and turquoise .65 Fib has been broken. Price gave a decisive bearish engulfing candle last week and this week has had some good follow-through, however we are back this floor that the bulls have put up around the $6,400 to $6,000. Depending on how you look at it, it could be a descending triangle that could break lower or a falling wedge that could possibly break higher. There have been 3 touches on either sides of these formation, so price is bound to break one way or the other in the next few weeks. In conjunction with the theme of 2018, the blue .786 level is down around $4,343, and the other theme has been these fake-outs that we just mapped out on the hourly chart where price breaks one way and heads the other. I am wondering if we could see some sort of break down out of this triangle to the .786 Fib only to see a violent price rally the other direction. Something that would rip the faces off of the shorts that could have just joined the party. That would provide a great capitulation event for all the retail investors and a fantastic buying opportunity for the big money waiting to get in the game at a discount. Maybe it’s even set off by a ETF approval event. The RSI is relatively neutral sitting at 44.37 and it would be nice to see a touch of the oversold level at 30 before the next leg up. The MACD is also looks set to break higher as well as soon as that blue trigger line can cross over the orange one. The MACD histogram hasn’t ticked above the zero bound since Jan 22nd 2018 and the last time it was negative besides this bear market was Oct 2016. This actually could be similar price action to Dec 2014 when the blue trigger line almost crossed over but headed lower for one more leg down before moving up and decisively crossing through. This would also coincide with one more big capitulation event. -More on Vanddar.com 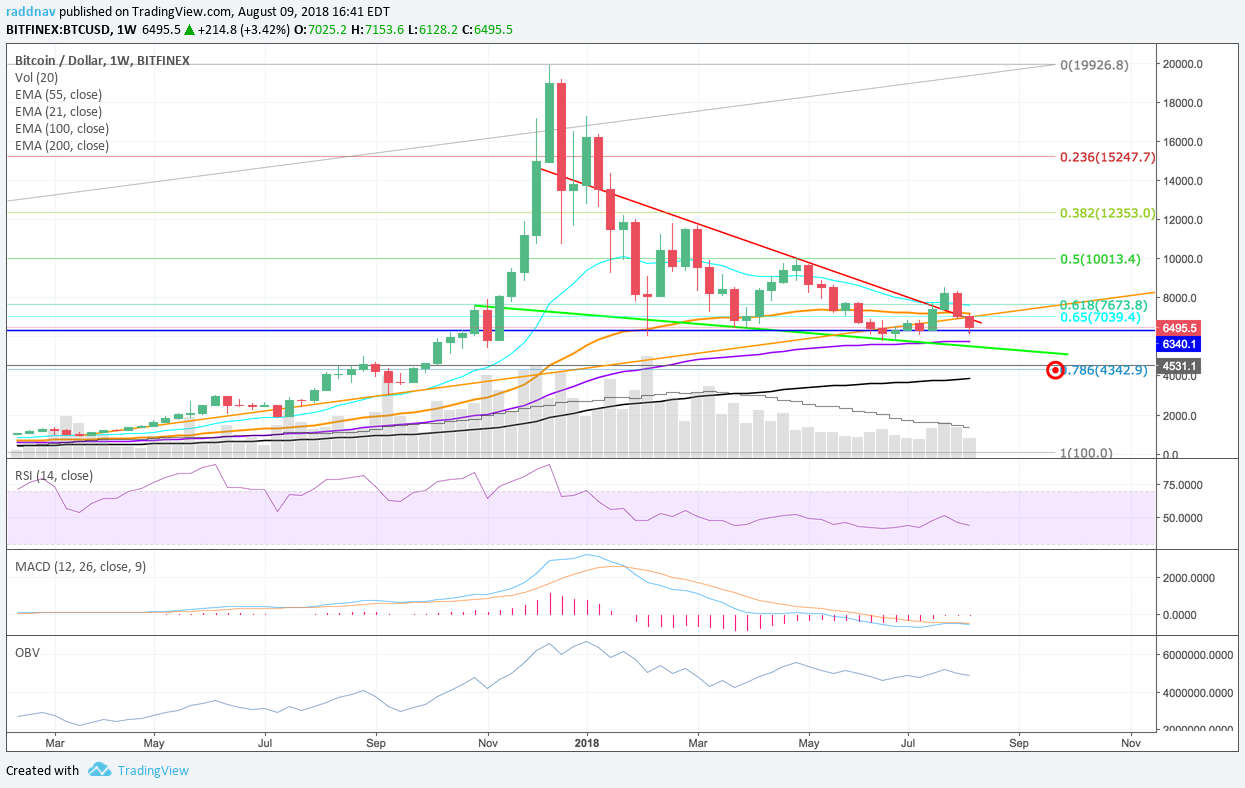 |
| json metadata | {"tags":["bitcoin","btc","cryptocurrency"],"image":["https://cdn.steemitimages.com/DQmc1TMFgsbgngWUfD8y3qugtJ6vGTsBHb99igKBsVobdrC/image.png","https://cdn.steemitimages.com/DQmU37JYkZbnBVomPDNtLLj1DU9HjaZJPWoPN4eEDADowkA/image.png"],"app":"steemit/0.1","format":"markdown"} |
| parent author | |
| parent permlink | bitcoin |
| permlink | bitcoin-capitulation-event-and-fake-out-expected-on-weekly |
| title | Bitcoin Capitulation Event and Fake-out Expected on Weekly? |
| Transaction Info | Block #24926420/Trx f0de65adbc1240e5f83163b3c664c98a85acbd82 |
View Raw JSON Data
{
"block": 24926420,
"op": [
"comment",
{
"author": "vanddar4",
"body": "On the hourly Bitcoin Bitfinex chart, we are looking at the beginnings of a decent consolidation and possibly accumulation pattern. Price stabilized for the majority of the past 24 hours around $6,300, while a blue ascending triangle formed with the resistance sitting at the .786 Fib retracement at $6,343. Price then began to roll over earlier this morning on weakening volume and a fake-out occurred with price bouncing off the lower end of the green channel.\n\nWith that, the bulls went on a bit of offense taking price back up to the orange 55 hour EMA line at $6,523. The bears won’t relinquish much more ground from there though as we now have 3 wicks poking up through that level. \n\nI would expect price to move back down and test that turquoise 21 hour EMA line first, before maybe another attempt to break through the 55 EMA line. A crossover of the 21 EMA back above the 55 EMA would be a positive sign for further bull relief and I think we could see a situation where price possibility rallies back to the outside of the blue channel within the pitchfork at the green target.\n\nOverall though the trend still remains in the bears favor. The volume that the bulls mounted earlier today was not enough to top the bearish volume yesterday. If price does roll over and not hold that $6,340 level at the blue horizontal line we could see another torrent of selling.\n\nThe RSI is sitting at 56.76 and appears reset for lower lows, the MACD blue trigger line looks like it could begin to cross over and head down and the histogram is already reflecting that too.\n\n\n\nToday I want to take a look at the weekly analog Bitcoin Bitfinex chart, because it’s been a while. I have drawn a Fibonacci Retracement from the flash crash low from the week of February 10th, 2014 to the peak in December and you can see how that golden area between green .618 and turquoise .65 Fib has been broken. \n\nPrice gave a decisive bearish engulfing candle last week and this week has had some good follow-through, however we are back this floor that the bulls have put up around the $6,400 to $6,000. Depending on how you look at it, it could be a descending triangle that could break lower or a falling wedge that could possibly break higher. There have been 3 touches on either sides of these formation, so price is bound to break one way or the other in the next few weeks. \n\nIn conjunction with the theme of 2018, the blue .786 level is down around $4,343, and the other theme has been these fake-outs that we just mapped out on the hourly chart where price breaks one way and heads the other. \n\nI am wondering if we could see some sort of break down out of this triangle to the .786 Fib only to see a violent price rally the other direction. Something that would rip the faces off of the shorts that could have just joined the party. \n\nThat would provide a great capitulation event for all the retail investors and a fantastic buying opportunity for the big money waiting to get in the game at a discount. Maybe it’s even set off by a ETF approval event.\n\nThe RSI is relatively neutral sitting at 44.37 and it would be nice to see a touch of the oversold level at 30 before the next leg up. The MACD is also looks set to break higher as well as soon as that blue trigger line can cross over the orange one. \n\nThe MACD histogram hasn’t ticked above the zero bound since Jan 22nd 2018 and the last time it was negative besides this bear market was Oct 2016. This actually could be similar price action to Dec 2014 when the blue trigger line almost crossed over but headed lower for one more leg down before moving up and decisively crossing through. This would also coincide with one more big capitulation event. \n\n-More on Vanddar.com\n\n",
"json_metadata": "{\"tags\":[\"bitcoin\",\"btc\",\"cryptocurrency\"],\"image\":[\"https://cdn.steemitimages.com/DQmc1TMFgsbgngWUfD8y3qugtJ6vGTsBHb99igKBsVobdrC/image.png\",\"https://cdn.steemitimages.com/DQmU37JYkZbnBVomPDNtLLj1DU9HjaZJPWoPN4eEDADowkA/image.png\"],\"app\":\"steemit/0.1\",\"format\":\"markdown\"}",
"parent_author": "",
"parent_permlink": "bitcoin",
"permlink": "bitcoin-capitulation-event-and-fake-out-expected-on-weekly",
"title": "Bitcoin Capitulation Event and Fake-out Expected on Weekly?"
}
],
"op_in_trx": 0,
"timestamp": "2018-08-09T20:52:57",
"trx_id": "f0de65adbc1240e5f83163b3c664c98a85acbd82",
"trx_in_block": 30,
"virtual_op": 0
}vanddar4published a new post: bitcoin-clinging-to-786-fibonacci-level2018/08/09 20:47:48
vanddar4published a new post: bitcoin-clinging-to-786-fibonacci-level
2018/08/09 20:47:48
| author | vanddar4 |
| body | On the hourly analog Bitcoin Bitfinex chart, we have a wonderful bloodbath. The SEC ETF postponement really threw a wrench in the technicals yesterday just as things were beginning to look good for the bulls. Price was halted twice around the purple 100 hour EMA line when the news dropped and price was crushed, way below the orange 55 EMA and turquoise 21 hour EMA. The channels of the pitchfork did very little to slow down the drop as price hurtled below the median line between the two green channels in the evening last night and then continued further with a capitulation dump at noon EST today to the low today of $6,128. There has been a slight recovery over the past few hours here back up to the top of the lower blue channel, but price needs to level off a bit and find some stability while the exponential moving averages catch back up. I have redrawn the Fibonacci Retracement to the low on June 24th and adjusted for the assumption of a full impulse wave to the high up on July 24th. With this new information included price is now sitting at the blue .786 Fib level at $6,342. This Fib level has been quite popular in 2018 thus far and may prove to be again for the bulls. There is strong bullish divergence on the hourly RSI, going through the lows on Aug 4th, late yesterday and today’s low. I have highlighted this with the green line on the RSI, so perhaps there is a bit of a relief rally over the next few hours here at least back to the median line of the pitchfork around $6,475. The momentum on the MACD histogram has been trending upward despite the falling price and it appears like the blue and orange EMAs are attempting to find some support. Volume is looking strong and strengthening on this second drop around noon today, so maybe there is a little more downside momentum for the bears to spit out. 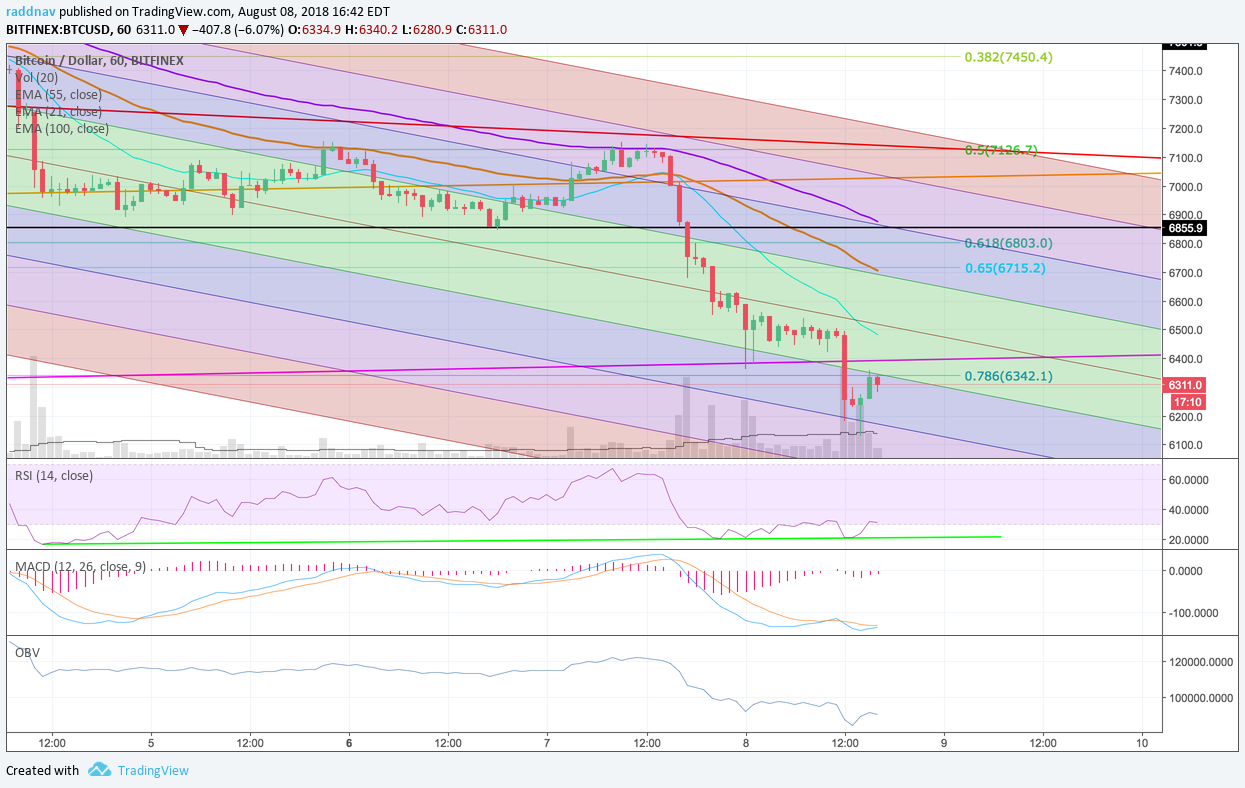 On the daily analog Bitcoin Bitfinex chart, you can see how price did not hold that critical level between $7,100 and $7,000. The retest of the red long-term downtrend line has failed and same with that neck level on the reverse head and shoulder bottom at $6,850. Price is still contained within that down-trending pitchfork but the increasing volume on each leg down over the past few days is troublesome for the bulls. If this $6,342 level cannot be held for the bulls, it looks like the next stop is around $5,750 to $5,500 near that lime green line and the long term potential falling wedge pattern. The RSI is now a shade from oversold levels at 31.19 and that strong hidden bearish divergence from a few weeks ago has turned out to be quite prescient and I have marked it again with the pink line on the RSI. If price can somehow drop to new closing lows here of around $5,850 without giving up much more on the RSI and staying above 26.81, that would be some nice bullish divergence to look forward to. However looking at the current levels, that appears to be asking too much. The MACD has a large gap between the EMA’s and has a strong probably of snapping back hard, but as of now there is no upward momentum for price on this daily chart. The blue trigger line is also breaking back below the zero bound bearishly, which could be contributing to this sell-off. The OBV also has reached new lows for 2018 and shows the dying interest in the market, but this could also be a some sort of retail capitulation event where people are giving up on crypto, despite the hope from a few weeks ago, either way I would expect more volatility ahead. -More on Vanddar.com 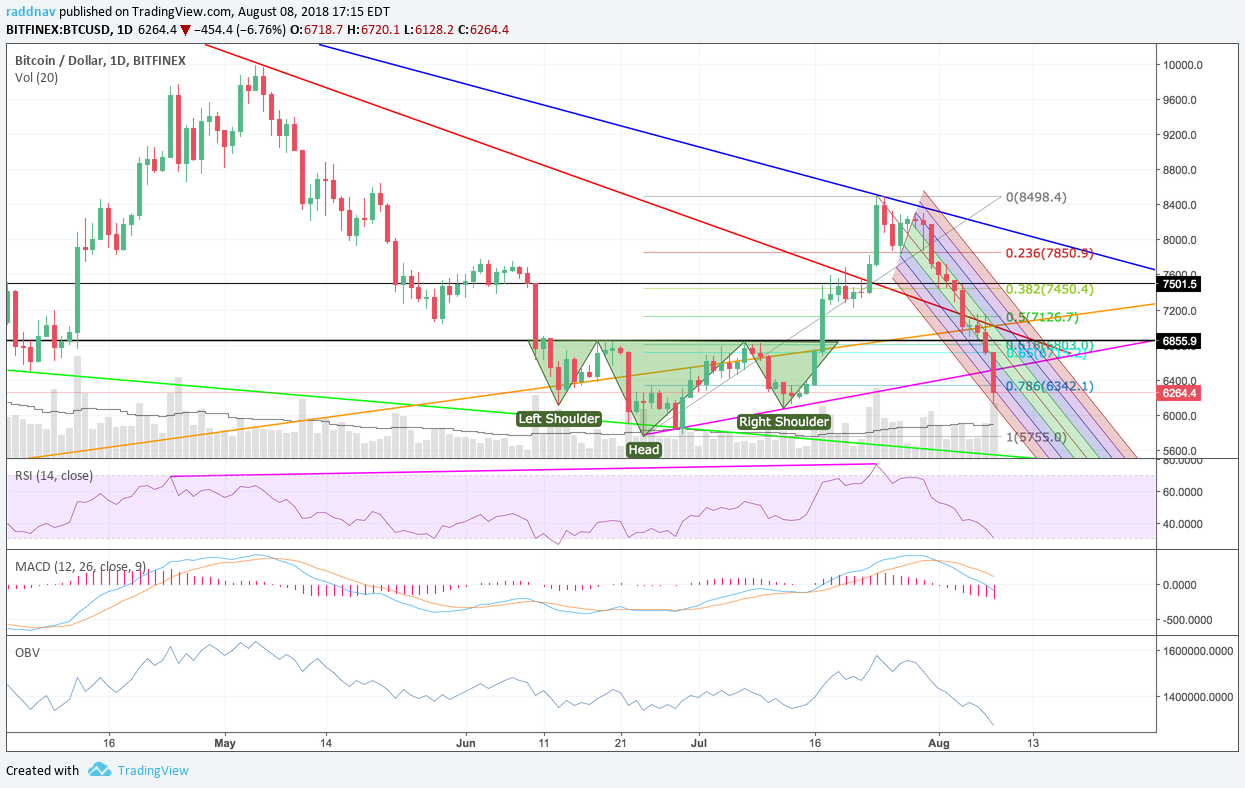 |
| json metadata | {"tags":["btc","bitcoin","cryptocurrency"],"image":["https://cdn.steemitimages.com/DQmabZHw6gxdYyj7BWTcn89ieNjvHoGX8zt7q7n4BG34T1K/image.png","https://cdn.steemitimages.com/DQmT4kdKDEEJ5cugEykdLHQGz2XuDDbse8C9qXYi6Us4kEb/image.png"],"app":"steemit/0.1","format":"markdown"} |
| parent author | |
| parent permlink | btc |
| permlink | bitcoin-clinging-to-786-fibonacci-level |
| title | Bitcoin Clinging to .786 Fibonacci Level |
| Transaction Info | Block #24926317/Trx eb32a9311efec2ee29260e49bde6d11428bc76ac |
View Raw JSON Data
{
"block": 24926317,
"op": [
"comment",
{
"author": "vanddar4",
"body": "On the hourly analog Bitcoin Bitfinex chart, we have a wonderful bloodbath. The SEC ETF postponement really threw a wrench in the technicals yesterday just as things were beginning to look good for the bulls. \n\nPrice was halted twice around the purple 100 hour EMA line when the news dropped and price was crushed, way below the orange 55 EMA and turquoise 21 hour EMA.\n\nThe channels of the pitchfork did very little to slow down the drop as price hurtled below the median line between the two green channels in the evening last night and then continued further with a capitulation dump at noon EST today to the low today of $6,128. \n\nThere has been a slight recovery over the past few hours here back up to the top of the lower blue channel, but price needs to level off a bit and find some stability while the exponential moving averages catch back up.\n\nI have redrawn the Fibonacci Retracement to the low on June 24th and adjusted for the assumption of a full impulse wave to the high up on July 24th. With this new information included price is now sitting at the blue .786 Fib level at $6,342. This Fib level has been quite popular in 2018 thus far and may prove to be again for the bulls.\n\nThere is strong bullish divergence on the hourly RSI, going through the lows on Aug 4th, late yesterday and today’s low. I have highlighted this with the green line on the RSI, so perhaps there is a bit of a relief rally over the next few hours here at least back to the median line of the pitchfork around $6,475.\n\nThe momentum on the MACD histogram has been trending upward despite the falling price and it appears like the blue and orange EMAs are attempting to find some support. Volume is looking strong and strengthening on this second drop around noon today, so maybe there is a little more downside momentum for the bears to spit out.\n\n\n\nOn the daily analog Bitcoin Bitfinex chart, you can see how price did not hold that critical level between $7,100 and $7,000. The retest of the red long-term downtrend line has failed and same with that neck level on the reverse head and shoulder bottom at $6,850.\n\nPrice is still contained within that down-trending pitchfork but the increasing volume on each leg down over the past few days is troublesome for the bulls. If this $6,342 level cannot be held for the bulls, it looks like the next stop is around $5,750 to $5,500 near that lime green line and the long term potential falling wedge pattern.\n\nThe RSI is now a shade from oversold levels at 31.19 and that strong hidden bearish divergence from a few weeks ago has turned out to be quite prescient and I have marked it again with the pink line on the RSI.\n\nIf price can somehow drop to new closing lows here of around $5,850 without giving up much more on the RSI and staying above 26.81, that would be some nice bullish divergence to look forward to. However looking at the current levels, that appears to be asking too much. \n\nThe MACD has a large gap between the EMA’s and has a strong probably of snapping back hard, but as of now there is no upward momentum for price on this daily chart. The blue trigger line is also breaking back below the zero bound bearishly, which could be contributing to this sell-off. \n\nThe OBV also has reached new lows for 2018 and shows the dying interest in the market, but this could also be a some sort of retail capitulation event where people are giving up on crypto, despite the hope from a few weeks ago, either way I would expect more volatility ahead. \n\n-More on Vanddar.com\n\n",
"json_metadata": "{\"tags\":[\"btc\",\"bitcoin\",\"cryptocurrency\"],\"image\":[\"https://cdn.steemitimages.com/DQmabZHw6gxdYyj7BWTcn89ieNjvHoGX8zt7q7n4BG34T1K/image.png\",\"https://cdn.steemitimages.com/DQmT4kdKDEEJ5cugEykdLHQGz2XuDDbse8C9qXYi6Us4kEb/image.png\"],\"app\":\"steemit/0.1\",\"format\":\"markdown\"}",
"parent_author": "",
"parent_permlink": "btc",
"permlink": "bitcoin-clinging-to-786-fibonacci-level",
"title": "Bitcoin Clinging to .786 Fibonacci Level"
}
],
"op_in_trx": 0,
"timestamp": "2018-08-09T20:47:48",
"trx_id": "eb32a9311efec2ee29260e49bde6d11428bc76ac",
"trx_in_block": 56,
"virtual_op": 0
}vanddar4published a new post: bitcoin-battling-of-long-term-trendlines2018/08/07 19:32:21
vanddar4published a new post: bitcoin-battling-of-long-term-trendlines
2018/08/07 19:32:21
| author | vanddar4 |
| body | On the hourly analog Bitcoin Bitfinex chart we have had a good bear trend the past 10 days which taken price from around the $8,200 level down to about $6,900. That’s a $1,300 haircut or about a 16% drop from the highs a few weeks ago. Right now price appears to be consolidating in a range from $6,860 to $7,135 where price has been halted on an advance earlier today. I have drawn a blue rectangle on the chart below that could represent a bearish flag from price dropping from up by $7,500 on Saturday August 4th. Price has not been able to break above the orange 55 EMA on this period bear trend since July 31, until it popped through that level around $7,025 at 3:00am EST this morning. That is an encouraging sign that the ship may be turning into the bulls direction, but the halt at $7,135 in conjunction with the purple 100 EMA line and the long-term red down trending line at about $7,150 will be the important resistance to break. I would anticipate at retest of the orange 55 EMA line around $7,050 before deciding whether to enter any position. I have also drawn a down-trending pitchfork from the pivot high on July 24th to the swing low on July 27th and back to the swing high on July 28th to get an idea of some critical levels on this down-trend. Price has mainly been contained within the purple 1.5 standard deviation range and is currently residing just on the outside of the upper blue channel. A retest of this channel level in convergence with the other indicators at $7,050 over the next few hours appears likely. The RSI level is fairly neutral at 56.88 and is showing some signs of a moderate hidden continued bearish divergence marked with the blue line. Additionally there is some older strong bullish reversal divergence as well. marked with the green line. Perhaps price heads down to test that red target around $6929 sometime tomorrow. The MACD is in decent shape on the positive side of that zero bound line indicating bullish momentum, but the trigger line EMA is curling down bearishly as well as the histogram down ticking. The OBV is also showing a higher balance so which could be a bullish indicator, however I would like to see how much the balance declines over the next few hours here to see if the money sticks around. 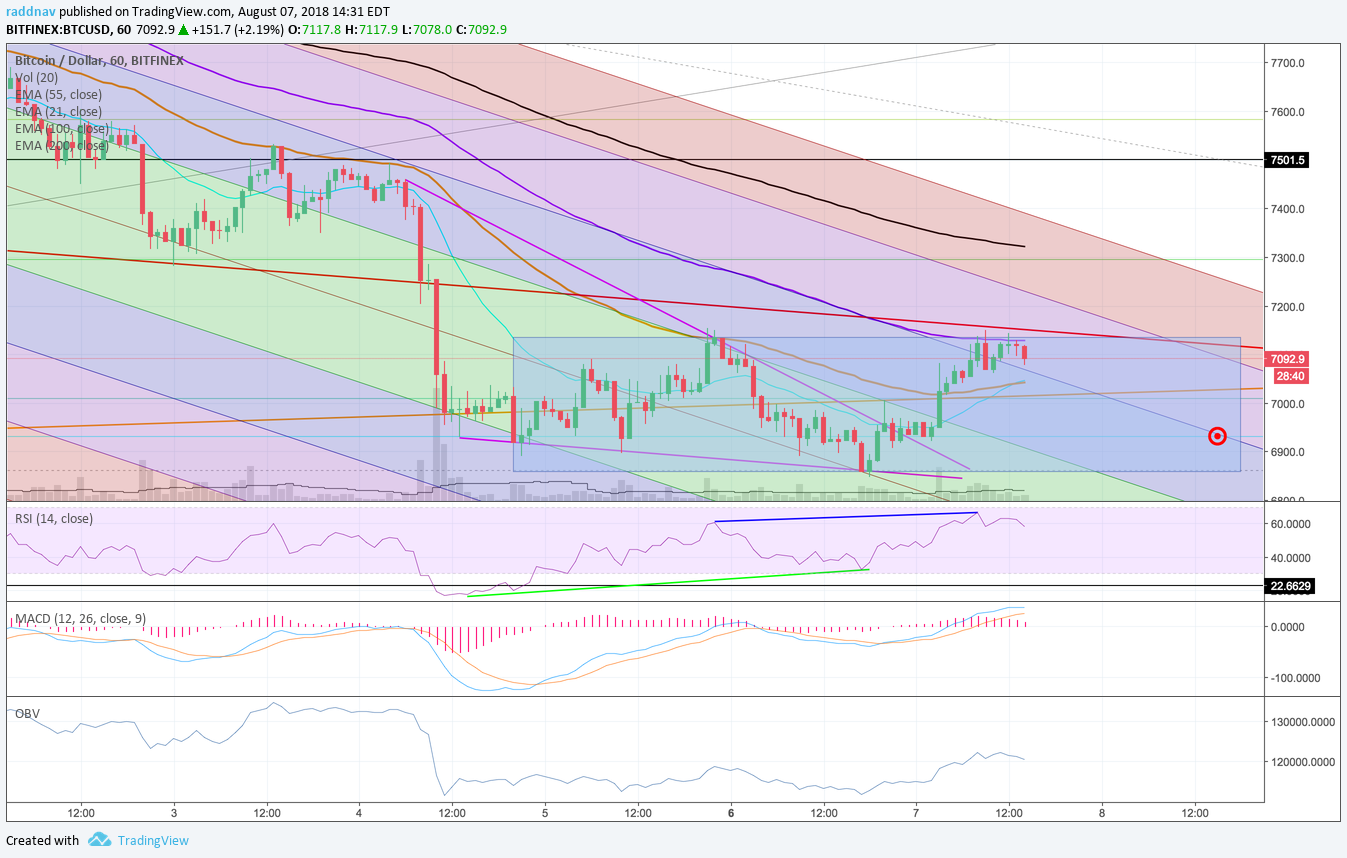 On the daily analog Bitcoin Bitfinex chart, you can see a Fibonacci retracement from the low on July 12th around $6,079 which could be the end of Wave 2 and it stretches all the way up to $8,514, which appears to be Wave 3. There has been a retracement all the way back to the green .618 level at $7,009 and a little beyond it to the .65 level $6,931. Wave 4, which price appears to be on right now, typically will retrace back to wave 1 before beginning a next leg higher. I have drawn a black horizontal line at $6,855 which does not touch it exactly, but could be the end of Wave 4. There is a $8 difference between the Wave 1 high at $6,839 and yesterday’s potential Wave 4 low at $6,847. This is a good sign for the bulls if the Elliot Wave counts hold up. Price is currently running through a very long term orange up-trend line sitting at $7,100 and is just below a long term red down-trending line at $7,191. To say this is a critical level is an understatement and will be very important for what happens next. The orange line dates back to March 25th of 2017 and the red line to December 9th of 2017. Typically the longer duration trend will win out. Price has even broken out of both of these trend lines previously and have come back to revisit these levels. Now price is sitting right in between them with only about 5 days left for this to be resolved. Chances are we see some big volume sometime before this in the next few days to confirm. If price does continue to fall the blue .786 Fib retracement at $6,600 should provide a strong support and would also be in conjunction with the pink support line from the lows on June 24th. The RSI indicator is at 44.41 and is relatively neutral showing some hidden strong continued bullish divergence as marked with the green line. The MACD also has a high probability to turning bullish with a large separation of the down-trending EMAs, and if today’s price holds an uptick on the histogram as well. -More on Vanddar.com 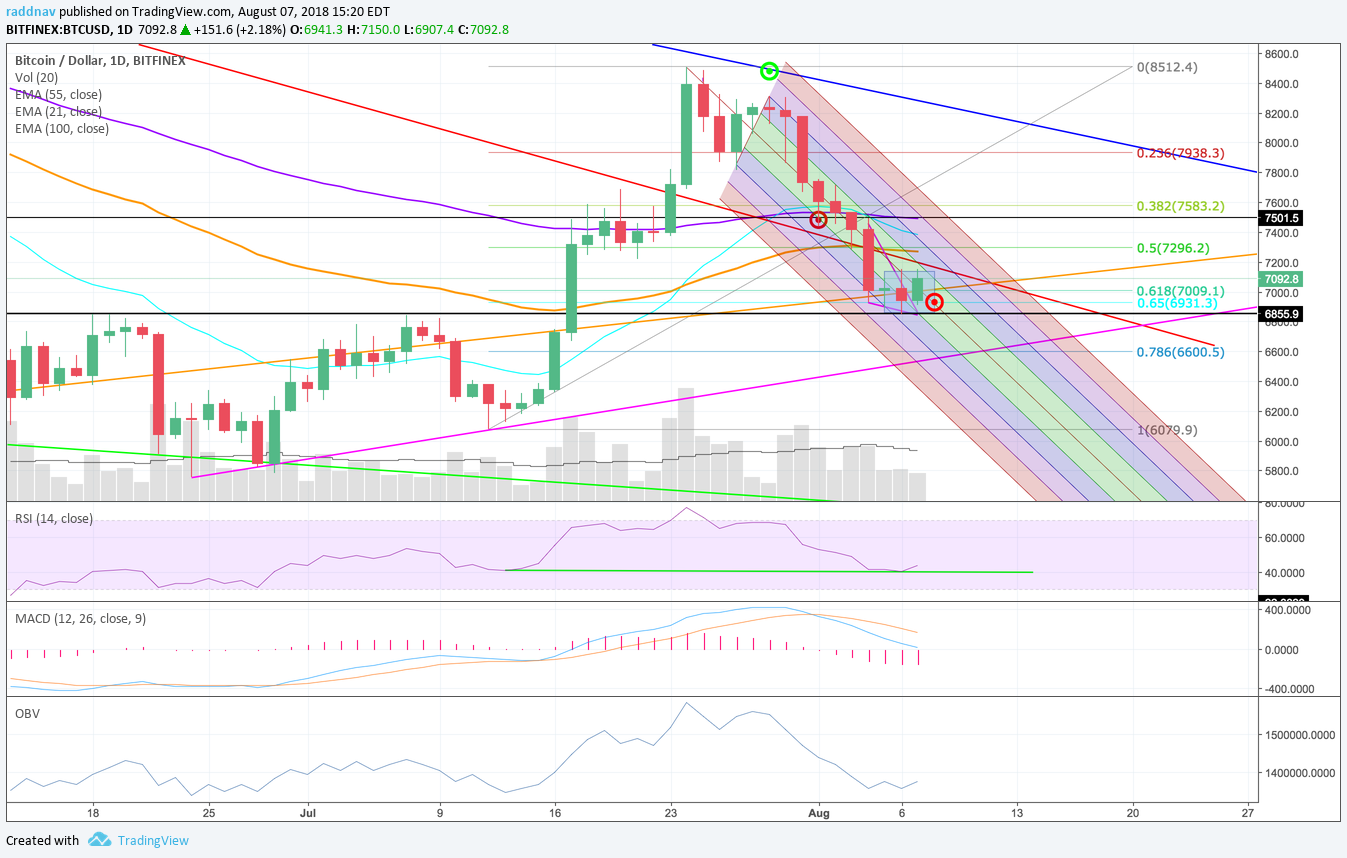 |
| json metadata | {"tags":["bitcoin","btc","cryptocurrency"],"image":["https://cdn.steemitimages.com/DQmUC7YvxY9MroiJapxqdeV7mwUvnuu9yPs1pJh8yFs1vJq/image.png","https://cdn.steemitimages.com/DQmPJrNNBSVx7HhcEf6cxSGncUu9sbxhrudonEpHZLoQ8Zq/image.png"],"app":"steemit/0.1","format":"markdown"} |
| parent author | |
| parent permlink | bitcoin |
| permlink | bitcoin-battling-of-long-term-trendlines |
| title | Bitcoin Battling of Long-term Trendlines |
| Transaction Info | Block #24867246/Trx 3e7ccf9bb561ac98f0c95b197d7dd01b0a967535 |
View Raw JSON Data
{
"block": 24867246,
"op": [
"comment",
{
"author": "vanddar4",
"body": "On the hourly analog Bitcoin Bitfinex chart we have had a good bear trend the past 10 days which taken price from around the $8,200 level down to about $6,900. That’s a $1,300 haircut or about a 16% drop from the highs a few weeks ago.\n\nRight now price appears to be consolidating in a range from $6,860 to $7,135 where price has been halted on an advance earlier today. I have drawn a blue rectangle on the chart below that could represent a bearish flag from price dropping from up by $7,500 on Saturday August 4th. \n\nPrice has not been able to break above the orange 55 EMA on this period bear trend since July 31, until it popped through that level around $7,025 at 3:00am EST this morning. That is an encouraging sign that the ship may be turning into the bulls direction, but the halt at $7,135 in conjunction with the purple 100 EMA line and the long-term red down trending line at about $7,150 will be the important resistance to break. I would anticipate at retest of the orange 55 EMA line around $7,050 before deciding whether to enter any position.\n\nI have also drawn a down-trending pitchfork from the pivot high on July 24th to the swing low on July 27th and back to the swing high on July 28th to get an idea of some critical levels on this down-trend. Price has mainly been contained within the purple 1.5 standard deviation range and is currently residing just on the outside of the upper blue channel. A retest of this channel level in convergence with the other indicators at $7,050 over the next few hours appears likely.\n\nThe RSI level is fairly neutral at 56.88 and is showing some signs of a moderate hidden continued bearish divergence marked with the blue line. Additionally there is some older strong bullish reversal divergence as well. marked with the green line. Perhaps price heads down to test that red target around $6929 sometime tomorrow.\n\nThe MACD is in decent shape on the positive side of that zero bound line indicating bullish momentum, but the trigger line EMA is curling down bearishly as well as the histogram down ticking. The OBV is also showing a higher balance so which could be a bullish indicator, however I would like to see how much the balance declines over the next few hours here to see if the money sticks around.\n\n\n\nOn the daily analog Bitcoin Bitfinex chart, you can see a Fibonacci retracement from the low on July 12th around $6,079 which could be the end of Wave 2 and it stretches all the way up to $8,514, which appears to be Wave 3. \n\nThere has been a retracement all the way back to the green .618 level at $7,009 and a little beyond it to the .65 level $6,931. Wave 4, which price appears to be on right now, typically will retrace back to wave 1 before beginning a next leg higher. \n\nI have drawn a black horizontal line at $6,855 which does not touch it exactly, but could be the end of Wave 4. There is a $8 difference between the Wave 1 high at $6,839 and yesterday’s potential Wave 4 low at $6,847. This is a good sign for the bulls if the Elliot Wave counts hold up.\n\nPrice is currently running through a very long term orange up-trend line sitting at $7,100 and is just below a long term red down-trending line at $7,191. To say this is a critical level is an understatement and will be very important for what happens next. The orange line dates back to March 25th of 2017 and the red line to December 9th of 2017. Typically the longer duration trend will win out.\n\nPrice has even broken out of both of these trend lines previously and have come back to revisit these levels. Now price is sitting right in between them with only about 5 days left for this to be resolved. Chances are we see some big volume sometime before this in the next few days to confirm.\n\nIf price does continue to fall the blue .786 Fib retracement at $6,600 should provide a strong support and would also be in conjunction with the pink support line from the lows on June 24th.\n\nThe RSI indicator is at 44.41 and is relatively neutral showing some hidden strong continued bullish divergence as marked with the green line. The MACD also has a high probability to turning bullish with a large separation of the down-trending EMAs, and if today’s price holds an uptick on the histogram as well. \n\n-More on Vanddar.com\n\n",
"json_metadata": "{\"tags\":[\"bitcoin\",\"btc\",\"cryptocurrency\"],\"image\":[\"https://cdn.steemitimages.com/DQmUC7YvxY9MroiJapxqdeV7mwUvnuu9yPs1pJh8yFs1vJq/image.png\",\"https://cdn.steemitimages.com/DQmPJrNNBSVx7HhcEf6cxSGncUu9sbxhrudonEpHZLoQ8Zq/image.png\"],\"app\":\"steemit/0.1\",\"format\":\"markdown\"}",
"parent_author": "",
"parent_permlink": "bitcoin",
"permlink": "bitcoin-battling-of-long-term-trendlines",
"title": "Bitcoin Battling of Long-term Trendlines"
}
],
"op_in_trx": 0,
"timestamp": "2018-08-07T19:32:21",
"trx_id": "3e7ccf9bb561ac98f0c95b197d7dd01b0a967535",
"trx_in_block": 4,
"virtual_op": 0
}vanddar4published a new post: bitcoin-mixed-signals-hidden-bearish-divergences2018/07/27 22:43:36
vanddar4published a new post: bitcoin-mixed-signals-hidden-bearish-divergences
2018/07/27 22:43:36
| author | vanddar4 |
| body | On the hourly analog Bitcoin Bitfinex chart, we are looking a nice dip and rally over the past 24 hours. While the dip appears to be related to one of the ETF proposals being rejected by the SEC, it also is linked to some usual shorting speculation around the Bitcoin Futures expiration today as well. Since the expiration, price has rallied from $7,840 to a high of $8,291 over just a few hours. The $8,250 to $8,300 level has remained a significant resistance point by the bears, which I have indicated between the two black parallel lines. Price is now getting pinched here between that resistance level and the outside of the up-trending pitchfork on that red channel. The bulls are really knocking on the door for higher prices, but the bears seem pretty entrenched here too. Also, if you take away the ETF news, and futures pricing action, that Bart Simpson pattern over the past 24 hours with the dip and subsequent spike would probably leave price at a similar consolidation level. If you take the low from July 12th and apply a Fibonacci Retracement to the high on July 24th, price has only dipped back down to about the red .236 Fib level at $7,933 that’s not very far for a potential wave 3 Impulse. I still believe the most likely target is down there, around the $7,500 level where the other black horizontal line and red down-trending line are converging. I’ve adjusted that red down-trending line slightly to try and more accurately account for the changes in time frames. The yellowish .382 Fib level at $7,579 could be good for a bounce as well and the red median line of the pitchfork could also provide support. If price does move to the upside, a run towards that blue logarithmic downtrend line and the green target at $8,486 might be close, but a correction is still needed. The RSI is still a bit overbought at 62.58 and I am seeing some hidden bearish divergence between the neck levels of that Bart Simpson pattern, highlighted with an orange line. The MACD histogram is beginning to turn over and that blue trigger line breaking back below the zero bound could also give some momentum back to the bears. The OBV has shown some good strength the past few days, but appears a bit weaker on the pump over the past few hours. 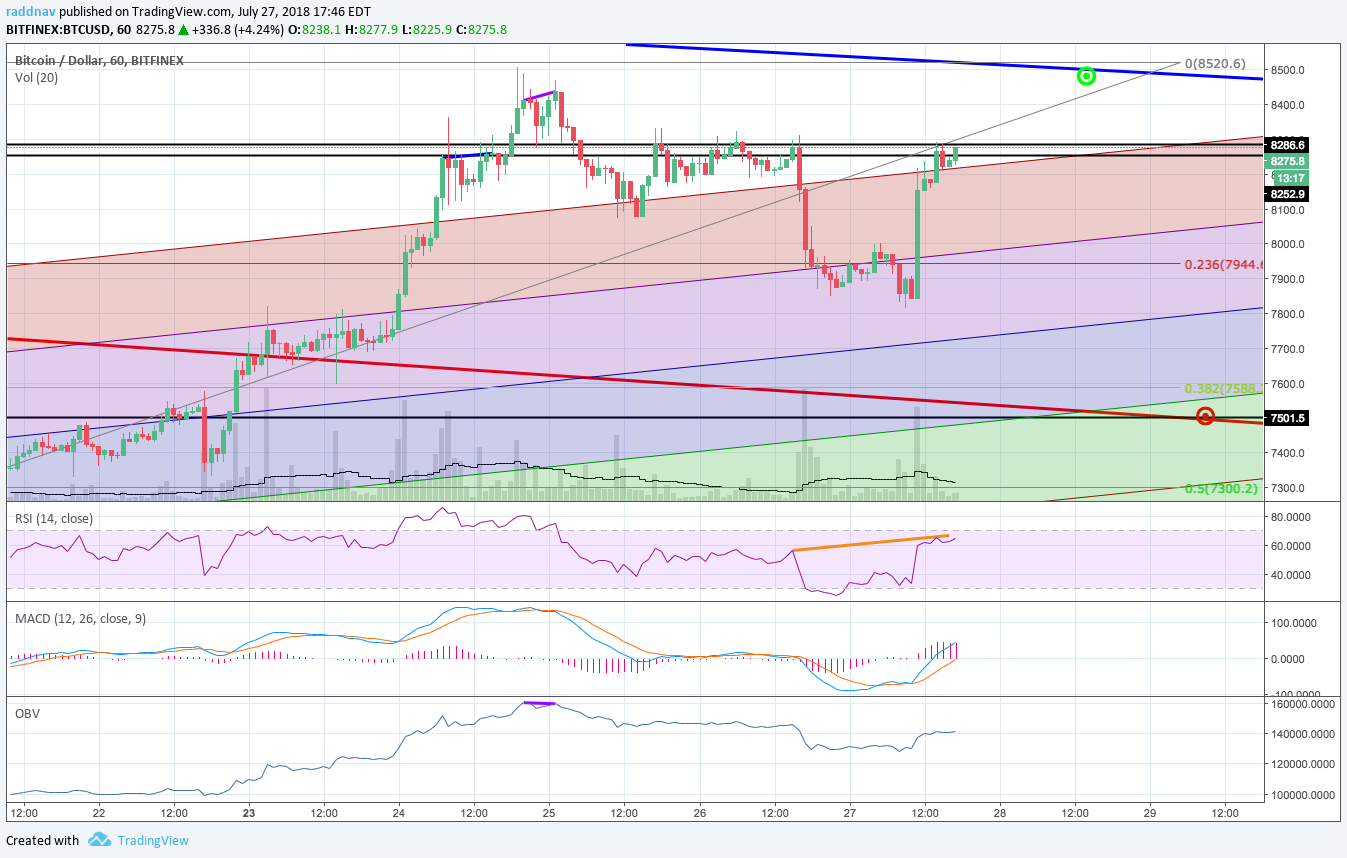 On the daily analog Bitcoin Bitfinex chart, there is a bullish engulfing candle that is forming currently, however today is not over yet. If the $8,170 level can be held for the bulls it could possibly give some strong momentum for a push higher. There could be a situation where the bulls push higher for the remainder of today to only stall at the blue logarithmic downtrend line again around $8,500 and some bearish divergence is then painted on the RSI. I have also drawn a long orange line between the peaks on the RSI indicator and you can see there is some definitive strong hidden bearish divergence with the price lower highs and the indicator higher highs. The other indicators are not showing this divergence yet, but I find the RSI works best. I have also placed a down-trending pitchfork from the pivot swing high of Feb 20th to the swing low of Apr 1st and back to the swing high May 5th to see if price has broken the last downtrend. Sure enough it has, and the interesting thing is the outside of this big down-trending pitchfork converges with with the targets around the $7,500. This pitchfork contained price nicely in the blue channel all throughout May and June as well. It is nice to see volume picking up significantly over the last week or so, and will be important to continue if the bulls hope to turn the tide. If a retest of that $7,500 can happen, I think we could see another rally back up to $9,800 at least. I be working on another project next week, but will try to get a post up. -More on Vanddar.com 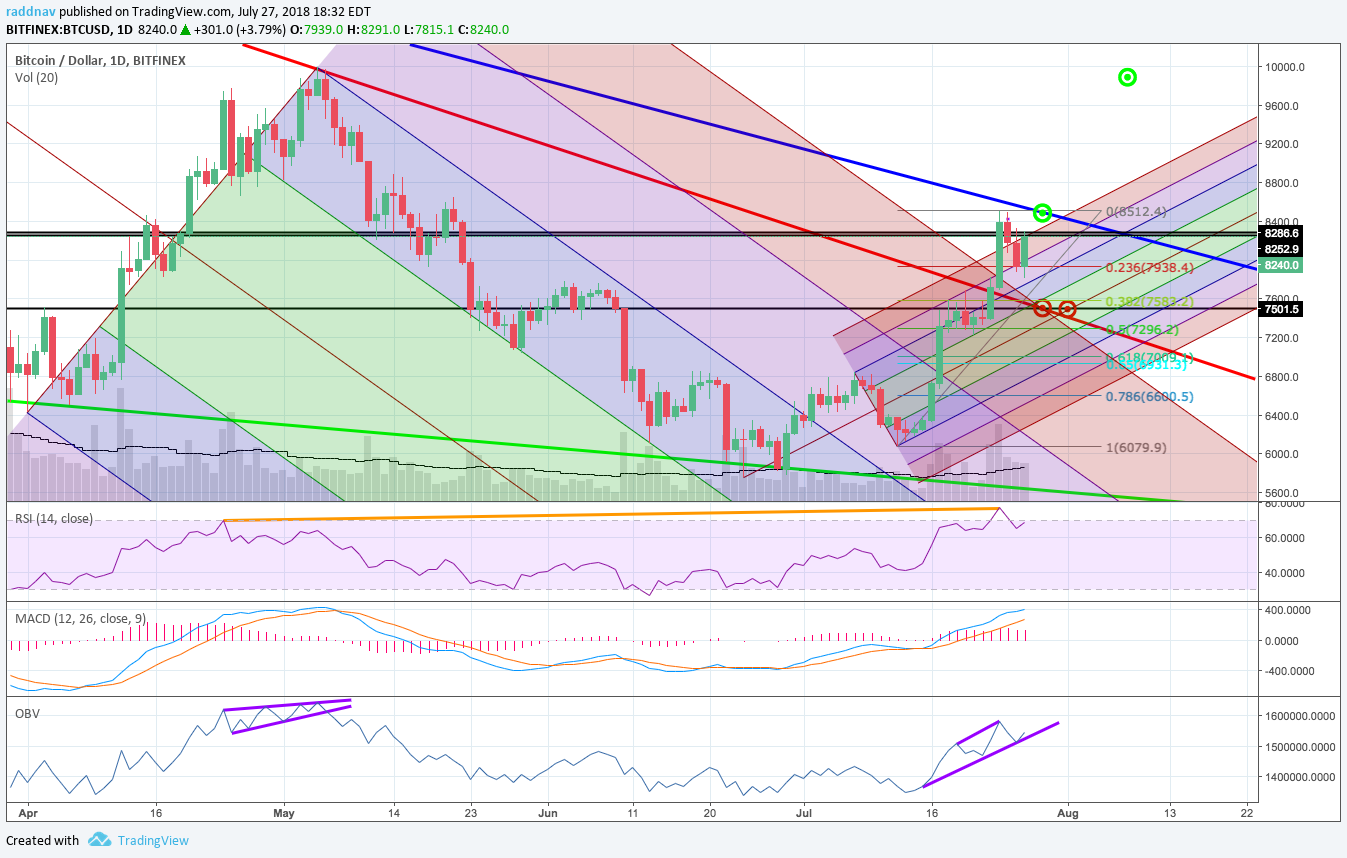 |
| json metadata | {"tags":["btc","bitcoin","cryptocurrency"],"image":["https://cdn.steemitimages.com/DQmXdKN4aaQ234nJu7WvMuGFvu5HUKeAjrGtyojQ2HebCd4/image.png","https://cdn.steemitimages.com/DQmbhKmELemUwfP7JTPv3xwV6jnSw5toHUJc1BFg1Y7idFb/image.png"],"app":"steemit/0.1","format":"markdown"} |
| parent author | |
| parent permlink | btc |
| permlink | bitcoin-mixed-signals-hidden-bearish-divergences |
| title | Bitcoin Mixed Signals: Hidden Bearish Divergences |
| Transaction Info | Block #24554816/Trx 9ad7648bba9ef450abf9749d66a7cd12f193c7b0 |
View Raw JSON Data
{
"block": 24554816,
"op": [
"comment",
{
"author": "vanddar4",
"body": "On the hourly analog Bitcoin Bitfinex chart, we are looking a nice dip and rally over the past 24 hours. While the dip appears to be related to one of the ETF proposals being rejected by the SEC, it also is linked to some usual shorting speculation around the Bitcoin Futures expiration today as well. \n\nSince the expiration, price has rallied from $7,840 to a high of $8,291 over just a few hours. The $8,250 to $8,300 level has remained a significant resistance point by the bears, which I have indicated between the two black parallel lines.\n\nPrice is now getting pinched here between that resistance level and the outside of the up-trending pitchfork on that red channel. The bulls are really knocking on the door for higher prices, but the bears seem pretty entrenched here too. Also, if you take away the ETF news, and futures pricing action, that Bart Simpson pattern over the past 24 hours with the dip and subsequent spike would probably leave price at a similar consolidation level.\n\nIf you take the low from July 12th and apply a Fibonacci Retracement to the high on July 24th, price has only dipped back down to about the red .236 Fib level at $7,933 that’s not very far for a potential wave 3 Impulse.\n\nI still believe the most likely target is down there, around the $7,500 level where the other black horizontal line and red down-trending line are converging. I’ve adjusted that red down-trending line slightly to try and more accurately account for the changes in time frames.\n\nThe yellowish .382 Fib level at $7,579 could be good for a bounce as well and the red median line of the pitchfork could also provide support. If price does move to the upside, a run towards that blue logarithmic downtrend line and the green target at $8,486 might be close, but a correction is still needed.\n\nThe RSI is still a bit overbought at 62.58 and I am seeing some hidden bearish divergence between the neck levels of that Bart Simpson pattern, highlighted with an orange line.\n\nThe MACD histogram is beginning to turn over and that blue trigger line breaking back below the zero bound could also give some momentum back to the bears. The OBV has shown some good strength the past few days, but appears a bit weaker on the pump over the past few hours.\n\n\n\nOn the daily analog Bitcoin Bitfinex chart, there is a bullish engulfing candle that is forming currently, however today is not over yet. If the $8,170 level can be held for the bulls it could possibly give some strong momentum for a push higher.\n\nThere could be a situation where the bulls push higher for the remainder of today to only stall at the blue logarithmic downtrend line again around $8,500 and some bearish divergence is then painted on the RSI. \n\nI have also drawn a long orange line between the peaks on the RSI indicator and you can see there is some definitive strong hidden bearish divergence with the price lower highs and the indicator higher highs. The other indicators are not showing this divergence yet, but I find the RSI works best.\n\nI have also placed a down-trending pitchfork from the pivot swing high of Feb 20th to the swing low of Apr 1st and back to the swing high May 5th to see if price has broken the last downtrend. Sure enough it has, and the interesting thing is the outside of this big down-trending pitchfork converges with with the targets around the $7,500. This pitchfork contained price nicely in the blue channel all throughout May and June as well. \n\nIt is nice to see volume picking up significantly over the last week or so, and will be important to continue if the bulls hope to turn the tide. If a retest of that $7,500 can happen, I think we could see another rally back up to $9,800 at least. I be working on another project next week, but will try to get a post up.\n\n-More on Vanddar.com\n\n",
"json_metadata": "{\"tags\":[\"btc\",\"bitcoin\",\"cryptocurrency\"],\"image\":[\"https://cdn.steemitimages.com/DQmXdKN4aaQ234nJu7WvMuGFvu5HUKeAjrGtyojQ2HebCd4/image.png\",\"https://cdn.steemitimages.com/DQmbhKmELemUwfP7JTPv3xwV6jnSw5toHUJc1BFg1Y7idFb/image.png\"],\"app\":\"steemit/0.1\",\"format\":\"markdown\"}",
"parent_author": "",
"parent_permlink": "btc",
"permlink": "bitcoin-mixed-signals-hidden-bearish-divergences",
"title": "Bitcoin Mixed Signals: Hidden Bearish Divergences"
}
],
"op_in_trx": 0,
"timestamp": "2018-07-27T22:43:36",
"trx_id": "9ad7648bba9ef450abf9749d66a7cd12f193c7b0",
"trx_in_block": 32,
"virtual_op": 0
}sixoneninetimesupvoted (10.00%) @vanddar4 / bitcoin-head-and-shoulders-top-on-hourly2018/07/25 23:08:42
sixoneninetimesupvoted (10.00%) @vanddar4 / bitcoin-head-and-shoulders-top-on-hourly
2018/07/25 23:08:42
| author | vanddar4 |
| permlink | bitcoin-head-and-shoulders-top-on-hourly |
| voter | sixoneninetimes |
| weight | 1000 (10.00%) |
| Transaction Info | Block #24497795/Trx 07136d9a949be939752053657687d77140c2cd17 |
View Raw JSON Data
{
  "block": 24497795,
  "op": [
    "vote",
    {
      "author": "vanddar4",
      "permlink": "bitcoin-head-and-shoulders-top-on-hourly",
      "voter": "sixoneninetimes",
      "weight": 1000
    }
  ],
  "op_in_trx": 0,
  "timestamp": "2018-07-25T23:08:42",
  "trx_id": "07136d9a949be939752053657687d77140c2cd17",
  "trx_in_block": 3,
  "virtual_op": 0
}vanddar4published a new post: bitcoin-head-and-shoulders-top-on-hourly2018/07/25 22:41:42
vanddar4published a new post: bitcoin-head-and-shoulders-top-on-hourly
2018/07/25 22:41:42
| author | vanddar4 |
| body | On the hourly analog Bitcoin Bitfinex snapshot we have a nice rally from where we last left off yesterday where price spring-boarded from this $8,250 level all the way up to the turquoise .65 retracement at $8,500. Volume started to slow down overnight and headed southward to $8,080 at 2pm EST today. Price is now bouncing on the outside of the up-trending and heading back through that black horizontal line at $8,275. I think that price could continue a little bit higher over the next few hours here, possibly back to that .618 green Fibonacci retracement level, but then it would be critical to look for some resistance. There could be an inverse head and shoulders top forming over the last two days, which I have included on the snapshot. Just as price rebounded efficiently from the inverse head and shoulders on the daily chart a week or two ago, the opposite could be true on this hourly chart. Price would not move as much on a validated head and shoulders top here, but it could be enough to take it back down to the red down-trending line at $7,750 or possibly all the way back to the $7,500 black horizontal support level. I have also moved the target accordingly. Both levels would be a nice range for price to consolidate for a few days before the next big move. The RSI here reset down to 38.22 from the lows of 8,080 earlier today, but is already passing neutral territory at 57.39 on the move over the last few hours. An uptick in volume here should be enough to authenticate that head and shoulders top if the bears can hold it. There is also some bearish reversal divergence from price on the RSI and OBV as indicated by the purple trend lines. The MACD is bearishly trending downward and is about to swing below the zero bound into bearish momentum. It’s trending upward the last few hours here, but I do not think it will last. 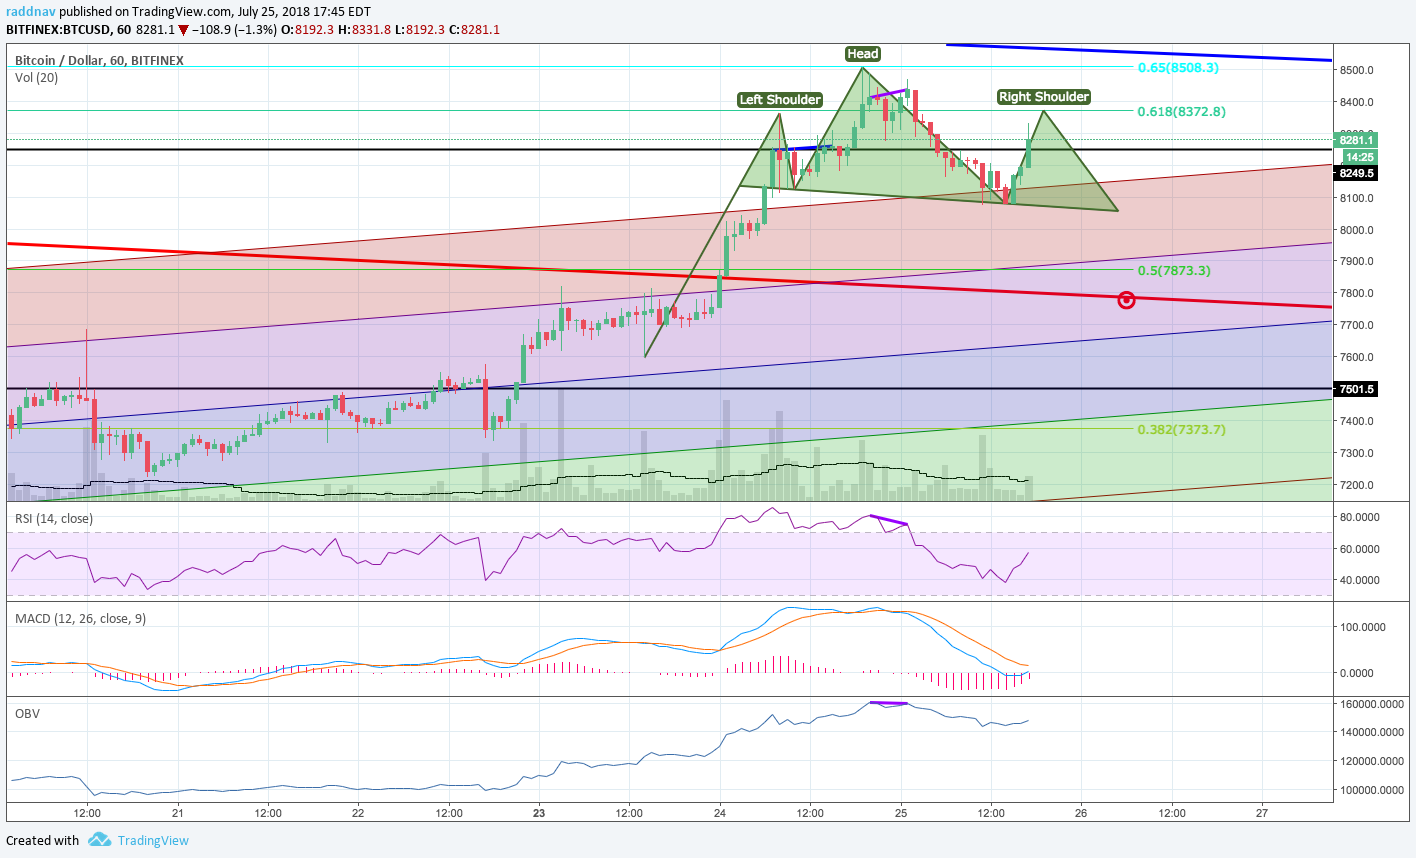 On the daily analog Bitcoin Bitfinex chart, you can see today’s candle currently holding above that $8,250 as support. Ideally some consolidation between the black lines between $8,250 and $7,500 would be a healthy development. Price definitely needs to revisit this red down-trending line though to test the resolve of the bulls for their higher prices. Since price is now above the 200 day EMA at $7,869, that would naturally be a good support level as well, just like it was for a few days back in April. The RSI has topped out well into overbought territory currently sitting at 73.57 and is due to retrace the next few days. I don’t think this bullish trend has completed yet, but some pullback and consolidation is needed to reposition for the next move. The MACD also looks almost too optimistic and ready to flatten out a little in the short-term. The OBV is trending upward still as highlighted by the lines of that purple channel, which is a good sign for the bulls and any break of that line would not be a good. I find it interesting that even though the OBV did not indicate any bearish divergence back in late April and May there was a defined rising wedge pattern that was broken. 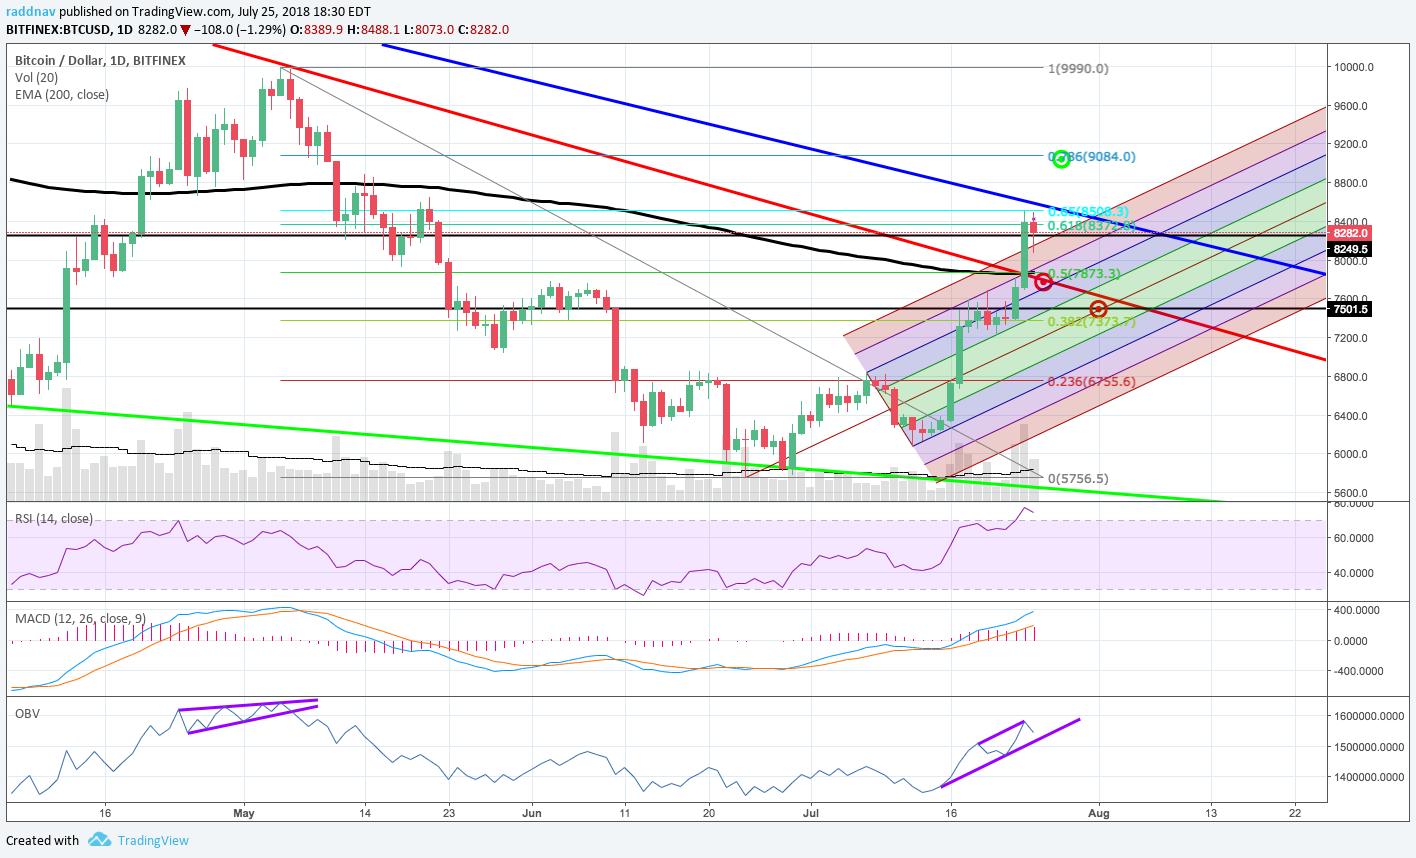 I also wanted to add another bonus chart of the Wyckoff Accumulation Schematic as I applied to the chart of Bitcoin on Bitstamp. I mentioned it yesterday and thought it would be worth a look. It would be amazing it the market actually played out that way. Hope you enjoy it. Have a good evening. -More on Vanddar.com 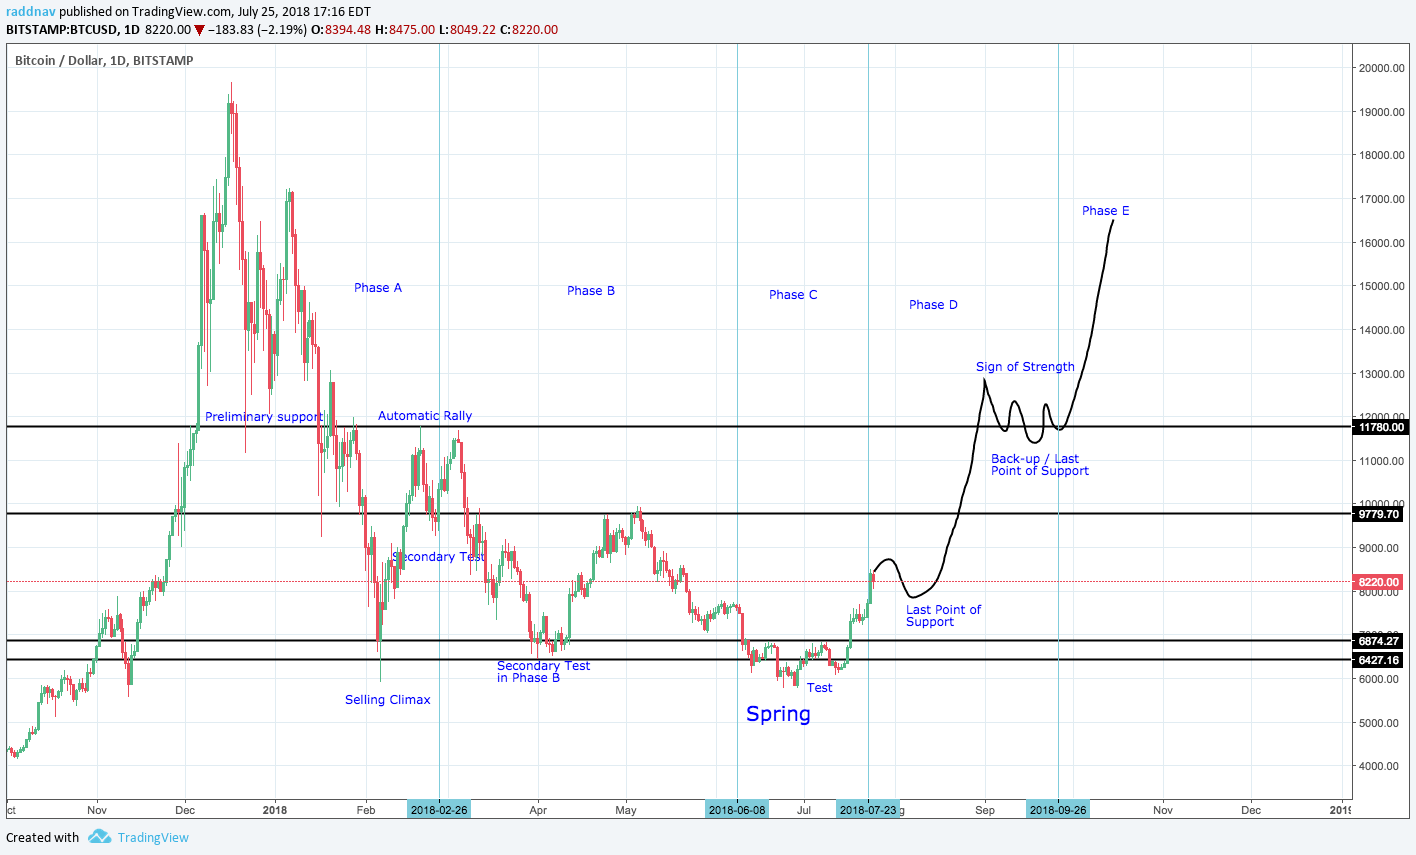 |
| json metadata | {"tags":["btc","bitcoin","cryptocurrency"],"image":["https://cdn.steemitimages.com/DQmSPQQsYN2SjkLxRuP1PNeQqJR4VuMckgsF19v78sx5fuW/image.png","https://cdn.steemitimages.com/DQmNVRLaZQHwB1dSxkW9zXaeLNHi8wYrJiZaPWfgNsHYchM/image.png","https://cdn.steemitimages.com/DQmPJbFZ6dNcudoruLScmvhTVf4afugsXzKtabsn3zAL6Um/image.png"],"app":"steemit/0.1","format":"markdown"} |
| parent author | |
| parent permlink | btc |
| permlink | bitcoin-head-and-shoulders-top-on-hourly |
| title | Bitcoin Head and Shoulders Top on Hourly? |
| Transaction Info | Block #24497255/Trx 7fd6eac06083f7254cf62b1143443b6b244a0f0c |
View Raw JSON Data
{
"block": 24497255,
"op": [
"comment",
{
"author": "vanddar4",
"body": "On the hourly analog Bitcoin Bitfinex snapshot we have a nice rally from where we last left off yesterday where price spring-boarded from this $8,250 level all the way up to the turquoise .65 retracement at $8,500. Volume started to slow down overnight and headed southward to $8,080 at 2pm EST today. \n\nPrice is now bouncing on the outside of the up-trending and heading back through that black horizontal line at $8,275. I think that price could continue a little bit higher over the next few hours here, possibly back to that .618 green Fibonacci retracement level, but then it would be critical to look for some resistance.\n\nThere could be an inverse head and shoulders top forming over the last two days, which I have included on the snapshot. Just as price rebounded efficiently from the inverse head and shoulders on the daily chart a week or two ago, the opposite could be true on this hourly chart. \n\nPrice would not move as much on a validated head and shoulders top here, but it could be enough to take it back down to the red down-trending line at $7,750 or possibly all the way back to the $7,500 black horizontal support level. I have also moved the target accordingly. Both levels would be a nice range for price to consolidate for a few days before the next big move.\n\nThe RSI here reset down to 38.22 from the lows of 8,080 earlier today, but is already passing neutral territory at 57.39 on the move over the last few hours. An uptick in volume here should be enough to authenticate that head and shoulders top if the bears can hold it. There is also some bearish reversal divergence from price on the RSI and OBV as indicated by the purple trend lines.\n\nThe MACD is bearishly trending downward and is about to swing below the zero bound into bearish momentum. It’s trending upward the last few hours here, but I do not think it will last.\n\n\n\nOn the daily analog Bitcoin Bitfinex chart, you can see today’s candle currently holding above that $8,250 as support. Ideally some consolidation between the black lines between $8,250 and $7,500 would be a healthy development. Price definitely needs to revisit this red down-trending line though to test the resolve of the bulls for their higher prices.\n\nSince price is now above the 200 day EMA at $7,869, that would naturally be a good support level as well, just like it was for a few days back in April. \n\nThe RSI has topped out well into overbought territory currently sitting at 73.57 and is due to retrace the next few days. I don’t think this bullish trend has completed yet, but some pullback and consolidation is needed to reposition for the next move.\n\nThe MACD also looks almost too optimistic and ready to flatten out a little in the short-term. The OBV is trending upward still as highlighted by the lines of that purple channel, which is a good sign for the bulls and any break of that line would not be a good. I find it interesting that even though the OBV did not indicate any bearish divergence back in late April and May there was a defined rising wedge pattern that was broken. \n\n\n\nI also wanted to add another bonus chart of the Wyckoff Accumulation Schematic as I applied to the chart of Bitcoin on Bitstamp. I mentioned it yesterday and thought it would be worth a look. It would be amazing it the market actually played out that way. Hope you enjoy it. Have a good evening.\n\n-More on Vanddar.com\n\n",
"json_metadata": "{\"tags\":[\"btc\",\"bitcoin\",\"cryptocurrency\"],\"image\":[\"https://cdn.steemitimages.com/DQmSPQQsYN2SjkLxRuP1PNeQqJR4VuMckgsF19v78sx5fuW/image.png\",\"https://cdn.steemitimages.com/DQmNVRLaZQHwB1dSxkW9zXaeLNHi8wYrJiZaPWfgNsHYchM/image.png\",\"https://cdn.steemitimages.com/DQmPJbFZ6dNcudoruLScmvhTVf4afugsXzKtabsn3zAL6Um/image.png\"],\"app\":\"steemit/0.1\",\"format\":\"markdown\"}",
"parent_author": "",
"parent_permlink": "btc",
"permlink": "bitcoin-head-and-shoulders-top-on-hourly",
"title": "Bitcoin Head and Shoulders Top on Hourly?"
}
],
"op_in_trx": 0,
"timestamp": "2018-07-25T22:41:42",
"trx_id": "7fd6eac06083f7254cf62b1143443b6b244a0f0c",
"trx_in_block": 36,
"virtual_op": 0
}2018/07/24 23:12:09
2018/07/24 23:12:09
| author | jacktechtrades |
| body | My hope is a sustained rally, and confirmed market reversal, there is a lot happening on the fundamental level to suggest that an infusion of institutional capital will happen shortly. A lot of people are building quality software, and financial institutions and governments are jumping on board. the future looks bright. |
| json metadata | {"tags":["btc"],"app":"steemit/0.1"} |
| parent author | vanddar4 |
| parent permlink | bitcoin-bull-trap-or-beginning-of-fomo |
| permlink | re-vanddar4-bitcoin-bull-trap-or-beginning-of-fomo-20180724t231208960z |
| title | |
| Transaction Info | Block #24469071/Trx 01f24ae24b648470d9abda7923fed1f9d611b895 |
View Raw JSON Data
{
  "block": 24469071,
  "op": [
    "comment",
    {
      "author": "jacktechtrades",
      "body": "My hope is a sustained rally, and confirmed market reversal, there is a lot happening on the fundamental level to suggest that an infusion of institutional capital will happen shortly. A lot of people are building quality software, and financial institutions and governments are jumping on board. the future looks bright.",
      "json_metadata": "{\"tags\":[\"btc\"],\"app\":\"steemit/0.1\"}",
      "parent_author": "vanddar4",
      "parent_permlink": "bitcoin-bull-trap-or-beginning-of-fomo",
      "permlink": "re-vanddar4-bitcoin-bull-trap-or-beginning-of-fomo-20180724t231208960z",
      "title": ""
    }
  ],
  "op_in_trx": 0,
  "timestamp": "2018-07-24T23:12:09",
  "trx_id": "01f24ae24b648470d9abda7923fed1f9d611b895",
  "trx_in_block": 40,
  "virtual_op": 0
}youngogmarqsupvoted (0.02%) @vanddar4 / bitcoin-bull-trap-or-beginning-of-fomo2018/07/24 23:09:12
youngogmarqsupvoted (0.02%) @vanddar4 / bitcoin-bull-trap-or-beginning-of-fomo
2018/07/24 23:09:12
| author | vanddar4 |
| permlink | bitcoin-bull-trap-or-beginning-of-fomo |
| voter | youngogmarqs |
| weight | 2 (0.02%) |
| Transaction Info | Block #24469012/Trx 5051ac3769bb5f38b2fd445cb315c598b8dc769f |
View Raw JSON Data
{
  "block": 24469012,
  "op": [
    "vote",
    {
      "author": "vanddar4",
      "permlink": "bitcoin-bull-trap-or-beginning-of-fomo",
      "voter": "youngogmarqs",
      "weight": 2
    }
  ],
  "op_in_trx": 0,
  "timestamp": "2018-07-24T23:09:12",
  "trx_id": "5051ac3769bb5f38b2fd445cb315c598b8dc769f",
  "trx_in_block": 26,
  "virtual_op": 0
}vanddar4published a new post: bitcoin-bull-trap-or-beginning-of-fomo2018/07/24 22:51:09
vanddar4published a new post: bitcoin-bull-trap-or-beginning-of-fomo
2018/07/24 22:51:09
| author | vanddar4 |
| body | It’s an exciting day for the crypto-market as Bitcoin has soared unexpectedly through some key resistance level. Is this rally for real or is still the next peak before heading to new lows. Let’s discuss the possibilities. On the hourly analog Bitcoin Bitfinex chart, we have had a beautiful extended rally today since around midnight EST last night where price began moving from the $7,750 level all the way up to $8,250 right now. I had thought there would be a lot more resistance around the convergence of key levels at $7,850, however the volume last night picked up and blew right through there. I mentioned that if it did make it through there we could see some additional resistance on the outside of the pitchfork at $8,126 and the top of the red channel 2 standard deviations from the median line, but even that level was breached by the bulls today and is now being used as support. Price does breach the pitchfork from time to time and did on the downtrend pitchfork from May 5th to June 24 but eventually comes back into the pitchfork to consolidate the price action. This is most likely one of these instances, however it’s always possible that price jumps into a steeper up trending pitchfork if the momentum and volume continues. Volume has fallen off over the last few hours here, and this $8,250 appears to be giving price some trouble. There is also some bearish reversal divergence on this time frame as indicated with the blue lines with price higher highs peak to peak and lower highs on the RSI. A strong retest of this red long-term downtrend line at around $7,820 is needed to confirm if this rally is indeed real and has the power to keep going and I have adjusted the red target accordingly. Maybe that happens in the next 24 hours and we can reassess things then. The MACD is beginning to downtrend bearishly over the last few hours here and the blue trigger line has crossed under the orange moving average there. The OBV is still holding up quite strong with lots more buy volume than sell volume. You can also use the OBV to look for divergences, but there’s not much to see yet. 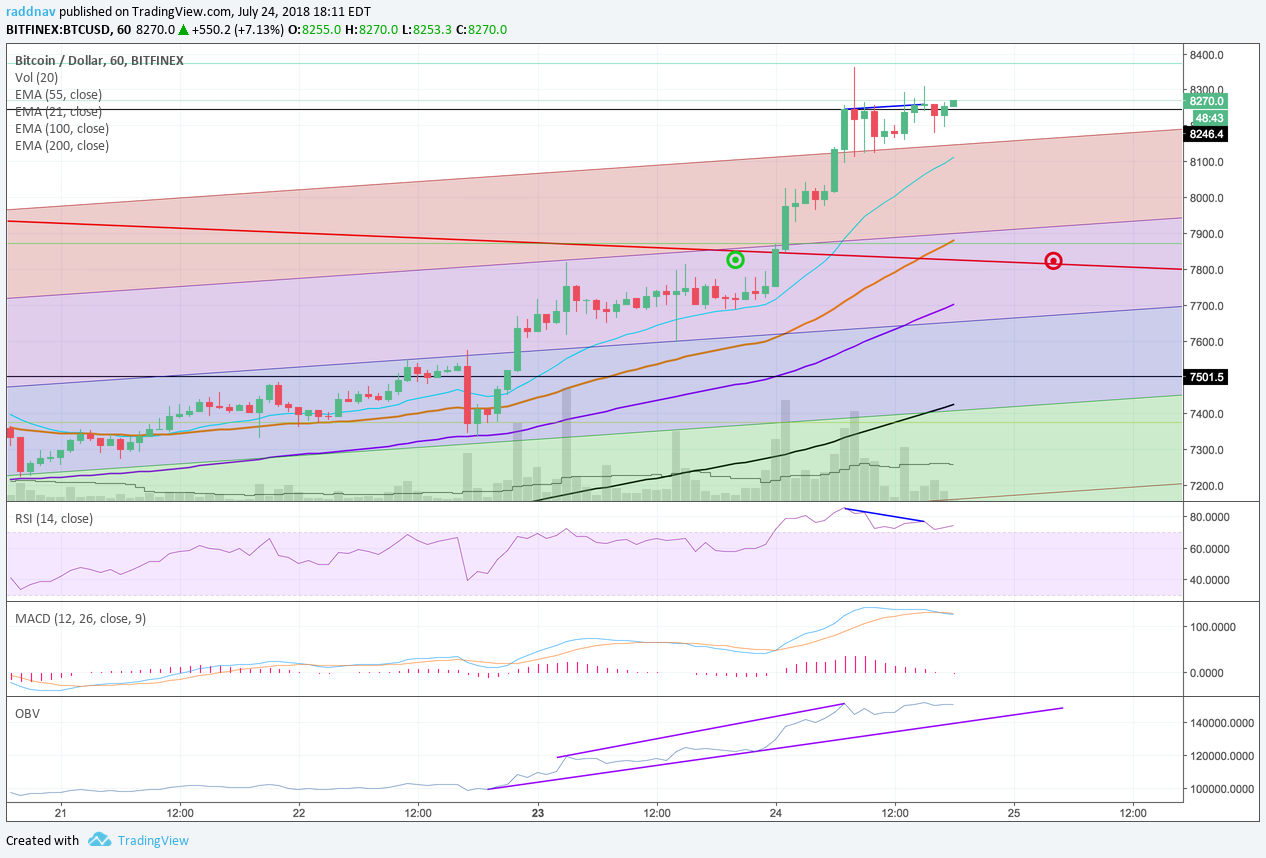 On the daily analog Bitcoin Bitfinex chart, it’s amazing to see price blow through that red long term down-trending line, but we need to be careful of a bull trap here. Today does have the largest daily volume since June 10th’s smash, however today is not over yet and hopefully we will see more volume than April 25th the next highest level. Volume is always a great indicator of further price movement, so we need to keep a close eye on whether this is just a nice rally or the beginning of the next bull run. If I map an inverse Fibonacci retracement on the downtrend from May 6th to June 24th you can see that price has now rallied back up to the green .618 horizontal level almost precisely at $8,373. This is a natural level for the bears to defend, however price could run higher to the continued flavor of the quarter of the blue .786 level at $9,084. I think the most likely scenario is that price consolidates around the current level of $8,250 for a few days, prices than retraces to the long-term downtrend line to retest it around $7,500 to $7,300 around the median of the pitchfork and previous horizontal resistance and then potentially heads higher. This entire downtrend has been very similar to an Accumulation Wyckoff Event which is worth taking a look at if interested. The RSI looks very overbought right now at 76.58, but could easily continue higher if the bears don’t pull it together soon. The MACD still looks good with both lines and the histogram trending higher and the OBV looking very strong as well. 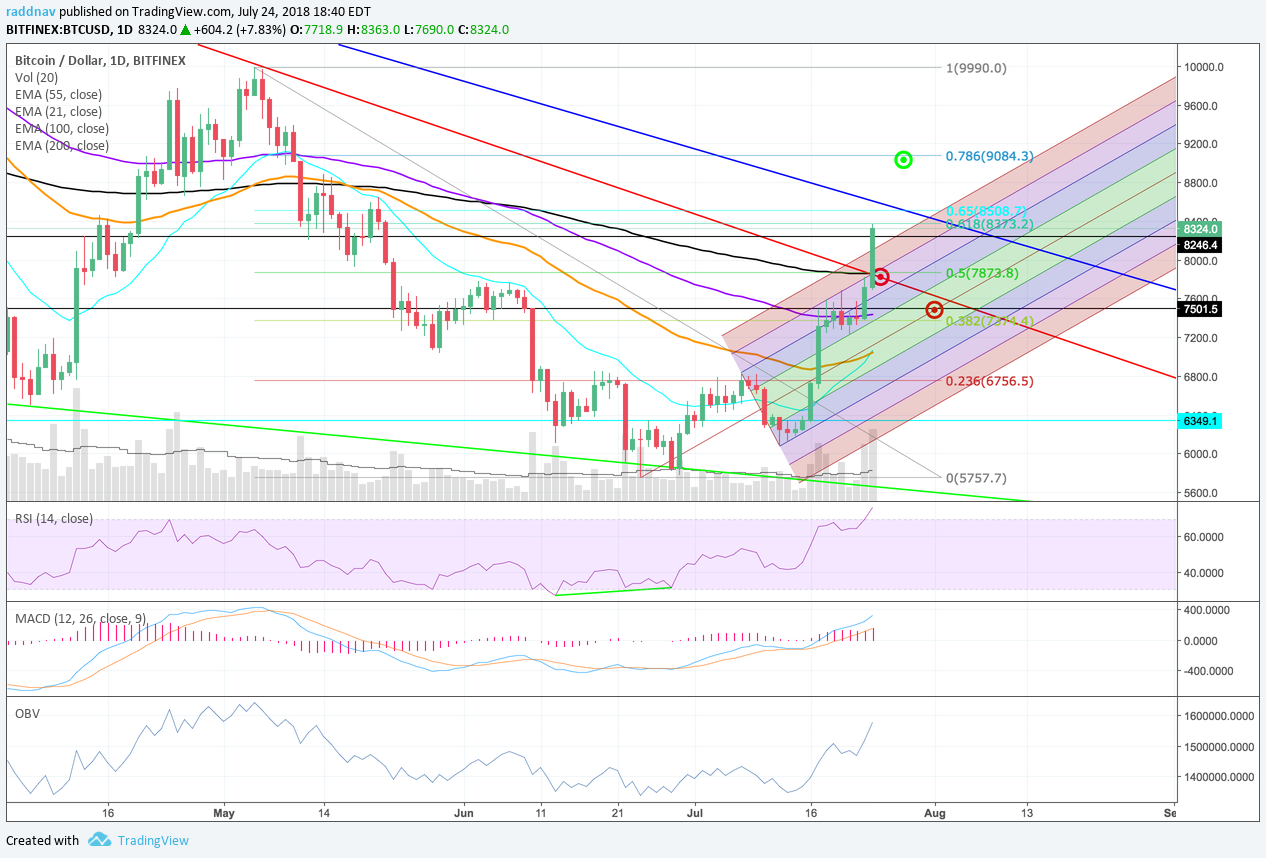 I have also added one more look where you can see price on the logarithmic chart, where price is still finding resistance within the pitchfork and at the blue down-trending line. Another key level and perspective to keep in mind. -More on Vanddar.com 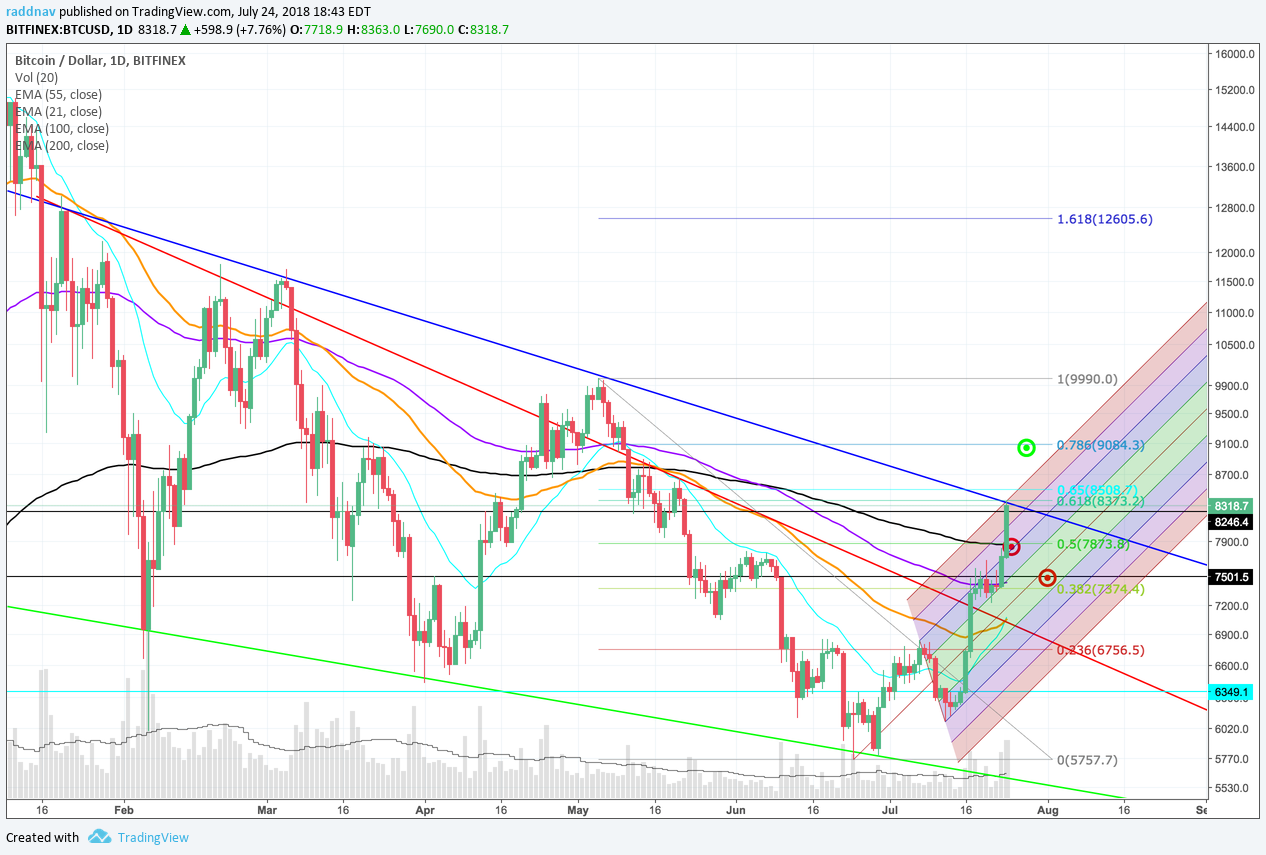 |
| json metadata | {"tags":["btc","bitcoin","cryptocurrency"],"image":["https://cdn.steemitimages.com/DQmZC9m7QpGoFMdQjhtu1H1X9U4nckqr7W584B7zysBJEDD/image.png","https://cdn.steemitimages.com/DQmNRtgtXWs8AzqwifQTCEGnqiqqNQ4ADQcbGnkqYKzDLSy/image.png","https://cdn.steemitimages.com/DQmeFgUZAfh4FLa6KWkh1ihbJRiKV4QTfaNeCR4VWHYWy2X/image.png"],"app":"steemit/0.1","format":"markdown"} |
| parent author | |
| parent permlink | btc |
| permlink | bitcoin-bull-trap-or-beginning-of-fomo |
| title | Bitcoin Bull Trap or Beginning of FOMO |
| Transaction Info | Block #24468651/Trx e439924386af8fbeea59ada16564d90087e7eae5 |
View Raw JSON Data
{
"block": 24468651,
"op": [
"comment",
{
"author": "vanddar4",
"body": "It’s an exciting day for the crypto-market as Bitcoin has soared unexpectedly through some key resistance level. Is this rally for real or is still the next peak before heading to new lows. Let’s discuss the possibilities.\n\nOn the hourly analog Bitcoin Bitfinex chart, we have had a beautiful extended rally today since around midnight EST last night where price began moving from the $7,750 level all the way up to $8,250 right now. \n\nI had thought there would be a lot more resistance around the convergence of key levels at $7,850, however the volume last night picked up and blew right through there. \n\nI mentioned that if it did make it through there we could see some additional resistance on the outside of the pitchfork at $8,126 and the top of the red channel 2 standard deviations from the median line, but even that level was breached by the bulls today and is now being used as support. \n\nPrice does breach the pitchfork from time to time and did on the downtrend pitchfork from May 5th to June 24 but eventually comes back into the pitchfork to consolidate the price action. This is most likely one of these instances, however it’s always possible that price jumps into a steeper up trending pitchfork if the momentum and volume continues. \n\nVolume has fallen off over the last few hours here, and this $8,250 appears to be giving price some trouble. There is also some bearish reversal divergence on this time frame as indicated with the blue lines with price higher highs peak to peak and lower highs on the RSI. \n\nA strong retest of this red long-term downtrend line at around $7,820 is needed to confirm if this rally is indeed real and has the power to keep going and I have adjusted the red target accordingly. Maybe that happens in the next 24 hours and we can reassess things then.\n\nThe MACD is beginning to downtrend bearishly over the last few hours here and the blue trigger line has crossed under the orange moving average there. The OBV is still holding up quite strong with lots more buy volume than sell volume. You can also use the OBV to look for divergences, but there’s not much to see yet.\n\n\n\nOn the daily analog Bitcoin Bitfinex chart, it’s amazing to see price blow through that red long term down-trending line, but we need to be careful of a bull trap here. Today does have the largest daily volume since June 10th’s smash, however today is not over yet and hopefully we will see more volume than April 25th the next highest level. \n\nVolume is always a great indicator of further price movement, so we need to keep a close eye on whether this is just a nice rally or the beginning of the next bull run. \n\nIf I map an inverse Fibonacci retracement on the downtrend from May 6th to June 24th you can see that price has now rallied back up to the green .618 horizontal level almost precisely at $8,373. This is a natural level for the bears to defend, however price could run higher to the continued flavor of the quarter of the blue .786 level at $9,084. \n\nI think the most likely scenario is that price consolidates around the current level of $8,250 for a few days, prices than retraces to the long-term downtrend line to retest it around $7,500 to $7,300 around the median of the pitchfork and previous horizontal resistance and then potentially heads higher. This entire downtrend has been very similar to an Accumulation Wyckoff Event which is worth taking a look at if interested.\n\nThe RSI looks very overbought right now at 76.58, but could easily continue higher if the bears don’t pull it together soon. The MACD still looks good with both lines and the histogram trending higher and the OBV looking very strong as well. \n\n\n\nI have also added one more look where you can see price on the logarithmic chart, where price is still finding resistance within the pitchfork and at the blue down-trending line. Another key level and perspective to keep in mind.\n\n-More on Vanddar.com\n\n",
"json_metadata": "{\"tags\":[\"btc\",\"bitcoin\",\"cryptocurrency\"],\"image\":[\"https://cdn.steemitimages.com/DQmZC9m7QpGoFMdQjhtu1H1X9U4nckqr7W584B7zysBJEDD/image.png\",\"https://cdn.steemitimages.com/DQmNRtgtXWs8AzqwifQTCEGnqiqqNQ4ADQcbGnkqYKzDLSy/image.png\",\"https://cdn.steemitimages.com/DQmeFgUZAfh4FLa6KWkh1ihbJRiKV4QTfaNeCR4VWHYWy2X/image.png\"],\"app\":\"steemit/0.1\",\"format\":\"markdown\"}",
"parent_author": "",
"parent_permlink": "btc",
"permlink": "bitcoin-bull-trap-or-beginning-of-fomo",
"title": "Bitcoin Bull Trap or Beginning of FOMO"
}
],
"op_in_trx": 0,
"timestamp": "2018-07-24T22:51:09",
"trx_id": "e439924386af8fbeea59ada16564d90087e7eae5",
"trx_in_block": 5,
"virtual_op": 0
}vanddar4published a new post: bitcoin-converging-resistances-at-usd7-8502018/07/23 22:13:15
vanddar4published a new post: bitcoin-converging-resistances-at-usd7-850
2018/07/23 22:13:15
| author | vanddar4 |
| body | On the hourly analog Bitcoin Bitfinex chart, price has come a quite a ways from the $6,150 level I was looking at just 10 days ago. My targets I haven’t touched since my last post have also have turned out to be relatively accurate from a pricing perspective, however a little off in the timing. The screenshot below is of the last week or so in the pricing action and you can see the steady price consolidation over the last few days, since the big pop in price last Tuesday July 17th. Price has bounced around between a range of those black horizontal lines at $7,500 to $7,275 with $7,375 acting as a good median support. In the evening yesterday, that median black horizontal support at $7,375 provided a good springboard for the rally overnight to $7,730 where price is sitting around today. The orange 55 EMA and 100 EMA also did a good job to support price at these levels and keep the bullish rally intact. There’s been some good volume and volatility around these levels today and price has successfully hit the Fibonacci Extension at 1.5 $7,727, all the way up from $6,077 at the C-Fibonacci Retracement Level. The price action from 14:00 EST today has a bullish spinning top candle where the bears pushed price all the way down to the 1.382 Fib level in an instant at $7,597, however the bulls eat quickly back up. This could just be someone taking profits, but the demand is still strong from the bulls. I could see additional profit taking over the next few hours around these levels with the turquoise 21 hour EMA acting as support near $7,625. The volume overall is still strong here, and I think a push up to that old target at $7,825 and the red down-trending resistance is still on the docket. The RSI is toward over-bought at 59.42, but still has some good strength as downward price action is resetting the indicator quickly. The MACD looks bearish, but could also quickly turn the other direction. The on balance volume (OBV) is also continuing to trend higher as well which is a good sign that price will continue to trend higher, since volume typically precedes price. 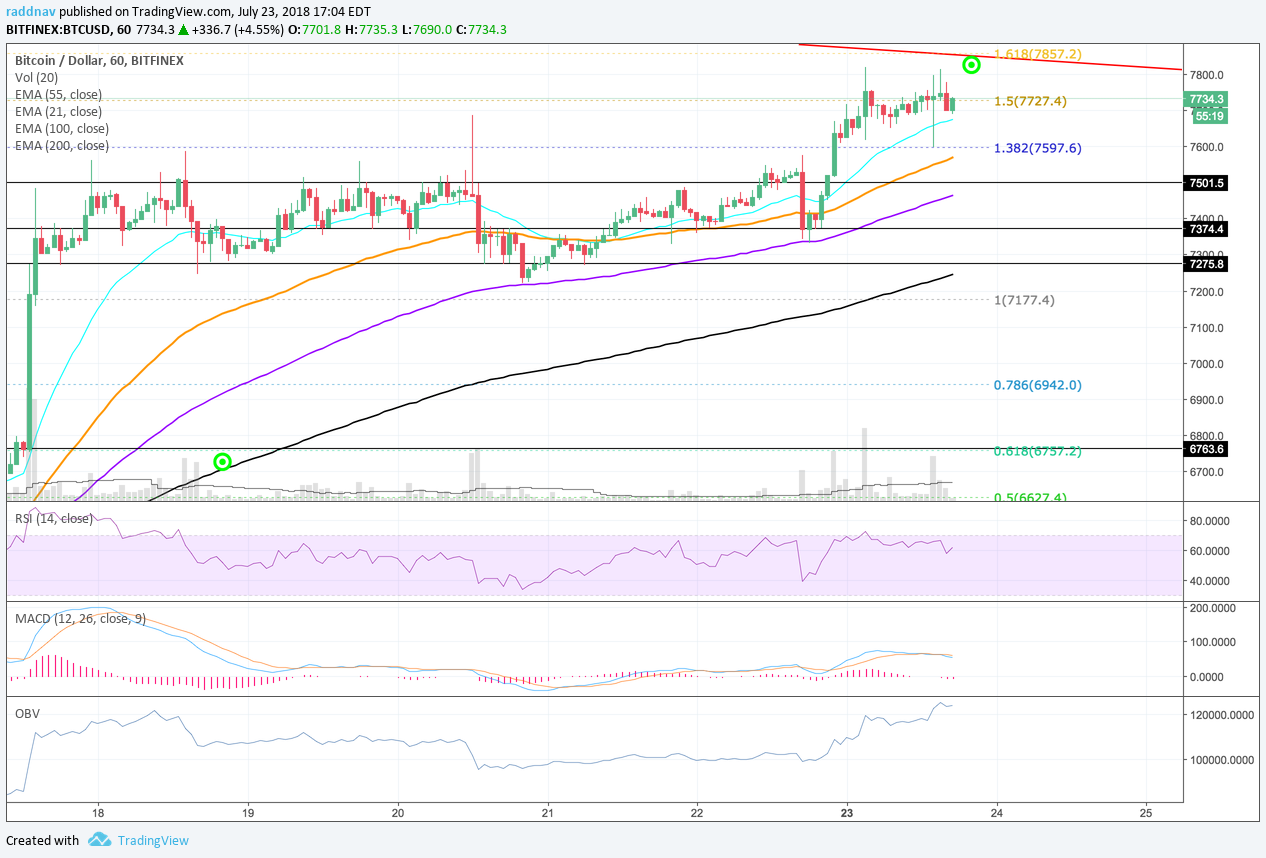 On the daily analog Bitcoin Bitfinex chart, there is a lot to talk about her but, I will keep it brief today. The inverse head and shoulders bottom I kept discussing turned out to work great, however the big battle ahead is the $7,857 level at the 1.618 Fib Extension that is converging with the black 200 day EMA and the long-term red down-trending line. I don’t think price will breach that level in the next 24 hours however, if it somehow does I would caution patience for a retest of the red line. I would not be surprised to see a lot of consolidation around that level while price hugs that red line for a few days. I placed an up-trending pitchfork on the pivot from $5,755 and subsequent swing high from July 7th and swing low from July 12th and you can see how it’s been containing price nicely so far. Today, price has stopped right on the top side of the purple channel. There could be an attempt for price make a run at the outside of that pitchfork at around $8,100, but I think a revisit to the bottom or the purple channel at $7,600 is much more likely. I have put in two new red targets, where we could see price over the next few days. RSI is now at 70.08 and sitting in overbought territory which hasn’t been seen since December 18th. Even the overboughtedness from April 24th only capped out at 69.61, so this price action is significant. MACD and OBV are also looking great right now too. More tomorrow. -More on Vanddar.com 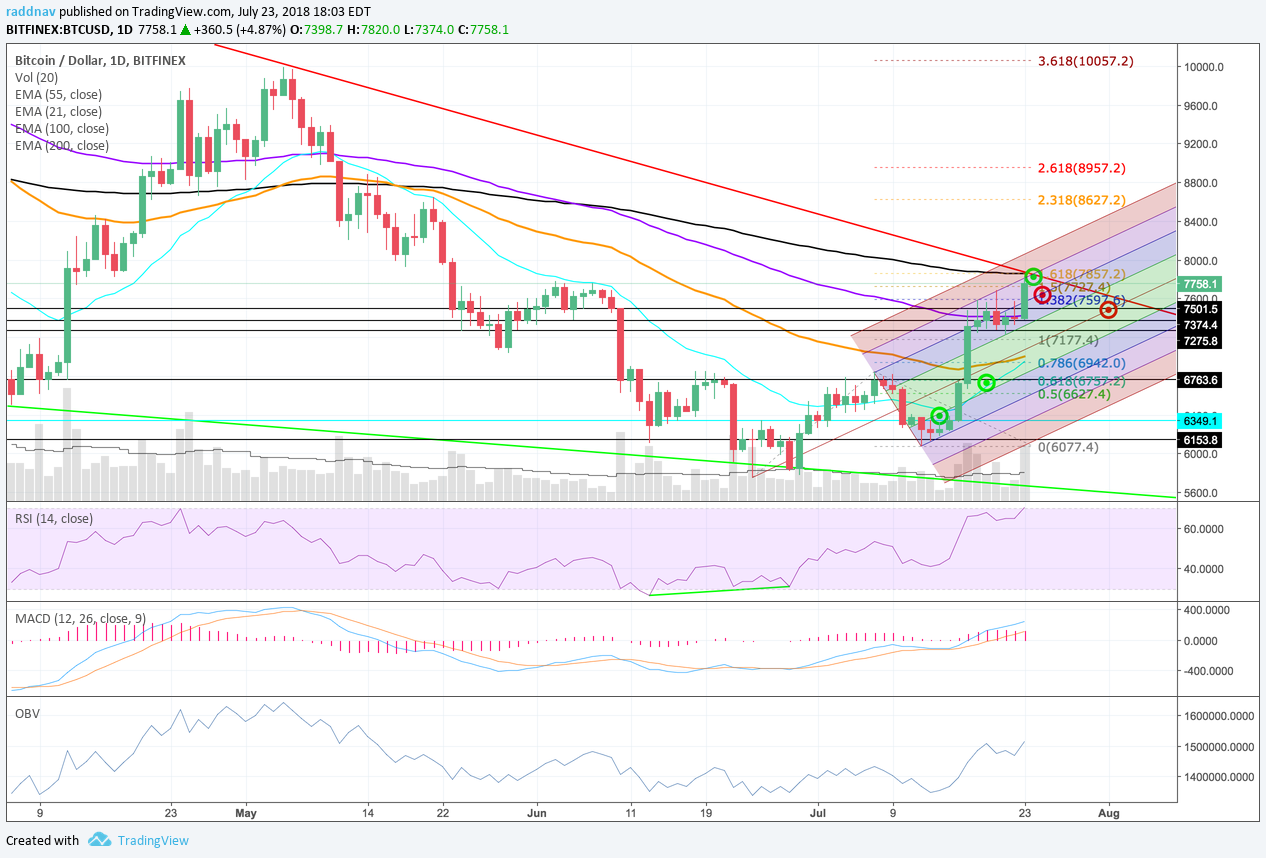 |
| json metadata | {"tags":["btc","bitcoin","cryptocurrencies"],"image":["https://cdn.steemitimages.com/DQmZYrSEXzFofkU4TPA7kj3Wcmqh1jgem6gJH3EmvWLeRMr/image.png","https://cdn.steemitimages.com/DQmWFEWuAridcjxGJKPiPagDM1syomuvFSMnVzMpQUEQVK7/image.png"],"app":"steemit/0.1","format":"markdown"} |
| parent author | |
| parent permlink | btc |
| permlink | bitcoin-converging-resistances-at-usd7-850 |
| title | Bitcoin Converging Resistances at $7,850 |
| Transaction Info | Block #24439107/Trx f14f33fe172fe67c7d0c569f60a93bd0d2be8ead |
View Raw JSON Data
{
"block": 24439107,
"op": [
"comment",
{
"author": "vanddar4",
"body": "On the hourly analog Bitcoin Bitfinex chart, price has come a quite a ways from the $6,150 level I was looking at just 10 days ago. My targets I haven’t touched since my last post have also have turned out to be relatively accurate from a pricing perspective, however a little off in the timing.\n\nThe screenshot below is of the last week or so in the pricing action and you can see the steady price consolidation over the last few days, since the big pop in price last Tuesday July 17th. Price has bounced around between a range of those black horizontal lines at $7,500 to $7,275 with $7,375 acting as a good median support. \n\nIn the evening yesterday, that median black horizontal support at $7,375 provided a good springboard for the rally overnight to $7,730 where price is sitting around today. The orange 55 EMA and 100 EMA also did a good job to support price at these levels and keep the bullish rally intact. \n\nThere’s been some good volume and volatility around these levels today and price has successfully hit the Fibonacci Extension at 1.5 $7,727, all the way up from $6,077 at the C-Fibonacci Retracement Level. \n\nThe price action from 14:00 EST today has a bullish spinning top candle where the bears pushed price all the way down to the 1.382 Fib level in an instant at $7,597, however the bulls eat quickly back up. This could just be someone taking profits, but the demand is still strong from the bulls.\n\nI could see additional profit taking over the next few hours around these levels with the turquoise 21 hour EMA acting as support near $7,625. The volume overall is still strong here, and I think a push up to that old target at $7,825 and the red down-trending resistance is still on the docket. \n\nThe RSI is toward over-bought at 59.42, but still has some good strength as downward price action is resetting the indicator quickly. The MACD looks bearish, but could also quickly turn the other direction.\n\nThe on balance volume (OBV) is also continuing to trend higher as well which is a good sign that price will continue to trend higher, since volume typically precedes price.\n\n\n\nOn the daily analog Bitcoin Bitfinex chart, there is a lot to talk about her but, I will keep it brief today. The inverse head and shoulders bottom I kept discussing turned out to work great, however the big battle ahead is the $7,857 level at the 1.618 Fib Extension that is converging with the black 200 day EMA and the long-term red down-trending line. \n\nI don’t think price will breach that level in the next 24 hours however, if it somehow does I would caution patience for a retest of the red line. I would not be surprised to see a lot of consolidation around that level while price hugs that red line for a few days.\n\nI placed an up-trending pitchfork on the pivot from $5,755 and subsequent swing high from July 7th and swing low from July 12th and you can see how it’s been containing price nicely so far. Today, price has stopped right on the top side of the purple channel.\n\nThere could be an attempt for price make a run at the outside of that pitchfork at around $8,100, but I think a revisit to the bottom or the purple channel at $7,600 is much more likely. I have put in two new red targets, where we could see price over the next few days.\n\nRSI is now at 70.08 and sitting in overbought territory which hasn’t been seen since December 18th. Even the overboughtedness from April 24th only capped out at 69.61, so this price action is significant.\n\nMACD and OBV are also looking great right now too. More tomorrow.\n\n-More on Vanddar.com\n\n",
"json_metadata": "{\"tags\":[\"btc\",\"bitcoin\",\"cryptocurrencies\"],\"image\":[\"https://cdn.steemitimages.com/DQmZYrSEXzFofkU4TPA7kj3Wcmqh1jgem6gJH3EmvWLeRMr/image.png\",\"https://cdn.steemitimages.com/DQmWFEWuAridcjxGJKPiPagDM1syomuvFSMnVzMpQUEQVK7/image.png\"],\"app\":\"steemit/0.1\",\"format\":\"markdown\"}",
"parent_author": "",
"parent_permlink": "btc",
"permlink": "bitcoin-converging-resistances-at-usd7-850",
"title": "Bitcoin Converging Resistances at $7,850"
}
],
"op_in_trx": 0,
"timestamp": "2018-07-23T22:13:15",
"trx_id": "f14f33fe172fe67c7d0c569f60a93bd0d2be8ead",
"trx_in_block": 18,
"virtual_op": 0
}vanddar4published a new post: bitcoin-s-bullish-divergences2018/07/14 00:08:09
vanddar4published a new post: bitcoin-s-bullish-divergences
2018/07/14 00:08:09
| author | vanddar4 |
| body | There were more personal tech issues yesterday that resulted in no post, however we are back today with a new look at the Crypto-market where prices are at a very critical juncture. Come in and let’s take a look. On the hourly analog Bitcoin Bitfinex chart, we can see how price came down from that corrective B wave on Wednesday and with no follow-through from the bulls, price headed south quickly. Price found support around that green .618 Fibonacci level at $6,170 that I was targeting on the overall Elliot Wave Cycle, and much faster than expected. The bulls put a strong resistance against all the bears coming in yesterday before giving way to the $6,079 level and then taking price up $200 within the same hour. Price has hovered around the $6,241 level for most of today, before another spike up to $6,340 and quick downdraft back to a low of $6,125 in the last few hours here. There’s a giant indecision doji from 4pm EST that spans about $1000 and I have put a blue rectangle around this area between $6,220 and $6,120 that could contain price for a while before another rally takes place. Regardless, $6,100 to $6,000 has been a strong level for the past few months now and indicating that a bottom could be in, with the price breakdown to the $5,700 - $5,800 levels on June 24 and 28, being a failed breakout for the bears. I have put a Fibonacci Extension from the low from last night and on the swing high and low from today and if price doesn’t stay in this rectangle and moves back up quickly, we could price around that green target of $6,386 in convergence around the black 200 hour exponential moving average. The good news is we have had some nice volume over the last few hours here, so hopefully it can continue to and price can move higher. I don’t see a whole lot of movement that could happen to the downside especially after that big doji today, but the bottom side of that rectangle at $6,125 is could be a reasonable target. The RSI is currently at 42 which is getting close to the oversold region, but the important thing of note is the bullish divergence drawn with the lime green line on the RSI that supports prices lows yesterday, and continues to support the price lows from today. The MACD is a bit wonky as you can see from the circled area, price got a bid after the blue trigger line crossed the zero bound, but someone wants to see the bearish momentum continue and price was hammered back down shortly thereafter. 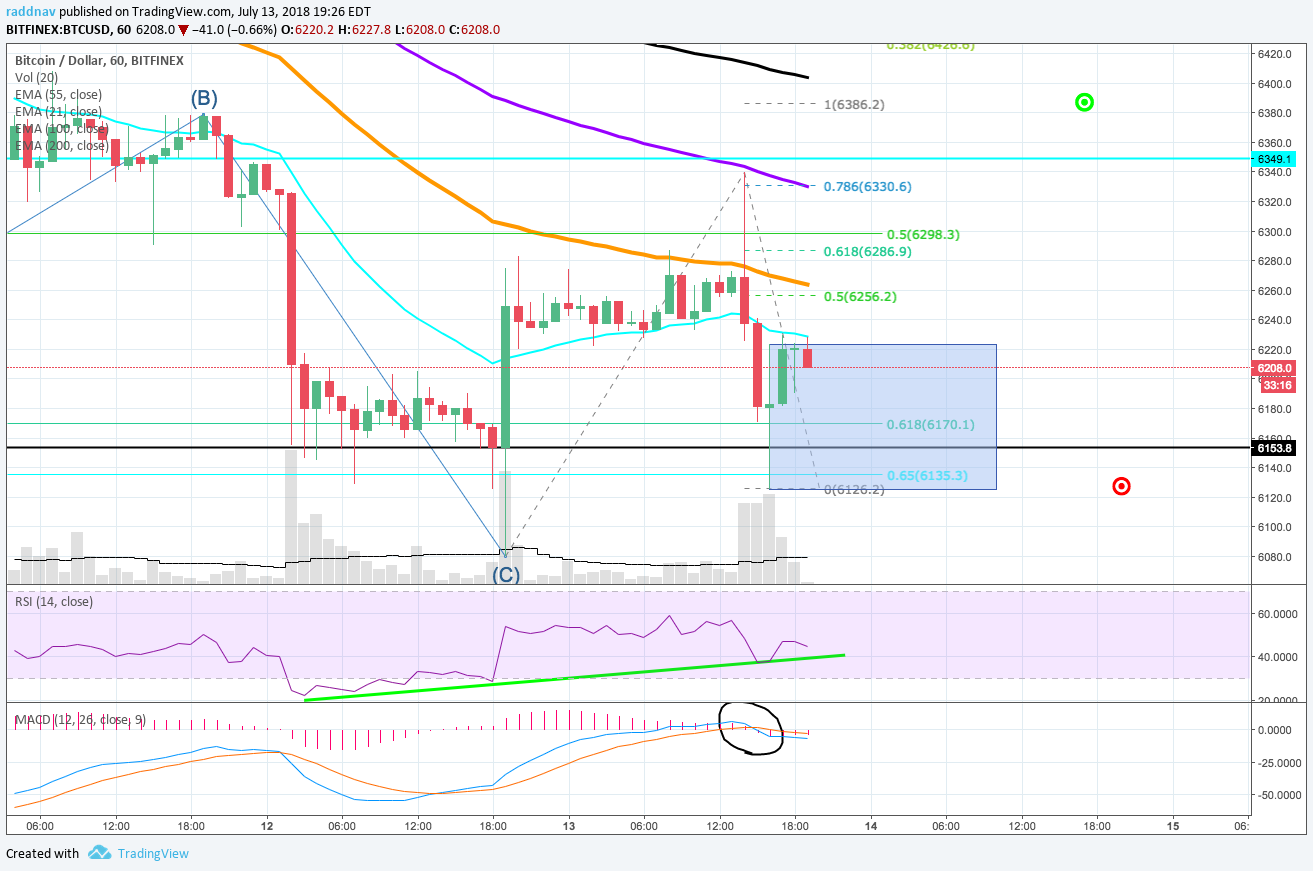 On the daily analog Bitcoin Bitfinex chart, this inverse head and shoulders bottom is really shaping up to be something, if the volume can continue to increase. The low from yesterday at $6,079 looks like a beautiful right shoulder and price would just stabilize slightly increase over the weekend. All of the moving averages are stacking bearishly still from the black 200 EMA all the way down to the turquoise 21 day EMA, but it was good to see price breach that 21 day level back on July 2nd, to shows some signs of life that it may want to turn around. Price is back below that level now, but it’s the first test on turning the ship. Next stop potentially is the orange 55 day EMA at the neckline of that head and shoulder bottom at $6,850. If price does manage to get to there I would expect it to shoot through it on a nice bull rally that many have been waiting for, with that third target at the 1.618 orange Fibonacci extension line at $7,850. That also converges with the red down-trending line containing price for the past few months. Bearishly, if volume doesn’t materialize and price does get pushed through that $6,150-$6,000 region again, I would expect a retest of that lime green support line at maybe and $5,700 again and if no bounce there, off toward $4,900 in a capitulation event. I don’t think that will happen, but I have been wrong before. There is still some nice bullish divergence on the RSI underlined by the lime green line here. It would be nice to see the RSI currently sitting at 41.05 dip back into an oversold level like 40 and ideally back to the trend line at 35, but it very well would be ready to take off from here. The MACD is curling down bearishly, but if price moves sideways, I could see it hovering for a few days before moving up with price as well. I will be off on vacation next weekend, however may get a post or two up. Have a good weekend! -More on vanddar.com 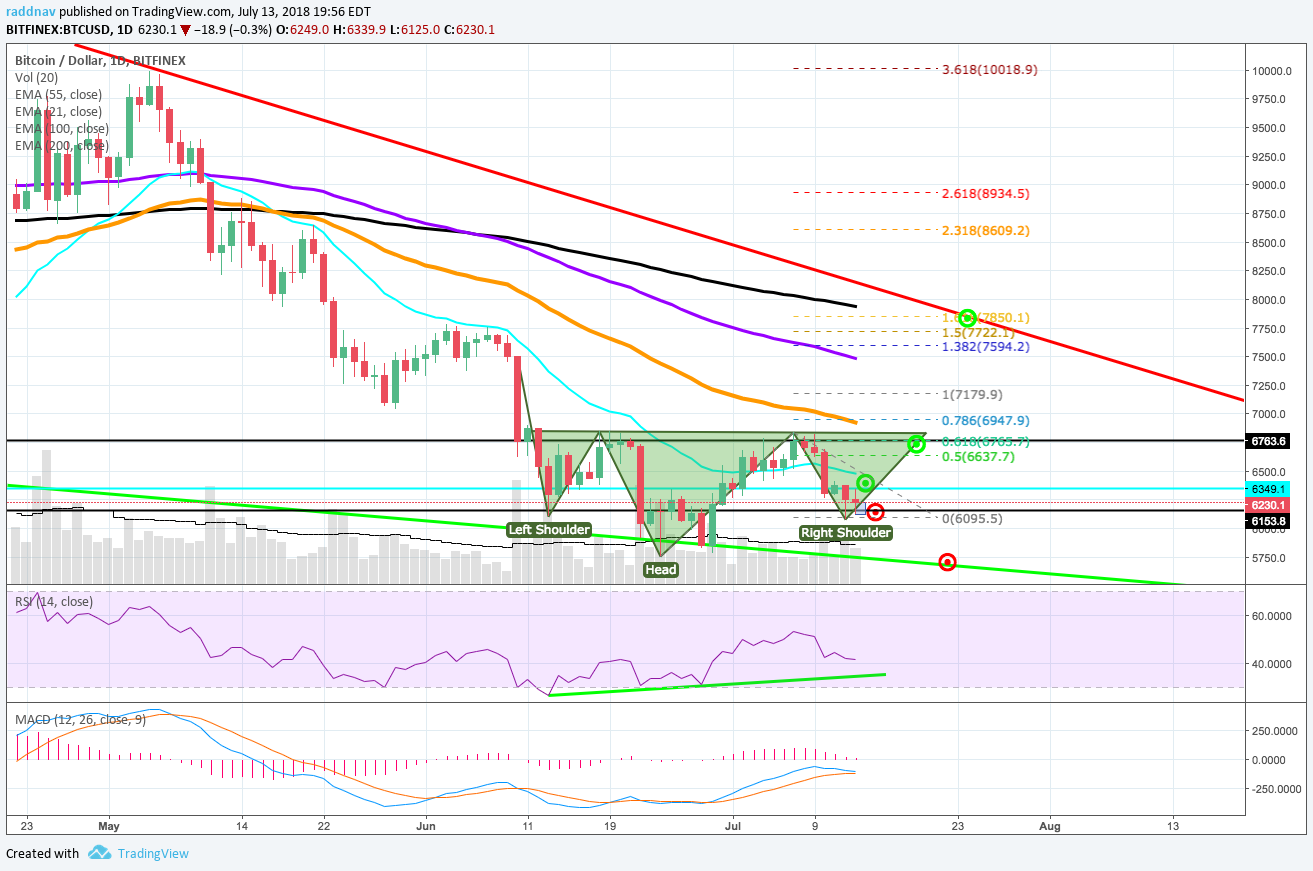 |
| json metadata | {"tags":["btc","bitcoin","crypto"],"image":["https://cdn.steemitimages.com/DQmaY1mRfqBnY8hvJspbhPwcCUMnWrF8ubzrGfzRbnuCcjw/image.png","https://cdn.steemitimages.com/DQmeSPh9YwYtoGGjxStoM86qCBMEeFJ4N3yu7qV8xT5hwzk/image.png"],"app":"steemit/0.1","format":"markdown"} |
| parent author | |
| parent permlink | btc |
| permlink | bitcoin-s-bullish-divergences |
| title | Bitcoin's Bullish Divergences |
| Transaction Info | Block #24153599/Trx dd3db99f006c6616a5db4e0fd072ac357c8dc484 |
View Raw JSON Data
{
"block": 24153599,
"op": [
"comment",
{
"author": "vanddar4",
"body": "There were more personal tech issues yesterday that resulted in no post, however we are back today with a new look at the Crypto-market where prices are at a very critical juncture. Come in and let’s take a look.\n\nOn the hourly analog Bitcoin Bitfinex chart, we can see how price came down from that corrective B wave on Wednesday and with no follow-through from the bulls, price headed south quickly. Price found support around that green .618 Fibonacci level at $6,170 that I was targeting on the overall Elliot Wave Cycle, and much faster than expected.\n\nThe bulls put a strong resistance against all the bears coming in yesterday before giving way to the $6,079 level and then taking price up $200 within the same hour. Price has hovered around the $6,241 level for most of today, before another spike up to $6,340 and quick downdraft back to a low of $6,125 in the last few hours here. \n\nThere’s a giant indecision doji from 4pm EST that spans about $1000 and I have put a blue rectangle around this area between $6,220 and $6,120 that could contain price for a while before another rally takes place. \n\nRegardless, $6,100 to $6,000 has been a strong level for the past few months now and indicating that a bottom could be in, with the price breakdown to the $5,700 - $5,800 levels on June 24 and 28, being a failed breakout for the bears.\n\nI have put a Fibonacci Extension from the low from last night and on the swing high and low from today and if price doesn’t stay in this rectangle and moves back up quickly, we could price around that green target of $6,386 in convergence around the black 200 hour exponential moving average.\n\nThe good news is we have had some nice volume over the last few hours here, so hopefully it can continue to and price can move higher. I don’t see a whole lot of movement that could happen to the downside especially after that big doji today, but the bottom side of that rectangle at $6,125 is could be a reasonable target.\n\nThe RSI is currently at 42 which is getting close to the oversold region, but the important thing of note is the bullish divergence drawn with the lime green line on the RSI that supports prices lows yesterday, and continues to support the price lows from today. \n\nThe MACD is a bit wonky as you can see from the circled area, price got a bid after the blue trigger line crossed the zero bound, but someone wants to see the bearish momentum continue and price was hammered back down shortly thereafter. \n\n\n\nOn the daily analog Bitcoin Bitfinex chart, this inverse head and shoulders bottom is really shaping up to be something, if the volume can continue to increase. The low from yesterday at $6,079 looks like a beautiful right shoulder and price would just stabilize slightly increase over the weekend.\n\nAll of the moving averages are stacking bearishly still from the black 200 EMA all the way down to the turquoise 21 day EMA, but it was good to see price breach that 21 day level back on July 2nd, to shows some signs of life that it may want to turn around. Price is back below that level now, but it’s the first test on turning the ship.\n\nNext stop potentially is the orange 55 day EMA at the neckline of that head and shoulder bottom at $6,850. If price does manage to get to there I would expect it to shoot through it on a nice bull rally that many have been waiting for, with that third target at the 1.618 orange Fibonacci extension line at $7,850. That also converges with the red down-trending line containing price for the past few months. \n\nBearishly, if volume doesn’t materialize and price does get pushed through that $6,150-$6,000 region again, I would expect a retest of that lime green support line at maybe and $5,700 again and if no bounce there, off toward $4,900 in a capitulation event. I don’t think that will happen, but I have been wrong before. \n\nThere is still some nice bullish divergence on the RSI underlined by the lime green line here. It would be nice to see the RSI currently sitting at 41.05 dip back into an oversold level like 40 and ideally back to the trend line at 35, but it very well would be ready to take off from here. \n\nThe MACD is curling down bearishly, but if price moves sideways, I could see it hovering for a few days before moving up with price as well.\n\nI will be off on vacation next weekend, however may get a post or two up. Have a good weekend!\n\n-More on vanddar.com\n\n",
"json_metadata": "{\"tags\":[\"btc\",\"bitcoin\",\"crypto\"],\"image\":[\"https://cdn.steemitimages.com/DQmaY1mRfqBnY8hvJspbhPwcCUMnWrF8ubzrGfzRbnuCcjw/image.png\",\"https://cdn.steemitimages.com/DQmeSPh9YwYtoGGjxStoM86qCBMEeFJ4N3yu7qV8xT5hwzk/image.png\"],\"app\":\"steemit/0.1\",\"format\":\"markdown\"}",
"parent_author": "",
"parent_permlink": "btc",
"permlink": "bitcoin-s-bullish-divergences",
"title": "Bitcoin's Bullish Divergences"
}
],
"op_in_trx": 0,
"timestamp": "2018-07-14T00:08:09",
"trx_id": "dd3db99f006c6616a5db4e0fd072ac357c8dc484",
"trx_in_block": 9,
"virtual_op": 0
}2018/07/12 15:30:18
2018/07/12 15:30:18
| author | surikowstepanuk |
| body | @vanddar4 maybe something will change |
| json metadata | {"tags":["btc"],"users":["vanddar4"],"app":"steemit/0.1"} |
| parent author | vanddar4 |
| parent permlink | bitcoin-wave-b-correction-imminent |
| permlink | re-vanddar4-bitcoin-wave-b-correction-imminent-20180712t153017211z |
| title | |
| Transaction Info | Block #24114459/Trx b8f3f82bf7248bb62559cc8292ad0b097803ccc5 |
View Raw JSON Data
{
  "block": 24114459,
  "op": [
    "comment",
    {
      "author": "surikowstepanuk",
      "body": "@vanddar4 maybe something will change",
      "json_metadata": "{\"tags\":[\"btc\"],\"users\":[\"vanddar4\"],\"app\":\"steemit/0.1\"}",
      "parent_author": "vanddar4",
      "parent_permlink": "bitcoin-wave-b-correction-imminent",
      "permlink": "re-vanddar4-bitcoin-wave-b-correction-imminent-20180712t153017211z",
      "title": ""
    }
  ],
  "op_in_trx": 0,
  "timestamp": "2018-07-12T15:30:18",
  "trx_id": "b8f3f82bf7248bb62559cc8292ad0b097803ccc5",
  "trx_in_block": 5,
  "virtual_op": 0
}godleeupvoted (100.00%) @vanddar4 / bitcoin-wave-b-correction-imminent2018/07/11 23:36:48
godleeupvoted (100.00%) @vanddar4 / bitcoin-wave-b-correction-imminent
2018/07/11 23:36:48
| author | vanddar4 |
| permlink | bitcoin-wave-b-correction-imminent |
| voter | godlee |
| weight | 10000 (100.00%) |
| Transaction Info | Block #24095396/Trx a32521a39a0083d54626a43160470569d8e77105 |
View Raw JSON Data
{
  "block": 24095396,
  "op": [
    "vote",
    {
      "author": "vanddar4",
      "permlink": "bitcoin-wave-b-correction-imminent",
      "voter": "godlee",
      "weight": 10000
    }
  ],
  "op_in_trx": 0,
  "timestamp": "2018-07-11T23:36:48",
  "trx_id": "a32521a39a0083d54626a43160470569d8e77105",
  "trx_in_block": 22,
  "virtual_op": 0
}vanddar4published a new post: bitcoin-wave-b-correction-imminent2018/07/11 23:33:21
vanddar4published a new post: bitcoin-wave-b-correction-imminent
2018/07/11 23:33:21
| author | vanddar4 |
| body | On the hourly analog Bitcoin Bitfinex chart, there’s not a whole lot to update over the past 24 hours here as price has pretty much gone sideways. I’ll make this quick, since most of my work went to some other analysis today. I have put a blue rectangle on the chart which represents a range of around $150 from $6,411 to $6,262. Wherever price breaks out of the rectangle from here should travel at least $150 before regrouping. My target from yesterday at the top of that potential B corrective Elliot wave would be $6,561 and $150 from that breakout point at $6,411. I would think if price did break-up to that level it might be short-lived as there are several EMAs coming down across the snapshot and the black 200 hour EMA should provide strong resistance. Price right now is about to breakout of a pennant which is wedged between those pink lines, so don’t be surprised if the move upwards happens in the next few hours. I don’t think price will breakdown because the bulls have been putting up a strong resistance below that pink bottom side line of the pennant. The RSI is looking good now too as the indicator made a higher low from on that price spike down at 19 EST yesterday and has created bullish divergence. I have underlined that trend with a pink line on the indicator as well. The MACD has been steadily climbing the past few hours, back to the zero bound where a break of that level by the blue trigger line, could send price higher too. 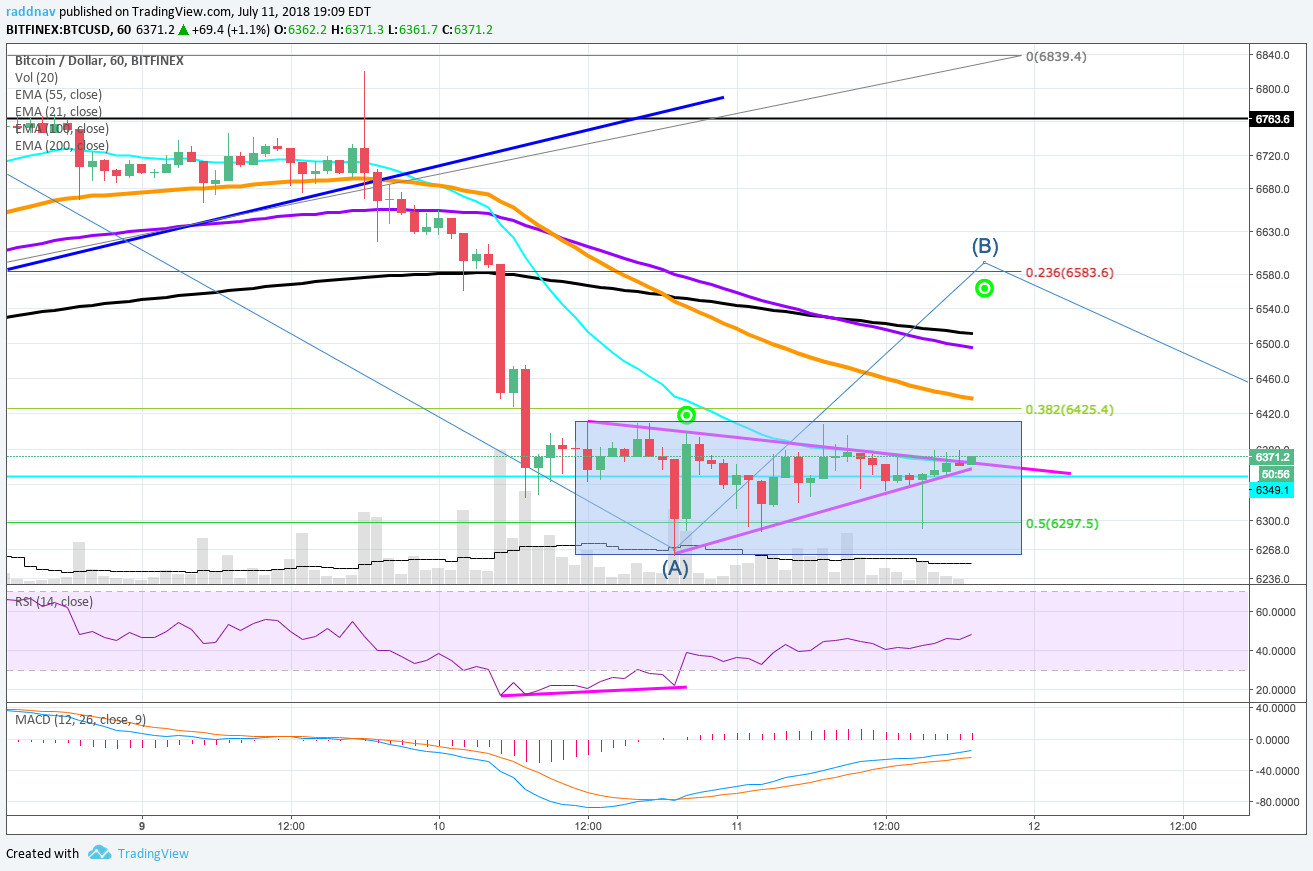 On the daily analog Bitcoin Bitfinex chart, there’s also not a whole lot to update here as well. I removed the noise of the reverse head and shoulders bottom for today, so we can see the other patterns better. I added a 21 turquoise EMA here as I think it will help identify key turning points on all the time frames better and you can see how that line is wiggling across the snapshot around $6,530 right now and how that had provided good support for almost 4 days between July 3rd and 6th. If price does not get to the target on the hourly I think that level will be at least tapped in the next 24 hours. You can also see how the additional leg down last night that created the bullish divergence on the hourly chart, also has now led to a .5 retracement at that green $6,297 level. I still think the target is the bottom of that potential C wave at $6,169, which would converge with the darker green . 618 Fibonacci line and the RSI tapping the pink bullish divergence trend line. The MACD also looks like its ready to downtrend too and have the blue trigger line bearishly cross under the orange line. The histogram is down-tick as well. Let’s see what happens over the next 24 hours. -More on Vanddar.com 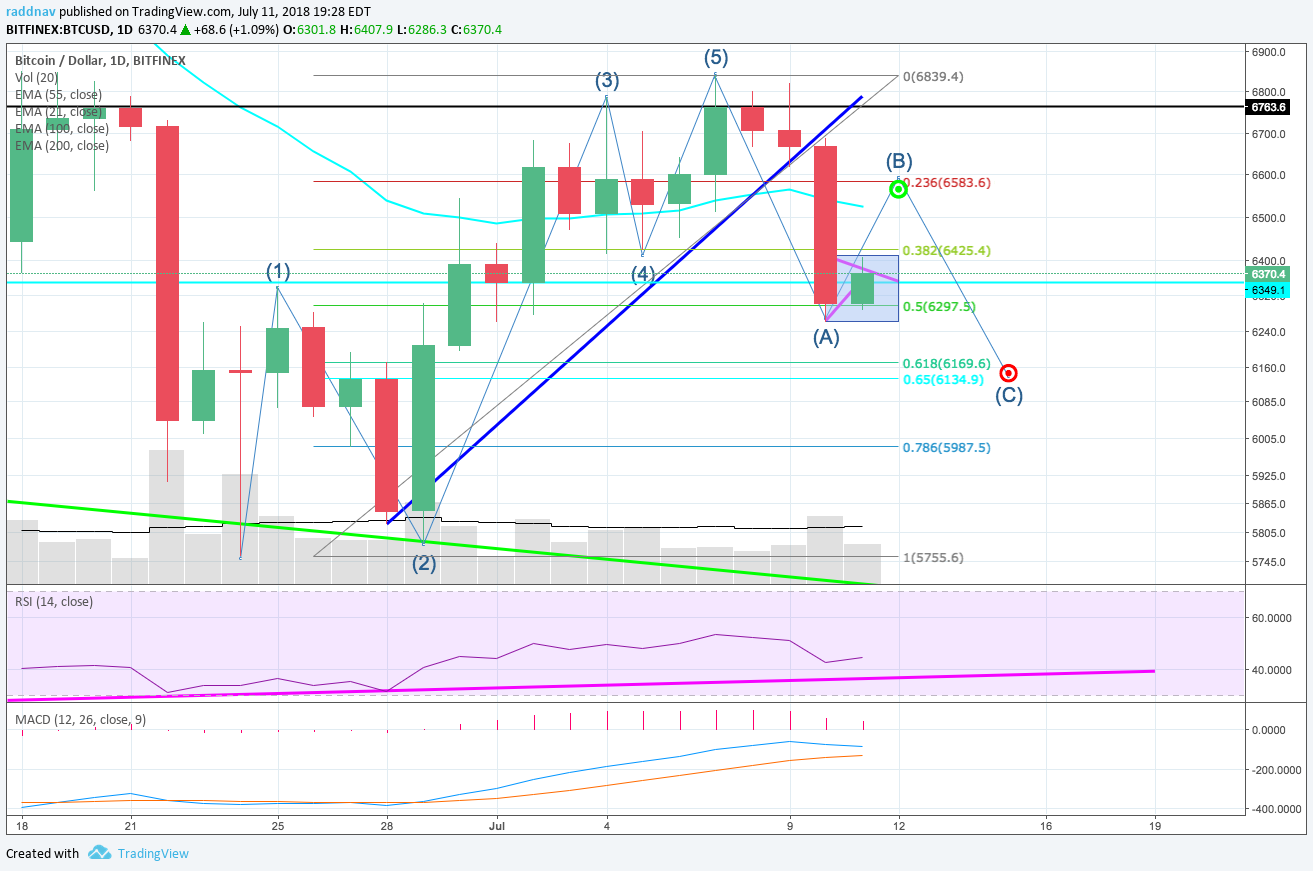 |
| json metadata | {"tags":["btc","bitcoin","crypto"],"image":["https://cdn.steemitimages.com/DQmVTqSStqQNAnAV6qkLjpYt78ndgm1uLa27RuoShNTDSVM/image.png","https://cdn.steemitimages.com/DQmYrSGbkGB6UXpcpYEfBytxzwqxUQ9aTEHGJfponijdLwL/image.png"],"app":"steemit/0.1","format":"markdown"} |
| parent author | |
| parent permlink | btc |
| permlink | bitcoin-wave-b-correction-imminent |
| title | Bitcoin Wave B Correction Imminent? |
| Transaction Info | Block #24095327/Trx 6e5eb7fa75afe7226cd72f32522f0e1e28e00b17 |
View Raw JSON Data
{
"block": 24095327,
"op": [
"comment",
{
"author": "vanddar4",
"body": "On the hourly analog Bitcoin Bitfinex chart, there’s not a whole lot to update over the past 24 hours here as price has pretty much gone sideways. I’ll make this quick, since most of my work went to some other analysis today.\n\nI have put a blue rectangle on the chart which represents a range of around $150 from $6,411 to $6,262. Wherever price breaks out of the rectangle from here should travel at least $150 before regrouping.\n\nMy target from yesterday at the top of that potential B corrective Elliot wave would be $6,561 and $150 from that breakout point at $6,411. I would think if price did break-up to that level it might be short-lived as there are several EMAs coming down across the snapshot and the black 200 hour EMA should provide strong resistance. \n\nPrice right now is about to breakout of a pennant which is wedged between those pink lines, so don’t be surprised if the move upwards happens in the next few hours. I don’t think price will breakdown because the bulls have been putting up a strong resistance below that pink bottom side line of the pennant.\n\nThe RSI is looking good now too as the indicator made a higher low from on that price spike down at 19 EST yesterday and has created bullish divergence. I have underlined that trend with a pink line on the indicator as well. \n\nThe MACD has been steadily climbing the past few hours, back to the zero bound where a break of that level by the blue trigger line, could send price higher too.\n\n\n\nOn the daily analog Bitcoin Bitfinex chart, there’s also not a whole lot to update here as well. I removed the noise of the reverse head and shoulders bottom for today, so we can see the other patterns better. \n\nI added a 21 turquoise EMA here as I think it will help identify key turning points on all the time frames better and you can see how that line is wiggling across the snapshot around $6,530 right now and how that had provided good support for almost 4 days between July 3rd and 6th. If price does not get to the target on the hourly I think that level will be at least tapped in the next 24 hours. \n\nYou can also see how the additional leg down last night that created the bullish divergence on the hourly chart, also has now led to a .5 retracement at that green $6,297 level. I still think the target is the bottom of that potential C wave at $6,169, which would converge with the darker green . 618 Fibonacci line and the RSI tapping the pink bullish divergence trend line.\n\nThe MACD also looks like its ready to downtrend too and have the blue trigger line bearishly cross under the orange line. The histogram is down-tick as well. Let’s see what happens over the next 24 hours. \n\n-More on Vanddar.com\n\n",
"json_metadata": "{\"tags\":[\"btc\",\"bitcoin\",\"crypto\"],\"image\":[\"https://cdn.steemitimages.com/DQmVTqSStqQNAnAV6qkLjpYt78ndgm1uLa27RuoShNTDSVM/image.png\",\"https://cdn.steemitimages.com/DQmYrSGbkGB6UXpcpYEfBytxzwqxUQ9aTEHGJfponijdLwL/image.png\"],\"app\":\"steemit/0.1\",\"format\":\"markdown\"}",
"parent_author": "",
"parent_permlink": "btc",
"permlink": "bitcoin-wave-b-correction-imminent",
"title": "Bitcoin Wave B Correction Imminent?"
}
],
"op_in_trx": 0,
"timestamp": "2018-07-11T23:33:21",
"trx_id": "6e5eb7fa75afe7226cd72f32522f0e1e28e00b17",
"trx_in_block": 34,
"virtual_op": 0
}vanddar4published a new post: bitcoin-reverse-head-and-shoulder-on-daily-still-in-play2018/07/10 22:42:57
vanddar4published a new post: bitcoin-reverse-head-and-shoulder-on-daily-still-in-play
2018/07/10 22:42:57
| author | vanddar4 |
| body | On the hourly analog Bitcoin Bitfinex chart, you can see how shortly after I posted yesterday, price had some significant upticks in volume and volatility complete with another fake-out move. The blue up-trending line we discussed was tapped and launched higher as the bulls made a concerted effort to break that no go area above $6,763. Volume spiked and the bears defended that level successfully as the price could not create a higher wick from the green candle on Saturday evening at $6,839. A lower high was made at $6,820 at 6pm EST yesterday and price was quickly crushed within a matter of minutes all the way back below the blue up trending support and then in the next pushed below the orange 55 hour EMA, the purple 100 MA, and the black 200 MA over several hours, blowing through the targets I was looking at yesterday. The fun did not stop for the bears as once the critical supports were breached they could have their way all the way down to the turquoise horizontal support line at $6,358. There’s been a slight recovery over the past few hours, but the volume has died off for now. Placing a Fibonacci retracement from the high on this move to the low back on June 24th yields about a .45 retracement and just short of the key green .5 line. I have also placed some potential points on snapshot below for a potential complete Elliot wave Cycle. The important thing to note here is that price found support around the top of the wave 1, which may be why price fell short of hitting the .5 retracement. It is completely possible that price could head lower as it seems that the blue .786 Fib line sitting at $5,988 has been the flavor of the past few weeks on all crypto charts. The RSI though is very oversold still sitting at 28.33 and just below 30 from entering the neutral zone. The MACD blue trigger line does appear like it wants to crossover bullishly and the histogram is ticking upward, but I think overall price needs to stabilize around this level for a bit longer to get a better idea on the next move. 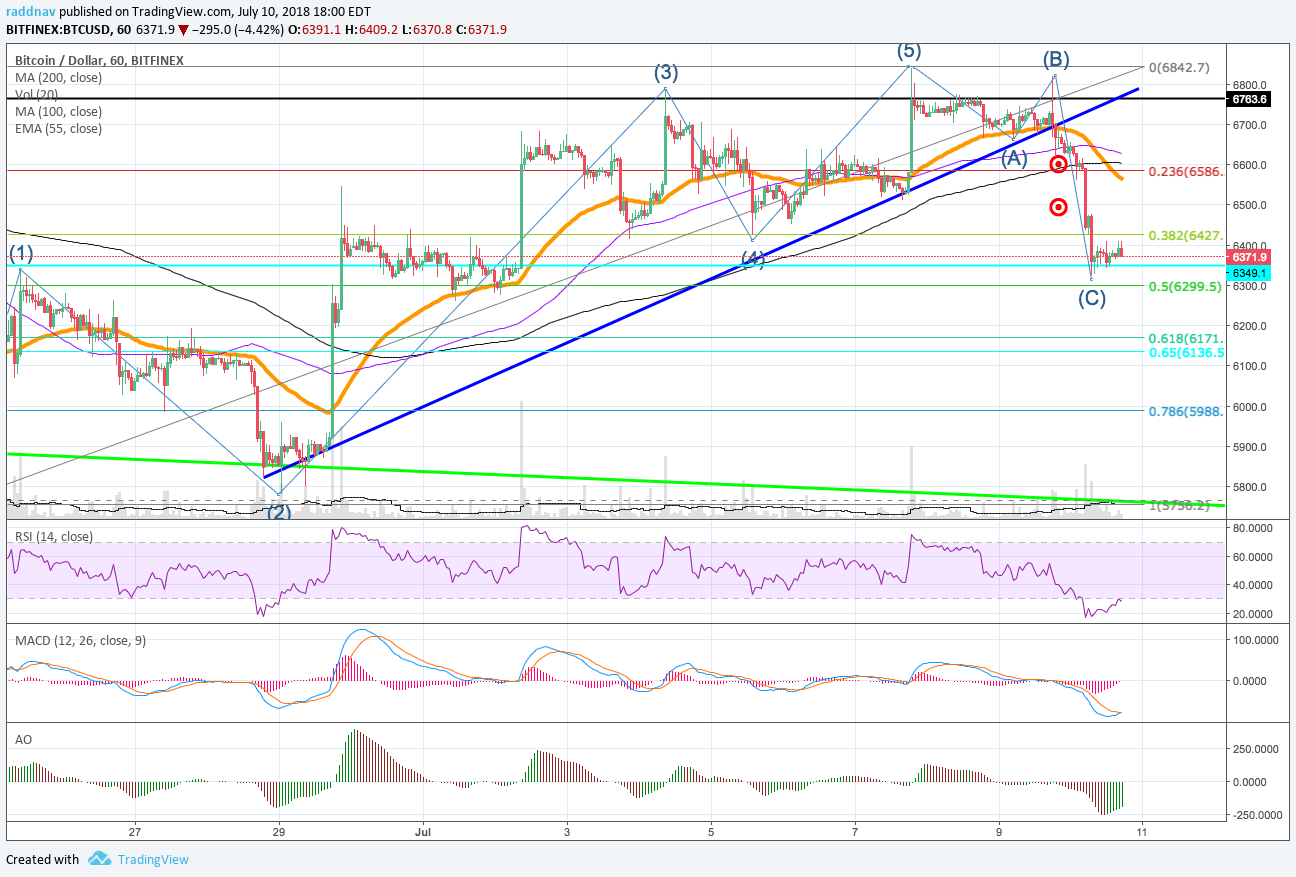 On the daily analog Bitcoin Bitfinex chart, I removed the up-trending pitchfork because price invalidated it, but I really like the inverse head and shoulder pattern that I identified last week. And with today's candle we very well could have the top of that right shoulder. Price does not have to get down to the left shoulder level at $6,100 before reversing upward, however I would definitely like to see more volume like we did on the left shoulder and head level. I have adjusted this corrective Elliot Wave with ABC to extend it longer to where maybe price dips back to the .618 green level at $6,171 ending the wave C and I could then update the inverse head and shoulders accordingly. I would like to see the RSI indicator come back down to the 35 to 37 level and tap that pink up-trending line before another impulse wave upwards. The MACD histogram is bearishly ticking downwards again too, which then we could expect the blue trigger line to take a dip over the next few days as well. So maybe we will get an inverse head and shoulders pattern there too. I would have thought there would be more of a reaction to the AO indicator ticking up through the zero bound line yesterday, and price did break upward first before heading decisively downward. But overall that bear move was overdue, which is why the move was quite fierce relatively for the last few days. A bull target around that .382 $6,427 Fib level makes sense over the next 24 hours and if price does continue down tomorrow, that .618 Fib level at $6,171 for the bears. -More on Vanddar.com 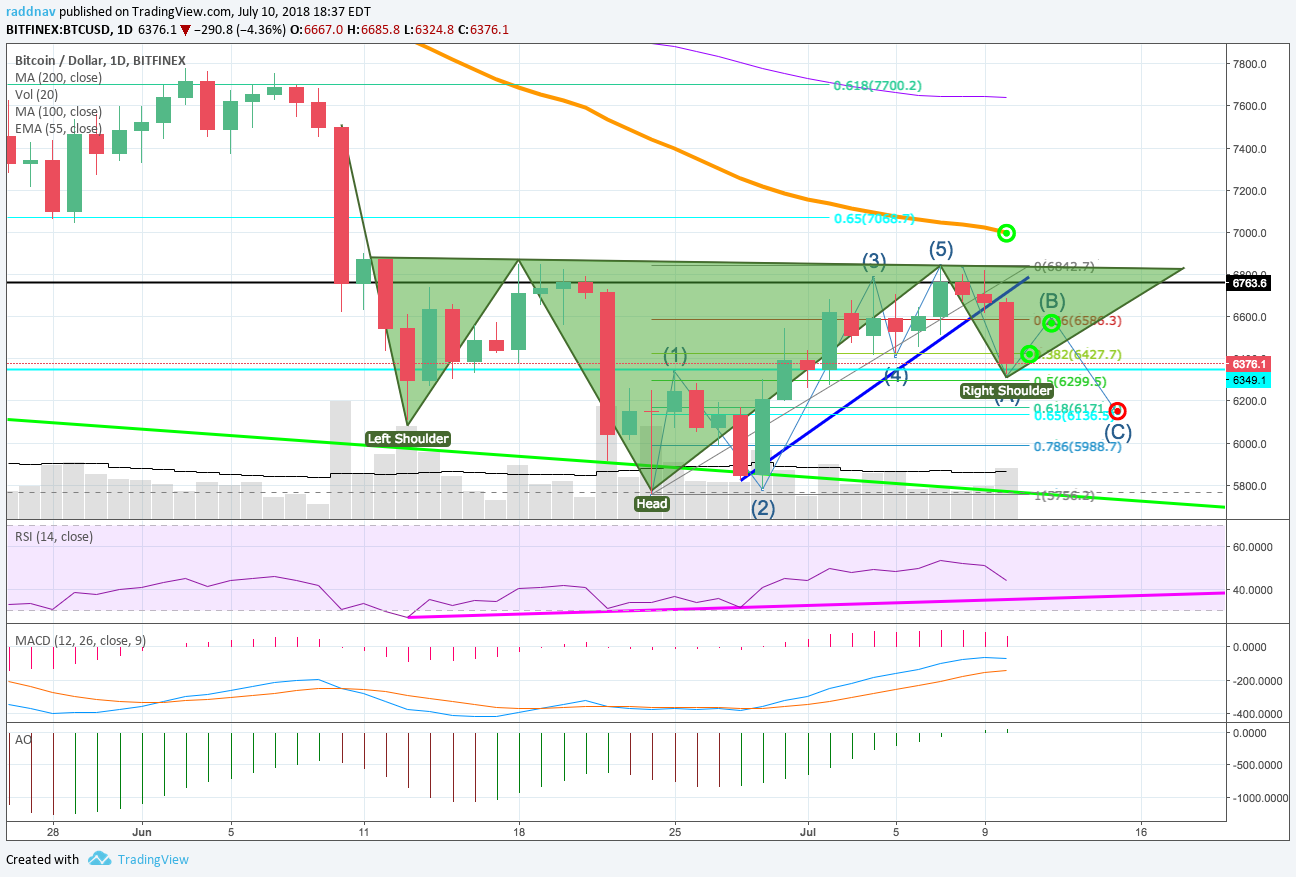 |
| json metadata | {"tags":["bitcoin","btc","crypto"],"image":["https://cdn.steemitimages.com/DQmeaBbp8RYbjmzNVchTdKYUuCwjjekzrEjaCkV7CyFoGYo/image.png","https://cdn.steemitimages.com/DQmQ7cLA5yTgomzbPBJdrcT63peiUeJ6ST5wwGvuEZDc9E9/image.png"],"app":"steemit/0.1","format":"markdown"} |
| parent author | |
| parent permlink | bitcoin |
| permlink | bitcoin-reverse-head-and-shoulder-on-daily-still-in-play |
| title | Bitcoin Reverse Head and Shoulder on Daily Still in Play |
| Transaction Info | Block #24065529/Trx be87b82f6505ee38e63d4cdd756d4e07bc6e8208 |
View Raw JSON Data
{
"block": 24065529,
"op": [
"comment",
{
"author": "vanddar4",
"body": "On the hourly analog Bitcoin Bitfinex chart, you can see how shortly after I posted yesterday, price had some significant upticks in volume and volatility complete with another fake-out move.\n\nThe blue up-trending line we discussed was tapped and launched higher as the bulls made a concerted effort to break that no go area above $6,763. Volume spiked and the bears defended that level successfully as the price could not create a higher wick from the green candle on Saturday evening at $6,839.\n\nA lower high was made at $6,820 at 6pm EST yesterday and price was quickly crushed within a matter of minutes all the way back below the blue up trending support and then in the next pushed below the orange 55 hour EMA, the purple 100 MA, and the black 200 MA over several hours, blowing through the targets I was looking at yesterday. \n\nThe fun did not stop for the bears as once the critical supports were breached they could have their way all the way down to the turquoise horizontal support line at $6,358. There’s been a slight recovery over the past few hours, but the volume has died off for now. \n\nPlacing a Fibonacci retracement from the high on this move to the low back on June 24th yields about a .45 retracement and just short of the key green .5 line. I have also placed some potential points on snapshot below for a potential complete Elliot wave Cycle.\n\nThe important thing to note here is that price found support around the top of the wave 1, which may be why price fell short of hitting the .5 retracement. It is completely possible that price could head lower as it seems that the blue .786 Fib line sitting at $5,988 has been the flavor of the past few weeks on all crypto charts.\n\nThe RSI though is very oversold still sitting at 28.33 and just below 30 from entering the neutral zone. The MACD blue trigger line does appear like it wants to crossover bullishly and the histogram is ticking upward, but I think overall price needs to stabilize around this level for a bit longer to get a better idea on the next move. \n\n\n\nOn the daily analog Bitcoin Bitfinex chart, I removed the up-trending pitchfork because price invalidated it, but I really like the inverse head and shoulder pattern that I identified last week. And with today's candle we very well could have the top of that right shoulder. \n\nPrice does not have to get down to the left shoulder level at $6,100 before reversing upward, however I would definitely like to see more volume like we did on the left shoulder and head level.\n\nI have adjusted this corrective Elliot Wave with ABC to extend it longer to where maybe price dips back to the .618 green level at $6,171 ending the wave C and I could then update the inverse head and shoulders accordingly. \n\nI would like to see the RSI indicator come back down to the 35 to 37 level and tap that pink up-trending line before another impulse wave upwards.\n\nThe MACD histogram is bearishly ticking downwards again too, which then we could expect the blue trigger line to take a dip over the next few days as well. So maybe we will get an inverse head and shoulders pattern there too. \n\nI would have thought there would be more of a reaction to the AO indicator ticking up through the zero bound line yesterday, and price did break upward first before heading decisively downward. But overall that bear move was overdue, which is why the move was quite fierce relatively for the last few days. \n\nA bull target around that .382 $6,427 Fib level makes sense over the next 24 hours and if price does continue down tomorrow, that .618 Fib level at $6,171 for the bears.\n\n-More on Vanddar.com\n\n",
"json_metadata": "{\"tags\":[\"bitcoin\",\"btc\",\"crypto\"],\"image\":[\"https://cdn.steemitimages.com/DQmeaBbp8RYbjmzNVchTdKYUuCwjjekzrEjaCkV7CyFoGYo/image.png\",\"https://cdn.steemitimages.com/DQmQ7cLA5yTgomzbPBJdrcT63peiUeJ6ST5wwGvuEZDc9E9/image.png\"],\"app\":\"steemit/0.1\",\"format\":\"markdown\"}",
"parent_author": "",
"parent_permlink": "bitcoin",
"permlink": "bitcoin-reverse-head-and-shoulder-on-daily-still-in-play",
"title": "Bitcoin Reverse Head and Shoulder on Daily Still in Play"
}
],
"op_in_trx": 0,
"timestamp": "2018-07-10T22:42:57",
"trx_id": "be87b82f6505ee38e63d4cdd756d4e07bc6e8208",
"trx_in_block": 21,
"virtual_op": 0
}vanddar4published a new post: bitcoin-daily-ao-bullishly-breaching-zero-bound2018/07/09 22:38:03
vanddar4published a new post: bitcoin-daily-ao-bullishly-breaching-zero-bound
2018/07/09 22:38:03
| author | vanddar4 |
| body | On the hourly analog Bitcoin Bitfinex chart, we have watched price bounce over the weekend off of the dark blue up-trending support line marked around $6,525 all the way up to the high of $6,840. Price has now retraced back to the previous peak at $6,700 where it’s finding good support for the last 10 hours. I don’t expect this consolidation to last much longer on the hourly chart as price is now encroaching on that dark blue up-trending line again. Price is also still finding good support around the orange 55 EMA line. There are three wicks dipping beneath that level that the bulls are defending well, but they are not going on the offensive to drive price up either. I think that the reaction to this dark blue trend line will be telling in the short-term. If price moves up with the trend line it’s likely that the $6,763 level at the black horizontal resistance line will be tested again. The bears have deemed that level a no go zone area for now, where there are quite a few candle wicks testing that level. The market will have made a decision by tomorrow at this time and this kind of ascending triangle between the blue and black lines will be broken. The good news for the bulls is that all of the moving averages are currently stacked bullishly and even if the orange 55 EMA is broken the purple 100 and black 200 lines, should provide some support before breaking down even further. The RSI is neutral at 48.71 and is waiting for a move either direction and the MACD is approaching that zero bound bearishly, but also looks pretty indecisive. I have also added the AO Awesome Oscillator indicator today and you can see how that has had a bullish tick over the past hour, and has been trending upward with that blue line. The bullish momentum is fairly weak right now, so like many of these other big green candles, we need to watch closely for sudden increases in volume momentum. On the bullish side, I think my target from last week around $7,040 still stands, but I thought it would may have played out a little differently, so I have moved the target forward in time by a few days. On the bearish side, that target of $6,600 looks good around the black 200 hour moving average line. 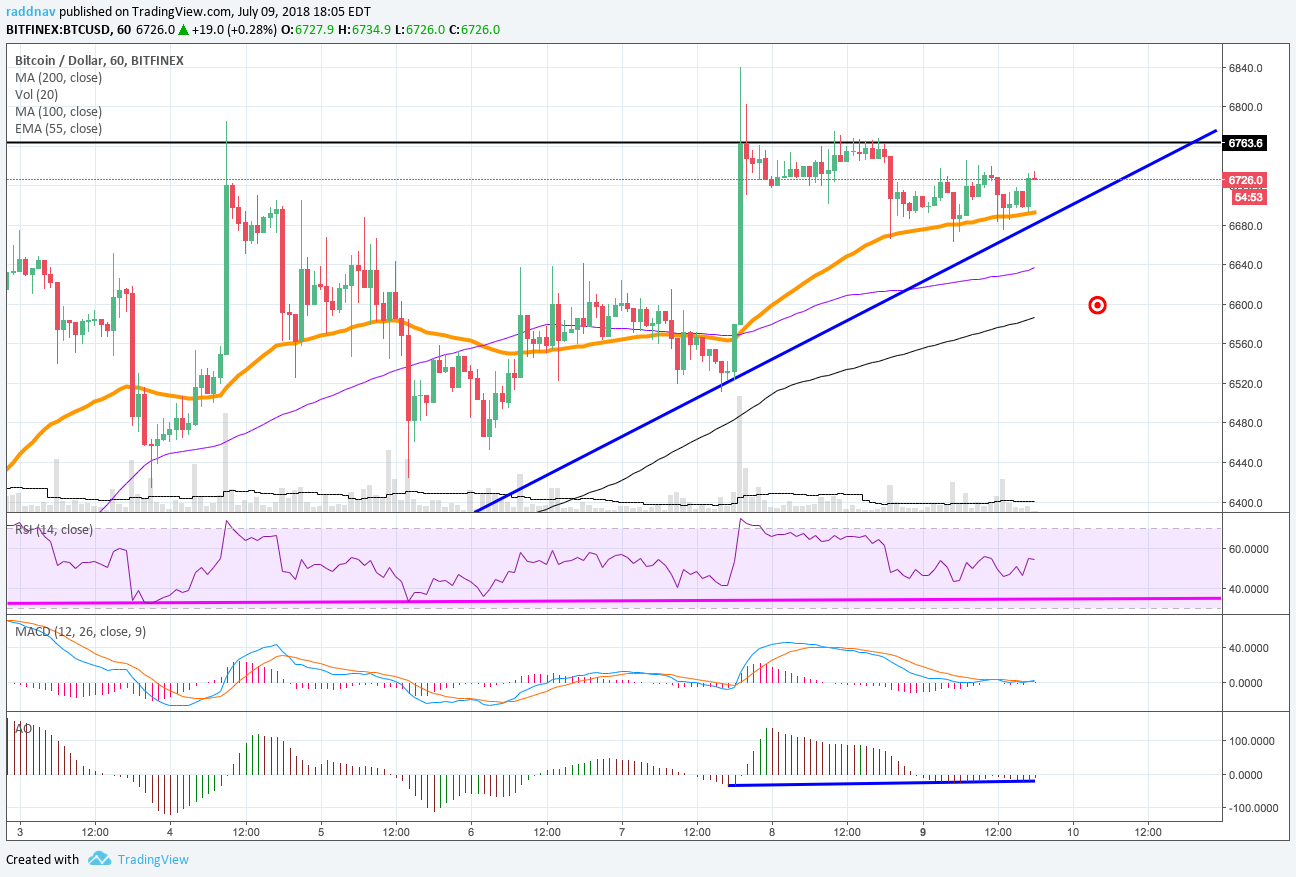 On the daily analog Bitcoin Bitfinex chart, I have created an up-trending pitchfork with the pivot from the low on June 24th, the swing high from June 25th, and then the swing low from June 29th. The pitchfork works pretty well with the pricing action so far especially on the lower time frame, but you can see price drifting into the purple channel, where it should bounce off the bottom side of that channel which also coincides with the blue trend-line. If price does bounce here, that green target around $7,040 is a strong possibility and also coincides nicely with where that orange 55 day EMA will be. The RSI here is also fairly neutral at 52.91 and the bullish divergence marked by the pink line is still there. The MACD also has good bullish momentum and is approaching the zero bound. Amazingly enough, the AO has breached the zero bound for the first time since May 13th, which I have circled on the chart and could also be indication of a further pop upward. The reverse head and shoulder bottom that I discussed last week could still be in play, however it may take a different form and will need to be redrawn. On the bearish side a breakdown to the outer band of the pitchfork in red, could take place at $6,500, but even that area should have decent horizontal support. Overall, I think a bullish move is more likely. -More on Vanddar.com 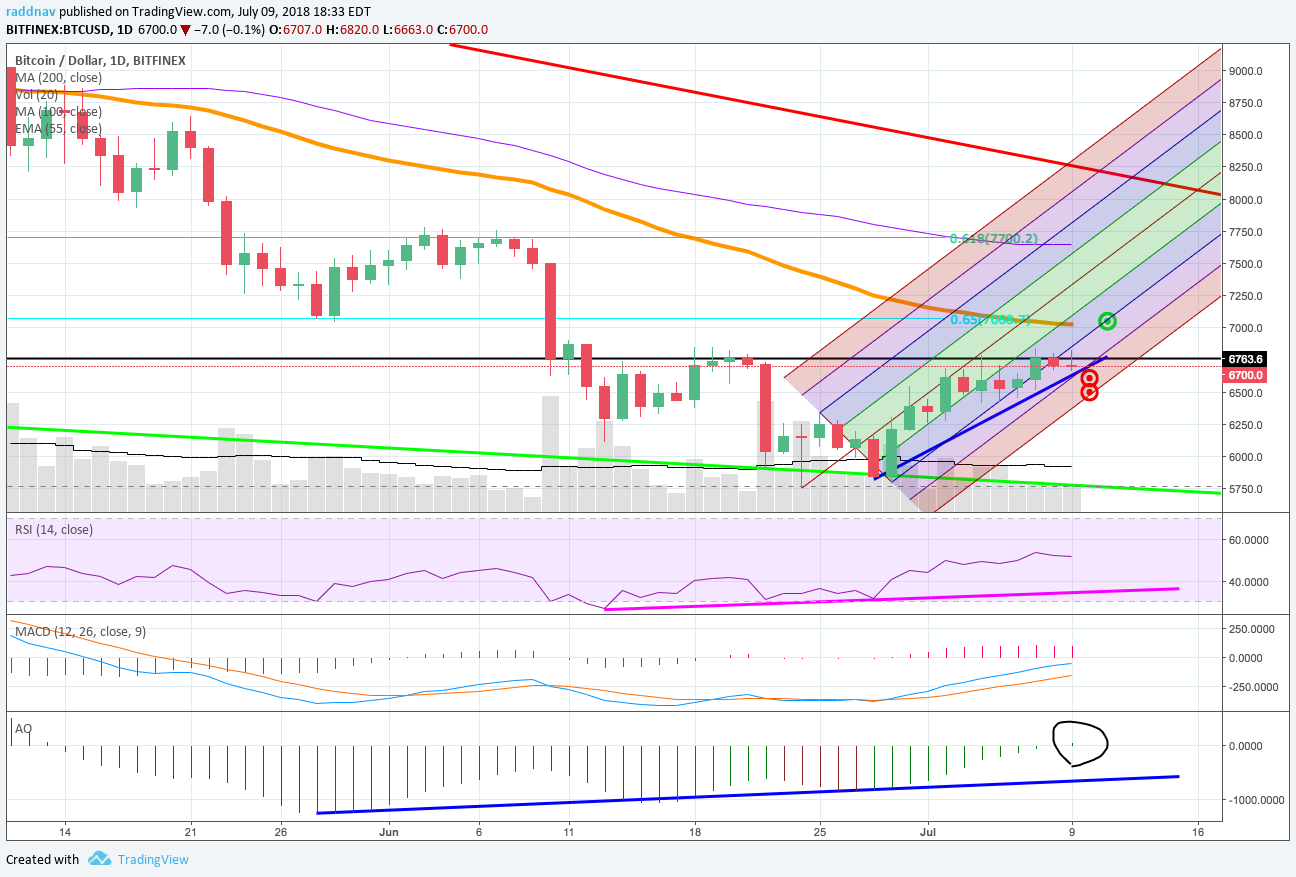 |
| json metadata | {"tags":["bitcoin","btc","crypto","cryptocurrencies"],"image":["https://cdn.steemitimages.com/DQmXdKDyuJynAD26C1NWgsv6TX46GEm6jLNp7JgrYkFYKot/image.png","https://cdn.steemitimages.com/DQmdy6gizbEzBnmb75ztWUu9mYgdYAM4eUXsFeFdhHgwkVF/image.png"],"app":"steemit/0.1","format":"markdown"} |
| parent author | |
| parent permlink | bitcoin |
| permlink | bitcoin-daily-ao-bullishly-breaching-zero-bound |
| title | Bitcoin Daily AO Bullishly Breaching Zero Bound |
| Transaction Info | Block #24036638/Trx 7aa2467f19274d6e08a400fe28baa52fd53d9612 |
View Raw JSON Data
{
"block": 24036638,
"op": [
"comment",
{
"author": "vanddar4",
"body": "On the hourly analog Bitcoin Bitfinex chart, we have watched price bounce over the weekend off of the dark blue up-trending support line marked around $6,525 all the way up to the high of $6,840. Price has now retraced back to the previous peak at $6,700 where it’s finding good support for the last 10 hours.\n\nI don’t expect this consolidation to last much longer on the hourly chart as price is now encroaching on that dark blue up-trending line again. Price is also still finding good support around the orange 55 EMA line. There are three wicks dipping beneath that level that the bulls are defending well, but they are not going on the offensive to drive price up either.\n\nI think that the reaction to this dark blue trend line will be telling in the short-term. If price moves up with the trend line it’s likely that the $6,763 level at the black horizontal resistance line will be tested again. The bears have deemed that level a no go zone area for now, where there are quite a few candle wicks testing that level.\n\nThe market will have made a decision by tomorrow at this time and this kind of ascending triangle between the blue and black lines will be broken. The good news for the bulls is that all of the moving averages are currently stacked bullishly and even if the orange 55 EMA is broken the purple 100 and black 200 lines, should provide some support before breaking down even further.\n\nThe RSI is neutral at 48.71 and is waiting for a move either direction and the MACD is approaching that zero bound bearishly, but also looks pretty indecisive. I have also added the AO Awesome Oscillator indicator today and you can see how that has had a bullish tick over the past hour, and has been trending upward with that blue line. The bullish momentum is fairly weak right now, so like many of these other big green candles, we need to watch closely for sudden increases in volume momentum.\n\nOn the bullish side, I think my target from last week around $7,040 still stands, but I thought it would may have played out a little differently, so I have moved the target forward in time by a few days. On the bearish side, that target of $6,600 looks good around the black 200 hour moving average line.\n\n\n\nOn the daily analog Bitcoin Bitfinex chart, I have created an up-trending pitchfork with the pivot from the low on June 24th, the swing high from June 25th, and then the swing low from June 29th. \n\nThe pitchfork works pretty well with the pricing action so far especially on the lower time frame, but you can see price drifting into the purple channel, where it should bounce off the bottom side of that channel which also coincides with the blue trend-line.\n\nIf price does bounce here, that green target around $7,040 is a strong possibility and also coincides nicely with where that orange 55 day EMA will be.\n\nThe RSI here is also fairly neutral at 52.91 and the bullish divergence marked by the pink line is still there. The MACD also has good bullish momentum and is approaching the zero bound.\n\nAmazingly enough, the AO has breached the zero bound for the first time since May 13th, which I have circled on the chart and could also be indication of a further pop upward.\n\nThe reverse head and shoulder bottom that I discussed last week could still be in play, however it may take a different form and will need to be redrawn. \n\nOn the bearish side a breakdown to the outer band of the pitchfork in red, could take place at $6,500, but even that area should have decent horizontal support. Overall, I think a bullish move is more likely.\n\n-More on Vanddar.com\n\n",
"json_metadata": "{\"tags\":[\"bitcoin\",\"btc\",\"crypto\",\"cryptocurrencies\"],\"image\":[\"https://cdn.steemitimages.com/DQmXdKDyuJynAD26C1NWgsv6TX46GEm6jLNp7JgrYkFYKot/image.png\",\"https://cdn.steemitimages.com/DQmdy6gizbEzBnmb75ztWUu9mYgdYAM4eUXsFeFdhHgwkVF/image.png\"],\"app\":\"steemit/0.1\",\"format\":\"markdown\"}",
"parent_author": "",
"parent_permlink": "bitcoin",
"permlink": "bitcoin-daily-ao-bullishly-breaching-zero-bound",
"title": "Bitcoin Daily AO Bullishly Breaching Zero Bound"
}
],
"op_in_trx": 0,
"timestamp": "2018-07-09T22:38:03",
"trx_id": "7aa2467f19274d6e08a400fe28baa52fd53d9612",
"trx_in_block": 26,
"virtual_op": 0
}alphabotupvoted (1.00%) @vanddar4 / bitcoin-bullish-macd-patterns2018/07/06 20:54:09
alphabotupvoted (1.00%) @vanddar4 / bitcoin-bullish-macd-patterns
2018/07/06 20:54:09
| author | vanddar4 |
| permlink | bitcoin-bullish-macd-patterns |
| voter | alphabot |
| weight | 100 (1.00%) |
| Transaction Info | Block #23948194/Trx 9d15388a01f00b1b0f1659ccb25580c20beaf110 |
View Raw JSON Data
{
  "block": 23948194,
  "op": [
    "vote",
    {
      "author": "vanddar4",
      "permlink": "bitcoin-bullish-macd-patterns",
      "voter": "alphabot",
      "weight": 100
    }
  ],
  "op_in_trx": 0,
  "timestamp": "2018-07-06T20:54:09",
  "trx_id": "9d15388a01f00b1b0f1659ccb25580c20beaf110",
  "trx_in_block": 10,
  "virtual_op": 0
}vanddar4published a new post: bitcoin-bullish-macd-patterns2018/07/06 20:53:57
vanddar4published a new post: bitcoin-bullish-macd-patterns
2018/07/06 20:53:57
| author | vanddar4 |
| body | The holiday shortened week comes to an end as Bitcoin drifts sideways from it’s recent gains. Let’s take a look at what pricing action may be next. On the hourly analog Bitcoin Bitfinex chart, my targets were pretty close that I was looking at for a price range however, my timing was a bit off. We were tracking this rising wedge on Tuesday where price looked like it was ready to break either way. I had thought the price might rebound off that lower dark blue line in the channel first and break higher fail and then break lower. The timing was a bit off, but the price targets turned out to work pretty well as price. First price broke down out of the rising wedge formation and then launched higher back through the wedge and tested the upper resistance line at $6,785 before coming back down. Since then price has been moving sideways, oscillating around the 55 EMA orange line and 100 MA purple line. I have drawn a blue rectangle that has contained price in a $200 range pretty well since the breakdown on Tuesday between $6,640 and $6,440. If price can get a close above or below these levels you can expect a move in the same direction about equal the width of rectangle. You will also notice the big head and shoulders top that could be forming here as well. If that neck line gets broken around the same range as the rectangle at $6,430, I think a revisit to the .5 fib line at $6,284 is likely. The 200 hour moving average might put up a bit of support around $6,400 but I think the bears would take over the trend at that point and we could see this downward move sometime Saturday night or Sunday. My target from Tuesday was at $6,190, so we will see if price can hit that level. If price does manage to break to the upside, I think we could see more highs if price can get a close above $6,720, where the body of the last highest candle close is. All the indicators are pretty neutral for the most part, but the MACD histogram is beginning to tick downward and could be signaling more weakness. Additionally the MACD has formed a downward wedge between the pink lines, which I have added as a separate snapshot, so you can see it closer. Maybe price drifts down to that -25 lower pink support line and than bullishly breaks upward in price. 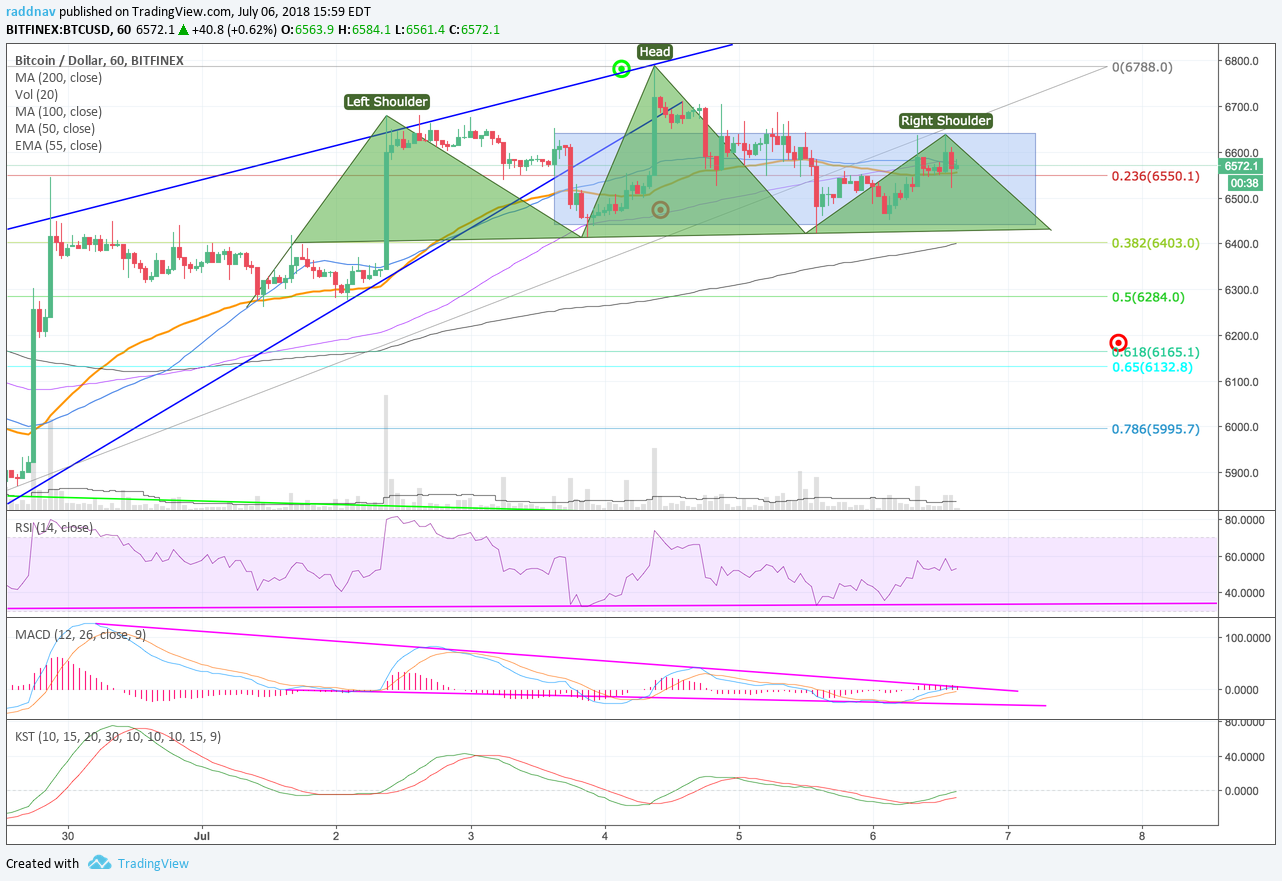 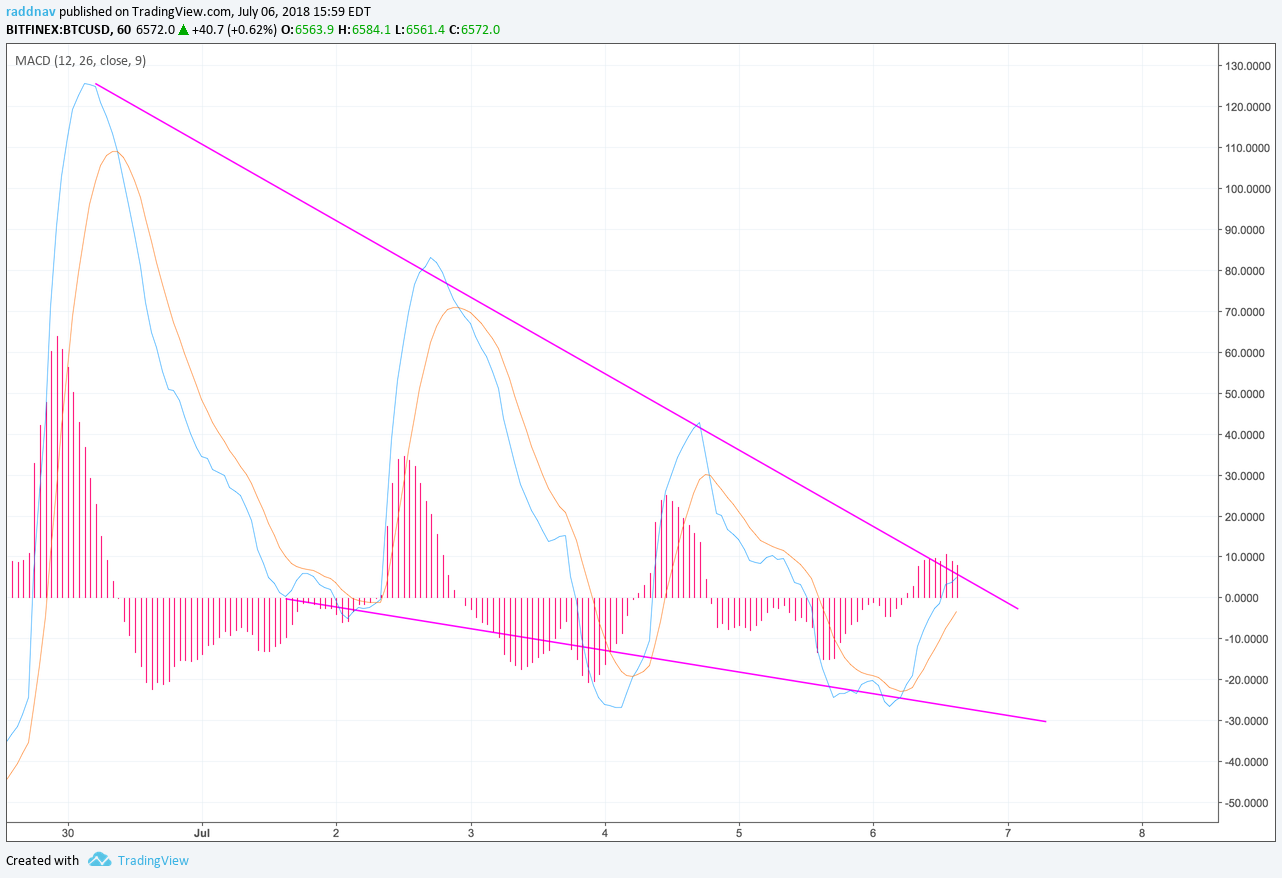 On the daily analog Bitcoin Bitfinex chart, the reverse head and shoulder bottom is still in play if the hourly chart patterns plays out. The low the could easily be Monday July 9th where that red target is around $6,165 and then a springboard move back up to that $7,030 where blue 50 day MA and orange 55 day EMA could reside. Price could easily blow through that level too in an effort to test $7,500 again and then we would just have to see what happens next. If price does move down to $6,100 and is showing a lack of volume, we will look closer at the bearish scenario on Monday, but I would anticipate some big wicks that show a reversal. The RSI still looks good showing that strong bullish reversal divergence underlined by the pink line and I can that see that line acting as support around 35 if price does breakdown. I can also even see a potential reverse head and shoulders pattern on the MACD lines that I outlined and included an additional snapshot to look at closer. Since the MACD is a lagging a indicator it may take little bit longer to play out compared to price, however it is a possibly and an encouraging sign for the bulls. I’ll leave it there for now. Have a good weekend! 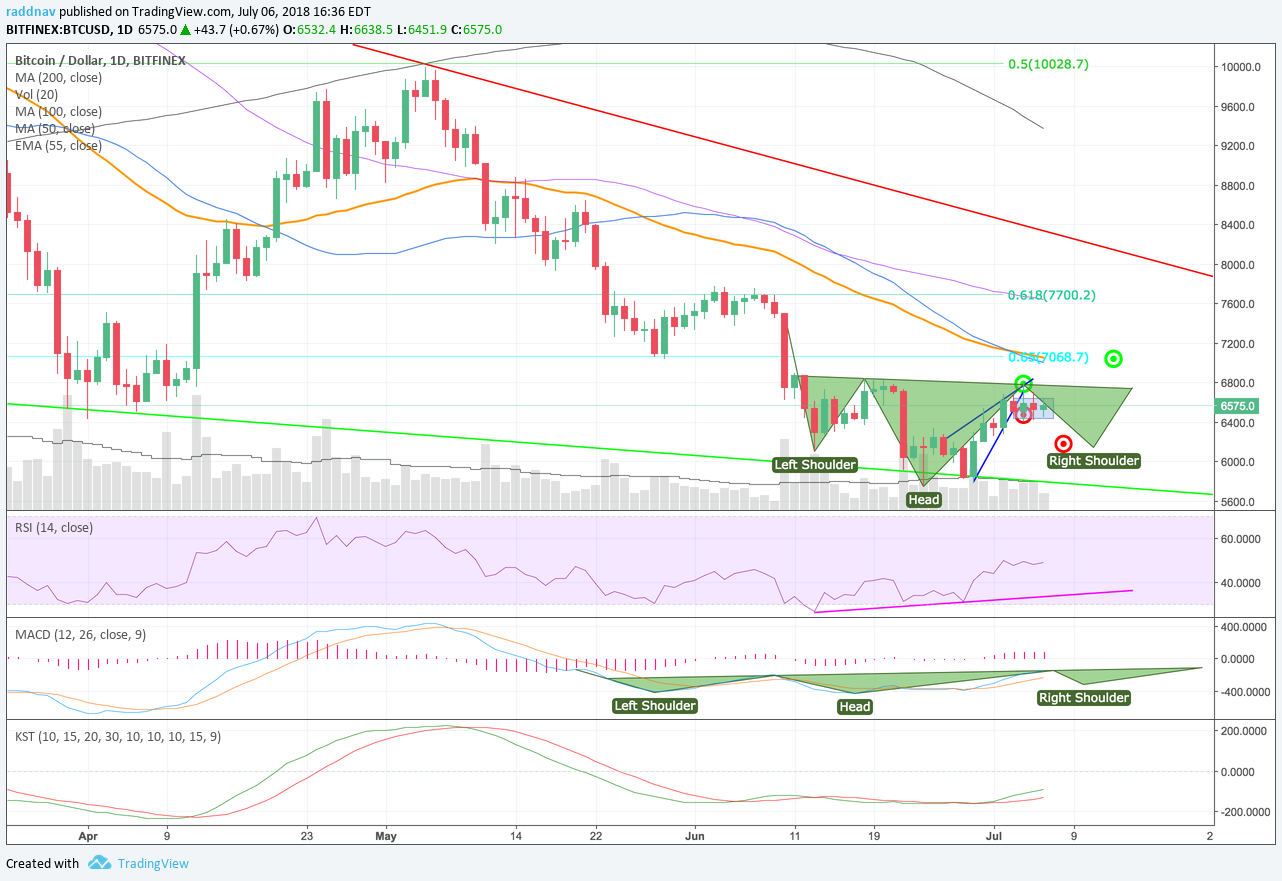 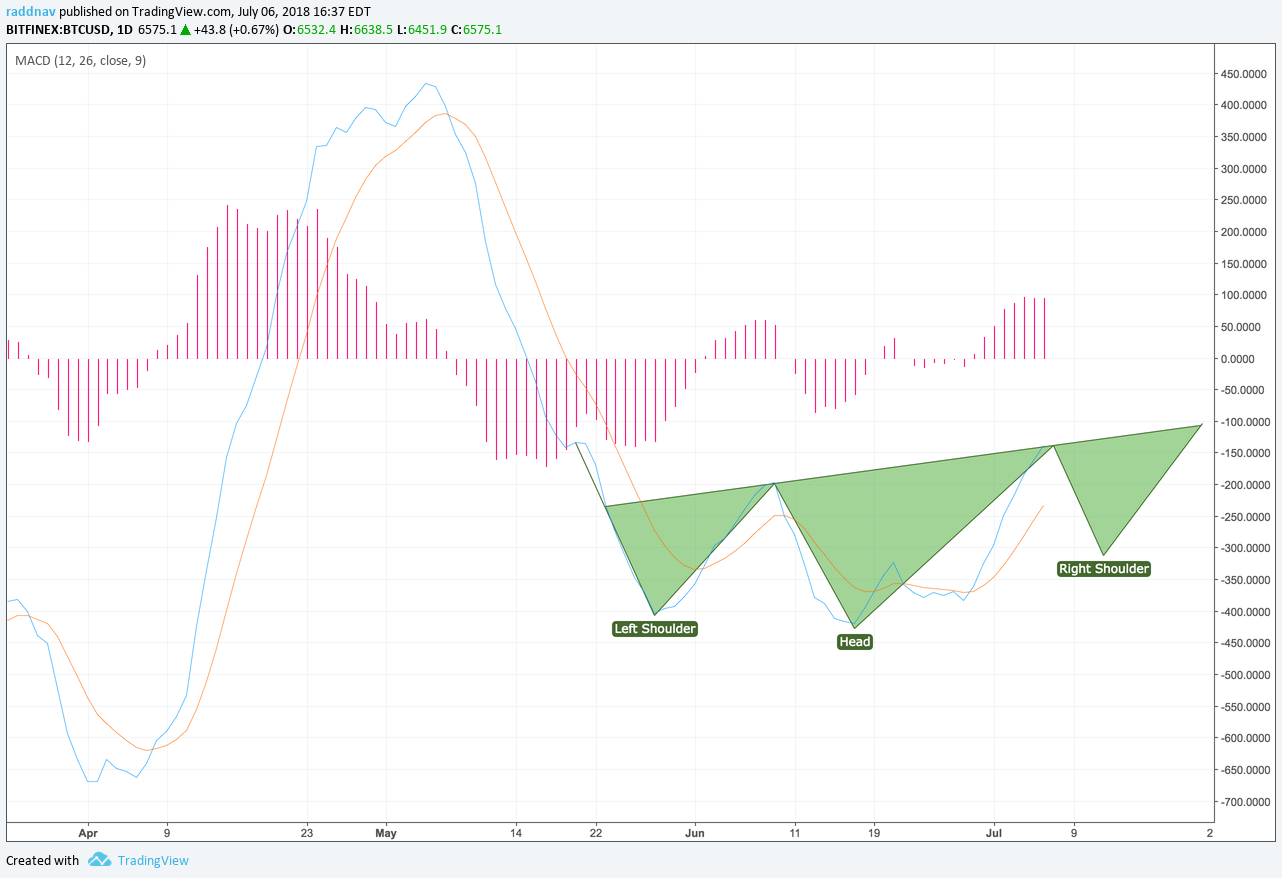 -More on Vanddar.com |
| json metadata | {"tags":["bitcoin","btc","cryptocurrencies","crypto"],"image":["https://cdn.steemitimages.com/DQmSepDz44nE2AuEmR99LkK5iZGUZLvbUY6kAe7D5ZzGevg/image.png","https://cdn.steemitimages.com/DQmNQpg6cnDN821VRZXy4LuNhPMsTWDiwHVoGjbQpM8ZT2H/image.png","https://cdn.steemitimages.com/DQmVzKNPuWDzAfTGuc8uJNWtdBn3NTySThL6hYFFz89MHW9/image.png","https://cdn.steemitimages.com/DQmZ1fARQGi9mGrksrPsUVQ9RaeL61HkaTLgkK9UbbHZgyM/image.png"],"app":"steemit/0.1","format":"markdown"} |
| parent author | |
| parent permlink | bitcoin |
| permlink | bitcoin-bullish-macd-patterns |
| title | Bitcoin Bullish MACD Patterns |
| Transaction Info | Block #23948190/Trx a84a5717a0a31546882b3cff86551ca40e38b44a |
View Raw JSON Data
{
"block": 23948190,
"op": [
"comment",
{
"author": "vanddar4",
"body": "The holiday shortened week comes to an end as Bitcoin drifts sideways from it’s recent gains. Let’s take a look at what pricing action may be next.\n\nOn the hourly analog Bitcoin Bitfinex chart, my targets were pretty close that I was looking at for a price range however, my timing was a bit off. We were tracking this rising wedge on Tuesday where price looked like it was ready to break either way. \n\nI had thought the price might rebound off that lower dark blue line in the channel first and break higher fail and then break lower. The timing was a bit off, but the price targets turned out to work pretty well as price. First price broke down out of the rising wedge formation and then launched higher back through the wedge and tested the upper resistance line at $6,785 before coming back down.\n\nSince then price has been moving sideways, oscillating around the 55 EMA orange line and 100 MA purple line. I have drawn a blue rectangle that has contained price in a $200 range pretty well since the breakdown on Tuesday between $6,640 and $6,440. If price can get a close above or below these levels you can expect a move in the same direction about equal the width of rectangle. \n\nYou will also notice the big head and shoulders top that could be forming here as well. If that neck line gets broken around the same range as the rectangle at $6,430, I think a revisit to the .5 fib line at $6,284 is likely. \n\nThe 200 hour moving average might put up a bit of support around $6,400 but I think the bears would take over the trend at that point and we could see this downward move sometime Saturday night or Sunday. My target from Tuesday was at $6,190, so we will see if price can hit that level. \n\nIf price does manage to break to the upside, I think we could see more highs if price can get a close above $6,720, where the body of the last highest candle close is.\n\nAll the indicators are pretty neutral for the most part, but the MACD histogram is beginning to tick downward and could be signaling more weakness. Additionally the MACD has formed a downward wedge between the pink lines, which I have added as a separate snapshot, so you can see it closer. Maybe price drifts down to that -25 lower pink support line and than bullishly breaks upward in price.\n\n\n\n\nOn the daily analog Bitcoin Bitfinex chart, the reverse head and shoulder bottom is still in play if the hourly chart patterns plays out. \n\nThe low the could easily be Monday July 9th where that red target is around $6,165 and then a springboard move back up to that $7,030 where blue 50 day MA and orange 55 day EMA could reside. Price could easily blow through that level too in an effort to test $7,500 again and then we would just have to see what happens next. \n\nIf price does move down to $6,100 and is showing a lack of volume, we will look closer at the bearish scenario on Monday, but I would anticipate some big wicks that show a reversal. \n\nThe RSI still looks good showing that strong bullish reversal divergence underlined by the pink line and I can that see that line acting as support around 35 if price does breakdown. \n\nI can also even see a potential reverse head and shoulders pattern on the MACD lines that I outlined and included an additional snapshot to look at closer. Since the MACD is a lagging a indicator it may take little bit longer to play out compared to price, however it is a possibly and an encouraging sign for the bulls. I’ll leave it there for now. Have a good weekend!\n\n\n\n\n-More on Vanddar.com",
"json_metadata": "{\"tags\":[\"bitcoin\",\"btc\",\"cryptocurrencies\",\"crypto\"],\"image\":[\"https://cdn.steemitimages.com/DQmSepDz44nE2AuEmR99LkK5iZGUZLvbUY6kAe7D5ZzGevg/image.png\",\"https://cdn.steemitimages.com/DQmNQpg6cnDN821VRZXy4LuNhPMsTWDiwHVoGjbQpM8ZT2H/image.png\",\"https://cdn.steemitimages.com/DQmVzKNPuWDzAfTGuc8uJNWtdBn3NTySThL6hYFFz89MHW9/image.png\",\"https://cdn.steemitimages.com/DQmZ1fARQGi9mGrksrPsUVQ9RaeL61HkaTLgkK9UbbHZgyM/image.png\"],\"app\":\"steemit/0.1\",\"format\":\"markdown\"}",
"parent_author": "",
"parent_permlink": "bitcoin",
"permlink": "bitcoin-bullish-macd-patterns",
"title": "Bitcoin Bullish MACD Patterns"
}
],
"op_in_trx": 0,
"timestamp": "2018-07-06T20:53:57",
"trx_id": "a84a5717a0a31546882b3cff86551ca40e38b44a",
"trx_in_block": 29,
"virtual_op": 0
}magpieloverupvoted (100.00%) @vanddar4 / bitcoin-potential-inverse-head-and-shoulder-bottom-on-daily2018/07/03 20:32:18
magpieloverupvoted (100.00%) @vanddar4 / bitcoin-potential-inverse-head-and-shoulder-bottom-on-daily
2018/07/03 20:32:18
| author | vanddar4 |
| permlink | bitcoin-potential-inverse-head-and-shoulder-bottom-on-daily |
| voter | magpielover |
| weight | 10000 (100.00%) |
| Transaction Info | Block #23861508/Trx 6897c8682a59e1928f99253ee2308dd9d1aec7d5 |
View Raw JSON Data
{
  "block": 23861508,
  "op": [
    "vote",
    {
      "author": "vanddar4",
      "permlink": "bitcoin-potential-inverse-head-and-shoulder-bottom-on-daily",
      "voter": "magpielover",
      "weight": 10000
    }
  ],
  "op_in_trx": 0,
  "timestamp": "2018-07-03T20:32:18",
  "trx_id": "6897c8682a59e1928f99253ee2308dd9d1aec7d5",
  "trx_in_block": 1,
  "virtual_op": 0
}vanddar4published a new post: bitcoin-potential-inverse-head-and-shoulder-bottom-on-daily2018/07/03 20:00:36
vanddar4published a new post: bitcoin-potential-inverse-head-and-shoulder-bottom-on-daily
2018/07/03 20:00:36
| author | vanddar4 |
| body | On the hourly analog Bitcoin Bitfinex chart, price hasn’t done a whole lot over the past 24 hours besides move downwards about $75, but it looks like there is some bearishness on the horizon. I have drawn dark blue two lines that represents a rising wedge that is currently containing the price well and typically break to the downside. I would have thought that bearish move from 6am EST this morning would have tapped the downside of that wedge, but the bulls are freeing price a currently at $6,575. I really think a retest of that 55 EMA in orange is due before any consideration of another extension upward, but we could get some clues in the next hour or two, as price is just drifting to the outer resistance on wedge that should force price to make a decision either way. I slipped a quick Fibonacci retracement on here as well from the last upward move yesterday and currently price has tracked back to the red .236 Fib level at $6,583, but I think we could potentially drop back to the .5 level in green at $6,472. That might just be a wick downward from the 55 EMA which could be a good springboard higher, but if this continues sideways into tomorrow that support may find itself converging with the purple 100 moving average as well. The RSI has reset nicely to neutral levels and at 49.2 and any move downward will help it enter overbought territory quickly which the bulls should gobble-up in this up trend. If they don’t that should be a warning sign. The histogram on the MACD is slowly starting to trend upward from below the 0 bound territory, which is a good sign for the bulls, however the blue trigger line has not started curling upwards yet, so price may continue sideways for a bit longer. I have also added the KST indicator which means Know Sure Thing and is a momentum oscillator that shows compiles 4 different rates of change on differing weighted time frames that can basically be used like the RSI and MACD to find divergence in price as well as buy sell signals. It’s similar to the MACD in the function of reading it, but the timing is a little different. I thought I would just try it out for today. Anyway you can see the bearish divergence on the MACD and KST, which I have highlighted with the pink line. The RSI indicator is showing a little bullish continuation momentum though, so don’t be surprised if there is a fake-out up to around $6,775 and then down out of this wedge. 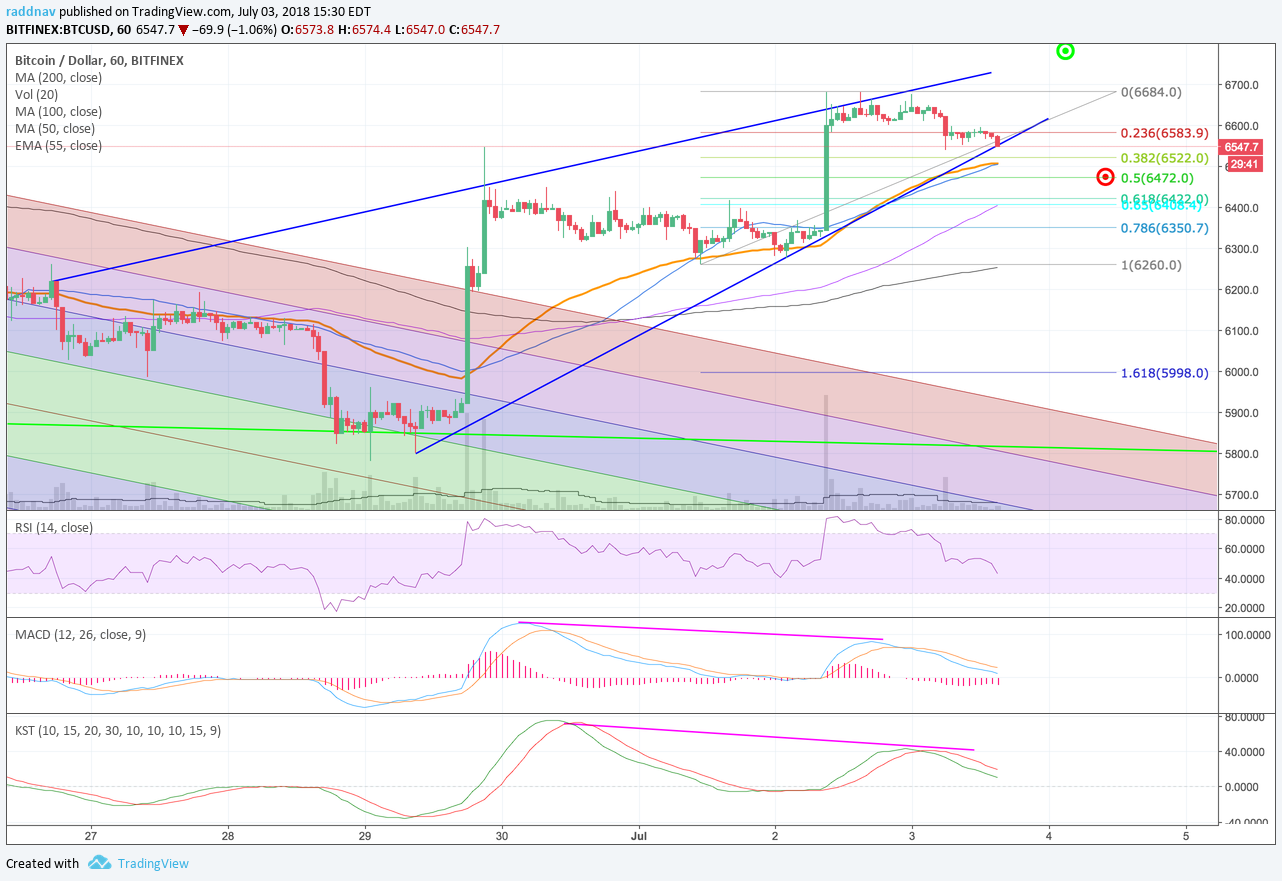 On the daily analog Bitcoin Bitfinex chart, there is not a whole lot to update from yesterday, but I wanted to provide the idea of a big inverse head and shoulder pattern here. You can see the left shoulder being the downward move from June 13th and the head being the low from June 24th. That would make the neck line slightly downward sloping and currently around where we are right now at $6,650. If price does begin to roll over the next few days, this could be a potential scenario that could play out, where price heads back down to $6,100 as a right shoulder, everyone starts freaking out about $4K levels again and then price reverses on huge volume confirming the bottom and subsequent uptrend leg. In an ideal world this would also confirm bullish divergence for a third time on the pink RSI trend line I have drawn at around 34.91 and then spring off that level, possibly up to that green target around $7,000 by July 13th. Obviously that $6,100 level has been providing strong support for a few months now and I definitely think it could hold up again if tested. The MACD and KST are also quite dead right now sitting below the zero bound, but are beginning to trend upward. The ship may begin to turn bullishly, but ships are also slow to respond in changes of direction. The opposite of the euphoria many were experiencing back in December and January. Have a good holiday if your celebrating. -More on Vanddar.com 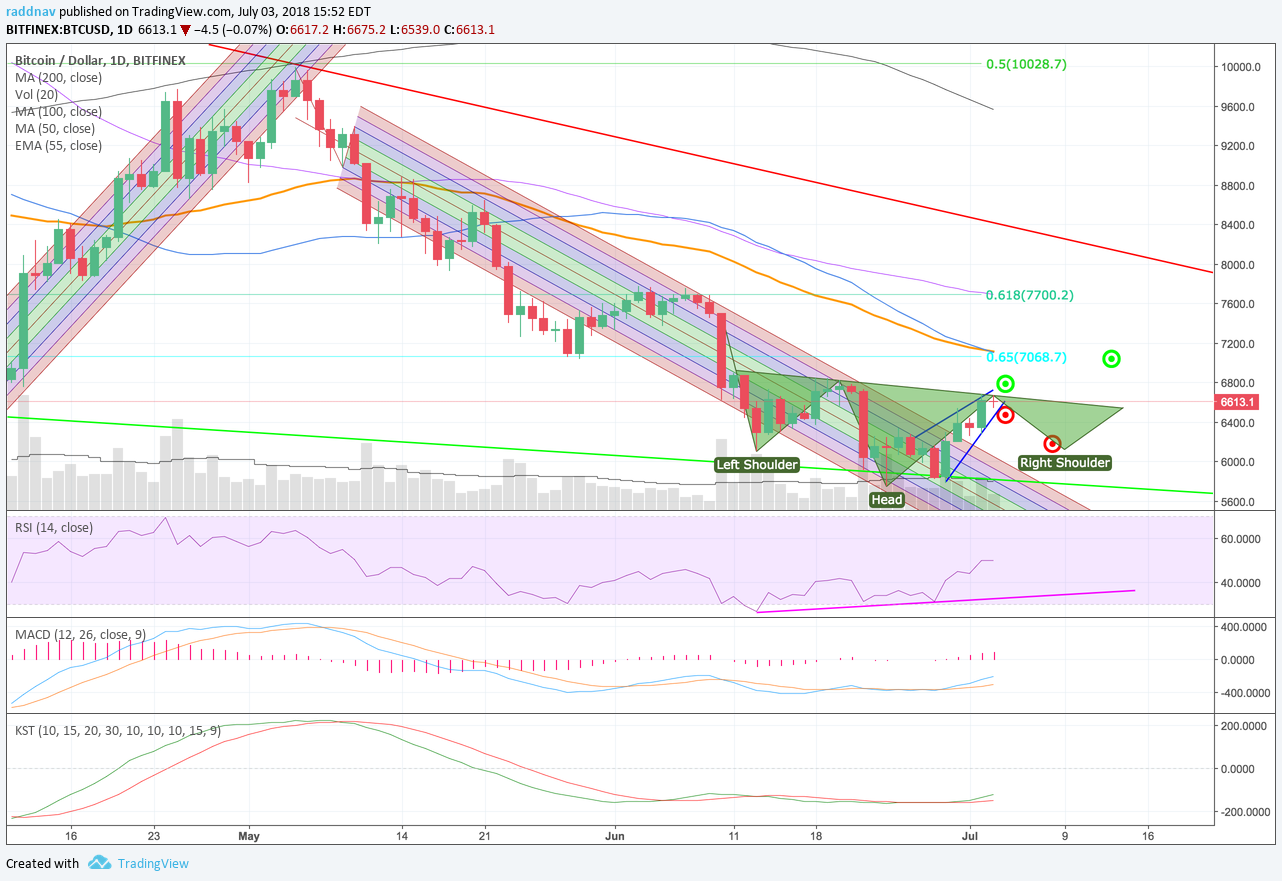 |
| json metadata | {"tags":["bitcoin","btc","crypto"],"image":["https://cdn.steemitimages.com/DQmT3MgtnShwk8PAz1Kn1zRc7CNcxy2QqbpusVeQWaTKw3Y/image.png","https://cdn.steemitimages.com/DQmUWWse5dchePeWgi7DgtjfdRKfAgpJQuygoTsDZ9Zs7gW/image.png"],"app":"steemit/0.1","format":"markdown"} |
| parent author | |
| parent permlink | bitcoin |
| permlink | bitcoin-potential-inverse-head-and-shoulder-bottom-on-daily |
| title | Bitcoin Potential Inverse Head and Shoulder Bottom on Daily |
| Transaction Info | Block #23860877/Trx 86e97c3935e3427697d6ddb1382bd49a41ad91df |
View Raw JSON Data
{
"block": 23860877,
"op": [
"comment",
{
"author": "vanddar4",
"body": "On the hourly analog Bitcoin Bitfinex chart, price hasn’t done a whole lot over the past 24 hours besides move downwards about $75, but it looks like there is some bearishness on the horizon. \n\nI have drawn dark blue two lines that represents a rising wedge that is currently containing the price well and typically break to the downside. I would have thought that bearish move from 6am EST this morning would have tapped the downside of that wedge, but the bulls are freeing price a currently at $6,575.\n\nI really think a retest of that 55 EMA in orange is due before any consideration of another extension upward, but we could get some clues in the next hour or two, as price is just drifting to the outer resistance on wedge that should force price to make a decision either way.\n\nI slipped a quick Fibonacci retracement on here as well from the last upward move yesterday and currently price has tracked back to the red .236 Fib level at $6,583, but I think we could potentially drop back to the .5 level in green at $6,472. That might just be a wick downward from the 55 EMA which could be a good springboard higher, but if this continues sideways into tomorrow that support may find itself converging with the purple 100 moving average as well.\n\nThe RSI has reset nicely to neutral levels and at 49.2 and any move downward will help it enter overbought territory quickly which the bulls should gobble-up in this up trend. If they don’t that should be a warning sign.\n\nThe histogram on the MACD is slowly starting to trend upward from below the 0 bound territory, which is a good sign for the bulls, however the blue trigger line has not started curling upwards yet, so price may continue sideways for a bit longer.\n\nI have also added the KST indicator which means Know Sure Thing and is a momentum oscillator that shows compiles 4 different rates of change on differing weighted time frames that can basically be used like the RSI and MACD to find divergence in price as well as buy sell signals. \n\nIt’s similar to the MACD in the function of reading it, but the timing is a little different. I thought I would just try it out for today. Anyway you can see the bearish divergence on the MACD and KST, which I have highlighted with the pink line. The RSI indicator is showing a little bullish continuation momentum though, so don’t be surprised if there is a fake-out up to around $6,775 and then down out of this wedge.\n\n\n\nOn the daily analog Bitcoin Bitfinex chart, there is not a whole lot to update from yesterday, but I wanted to provide the idea of a big inverse head and shoulder pattern here.\n\nYou can see the left shoulder being the downward move from June 13th and the head being the low from June 24th. That would make the neck line slightly downward sloping and currently around where we are right now at $6,650.\n\nIf price does begin to roll over the next few days, this could be a potential scenario that could play out, where price heads back down to $6,100 as a right shoulder, everyone starts freaking out about $4K levels again and then price reverses on huge volume confirming the bottom and subsequent uptrend leg.\n\nIn an ideal world this would also confirm bullish divergence for a third time on the pink RSI trend line I have drawn at around 34.91 and then spring off that level, possibly up to that green target around $7,000 by July 13th. Obviously that $6,100 level has been providing strong support for a few months now and I definitely think it could hold up again if tested.\n\nThe MACD and KST are also quite dead right now sitting below the zero bound, but are beginning to trend upward. The ship may begin to turn bullishly, but ships are also slow to respond in changes of direction. The opposite of the euphoria many were experiencing back in December and January. Have a good holiday if your celebrating.\n\n-More on Vanddar.com\n\n",
"json_metadata": "{\"tags\":[\"bitcoin\",\"btc\",\"crypto\"],\"image\":[\"https://cdn.steemitimages.com/DQmT3MgtnShwk8PAz1Kn1zRc7CNcxy2QqbpusVeQWaTKw3Y/image.png\",\"https://cdn.steemitimages.com/DQmUWWse5dchePeWgi7DgtjfdRKfAgpJQuygoTsDZ9Zs7gW/image.png\"],\"app\":\"steemit/0.1\",\"format\":\"markdown\"}",
"parent_author": "",
"parent_permlink": "bitcoin",
"permlink": "bitcoin-potential-inverse-head-and-shoulder-bottom-on-daily",
"title": "Bitcoin Potential Inverse Head and Shoulder Bottom on Daily"
}
],
"op_in_trx": 0,
"timestamp": "2018-07-03T20:00:36",
"trx_id": "86e97c3935e3427697d6ddb1382bd49a41ad91df",
"trx_in_block": 29,
"virtual_op": 0
}fastresteemupvoted (1.00%) @vanddar4 / bitcoin-begins-relief-rally2018/07/02 22:25:45
fastresteemupvoted (1.00%) @vanddar4 / bitcoin-begins-relief-rally
2018/07/02 22:25:45
| author | vanddar4 |
| permlink | bitcoin-begins-relief-rally |
| voter | fastresteem |
| weight | 100 (1.00%) |
| Transaction Info | Block #23844725/Trx 58f81458833ad08aaacbd1c2a0dcba69b54ef846 |
View Raw JSON Data
{
  "block": 23844725,
  "op": [
    "vote",
    {
      "author": "vanddar4",
      "permlink": "bitcoin-begins-relief-rally",
      "voter": "fastresteem",
      "weight": 100
    }
  ],
  "op_in_trx": 0,
  "timestamp": "2018-07-02T22:25:45",
  "trx_id": "58f81458833ad08aaacbd1c2a0dcba69b54ef846",
  "trx_in_block": 17,
  "virtual_op": 0
}vanddar4published a new post: bitcoin-begins-relief-rally2018/07/02 22:25:33
vanddar4published a new post: bitcoin-begins-relief-rally
2018/07/02 22:25:33
| author | vanddar4 |
| body | On the hourly analog Bitcoin Bitfinex chart, you can see the down trending modified Schiff pitchfork channel that we have been tracking for a few weeks now and as discussed when this pitchfork was broken we could see a big jump in price. Sure enough, price was looking down into the abyss on Friday afternoon, and could not make a new low from $5,755 from two Sunday’s ago. You can see that long-term support at the lime green line stretching downward across the snapshot and there are 3 big candle wicks poking down through there, but the bulls were lined up at the trough. Shortly thereafter price exploded higher clearing out a full standard deviation on the pitchfork which is purple and red downward channels. Once price soared out of the pitchfork, you knew there would a retest, which happened only and hour later and then the bull rally was on as price moved back up to highs of $6,545. The weekend consisted of a nice consolidation period between those pink lines which represents a bullish flag and then after the 55 EMA line in orange rose up to where the candles could tempt the bears downward twice, price moved higher today to a high of 6,681. I think that price is due to get worked off a little bit and some profit taking to commence over the next few hours here, but the trend is now in the bulls favor on the these smaller time frames. You can see how all the moving averages lines on this hourly chart, are stacked in terms a bullish trend where the lower moving averages (50, 55) are stacked on top of the higher ones (100, 200). Overnight, I could see price heading back down to touch the red line at the .236 Fibonacci level at $6,467, but I think the bulls are going to be eating up at dips that take place especially if they are around the blue 50 MA and orange 55 EMA. The RSI is naturally overbought here, but it still made a higher high from the price pop on Friday, signaling a continuation of the uptrend. Once price moves back down a little bit to a more neutral RSI level I think there got be another pop in price to the $6,760 level. The MACD is also flattening bearishly and the histogram is trending downward. 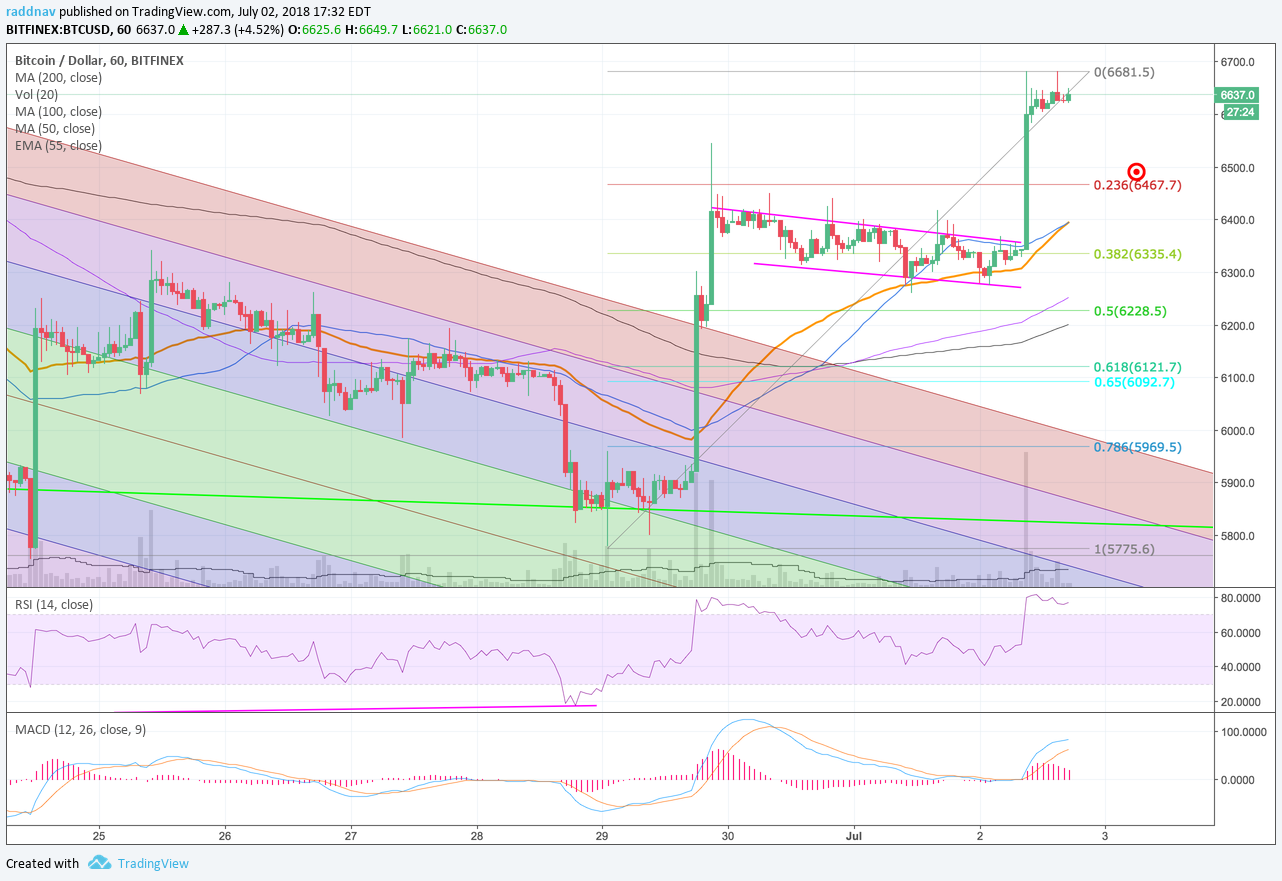 On the daily analog Bitcoin Bitfinex chart, things are looking quite bullish as you can for price is moving away from the down trending pitchfork. I think the target over the next few days here might be that $7,068 level at that turquoise long term .65 Fibonacci line, that was good support in late May and may prove to be decent resistance this time around. On this time frame Bitcoin is still in a downtrend and needs to be treated with caution still. You can see how all of the Moving Average Lines here are stacked upside down bearishly and by the time price gets back up to that $7,000 level, we could see some strong resistance at the light blue 50 and orange 55 day moving averages respectively. If price doesn’t continue to get bullish volume over the next few days, then the bulls are in big trouble as I could see this being some sort of bull trap that would then roll price slowly back over and plummet back down into the pitchfork into new lows for 2018. That appears unlikely at this point, but we need to be careful to watch what the market gives us. The RSI is moving up quite quickly already past the 50 level at 50.38. I have also drawn a pink line on the RSI indicator to show the strong bullish divergence with the up trending higher lows on the indicator while price was making lower lows. The MACD is also beginning to trend upwards as well and the histogram is still clearly moving in with upticks above the 0 line. If the blue trigger line breaches the 0 bound line as well that should provide additional price upward movement in maybe in another week or two. Could be a big inverse head and shoulder bottom in the mix too, but more tomorrow. I always run out of characters here. -More on vanddar.com 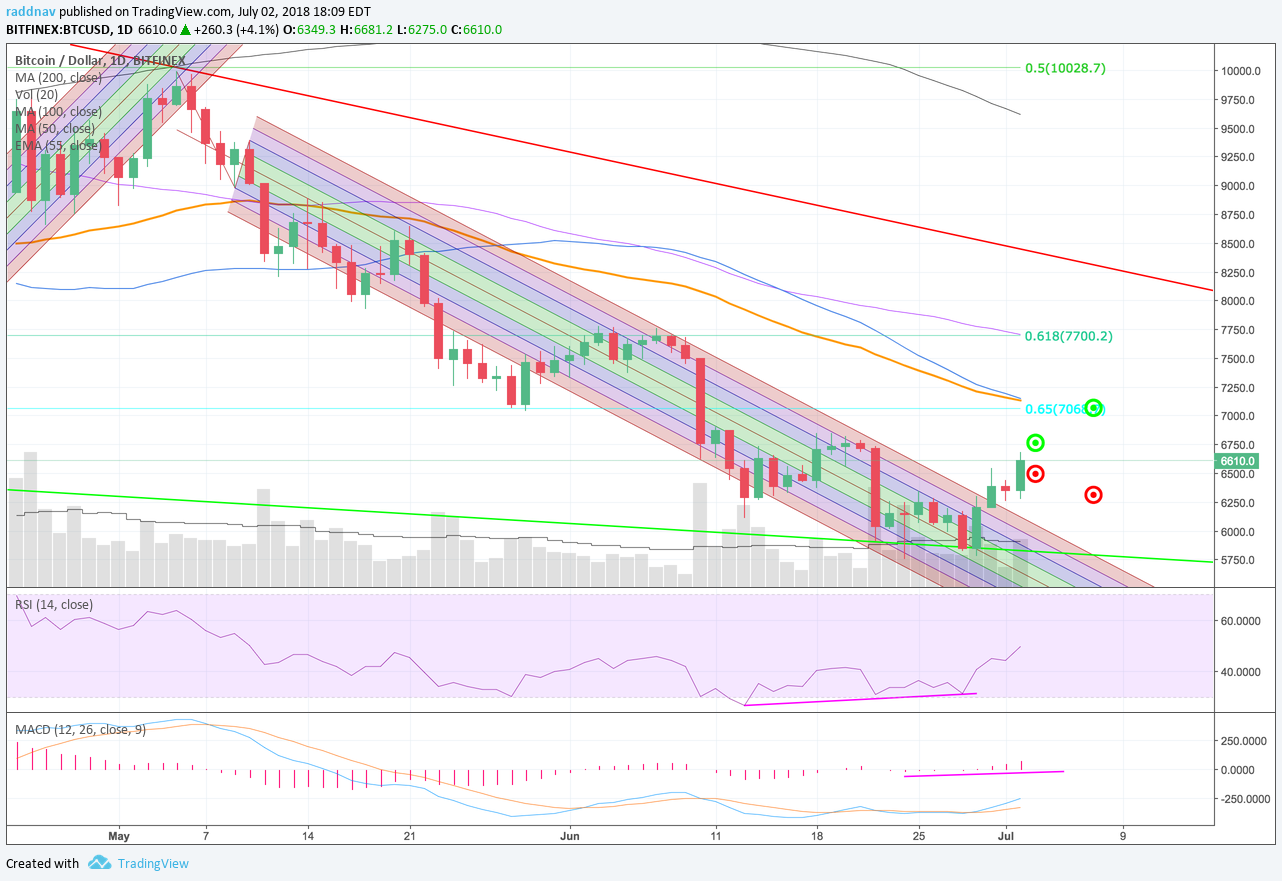 |
| json metadata | {"tags":["bitcoin","btc","crypto","cryptocurrency"],"image":["https://cdn.steemitimages.com/DQmYGe6DnetTVL6Jig8DWvU2ewdzw8esMBPjsC7V4GhTJUS/image.png","https://cdn.steemitimages.com/DQmbzQwZThiHTU1zu218qXieGPYd4F9Fg3omi5Ai8xFAre4/image.png"],"app":"steemit/0.1","format":"markdown"} |
| parent author | |
| parent permlink | bitcoin |
| permlink | bitcoin-begins-relief-rally |
| title | Bitcoin Begins Relief Rally |
| Transaction Info | Block #23844721/Trx 043cc8d3532225a14ed72a3cb482f8528204b5a0 |
View Raw JSON Data
{
"block": 23844721,
"op": [
"comment",
{
"author": "vanddar4",
"body": "On the hourly analog Bitcoin Bitfinex chart, you can see the down trending modified Schiff pitchfork channel that we have been tracking for a few weeks now and as discussed when this pitchfork was broken we could see a big jump in price. \n\nSure enough, price was looking down into the abyss on Friday afternoon, and could not make a new low from $5,755 from two Sunday’s ago. You can see that long-term support at the lime green line stretching downward across the snapshot and there are 3 big candle wicks poking down through there, but the bulls were lined up at the trough. \n\nShortly thereafter price exploded higher clearing out a full standard deviation on the pitchfork which is purple and red downward channels. Once price soared out of the pitchfork, you knew there would a retest, which happened only and hour later and then the bull rally was on as price moved back up to highs of $6,545. \n\nThe weekend consisted of a nice consolidation period between those pink lines which represents a bullish flag and then after the 55 EMA line in orange rose up to where the candles could tempt the bears downward twice, price moved higher today to a high of 6,681.\n\nI think that price is due to get worked off a little bit and some profit taking to commence over the next few hours here, but the trend is now in the bulls favor on the these smaller time frames. You can see how all the moving averages lines on this hourly chart, are stacked in terms a bullish trend where the lower moving averages (50, 55) are stacked on top of the higher ones (100, 200). \n\nOvernight, I could see price heading back down to touch the red line at the .236 Fibonacci level at $6,467, but I think the bulls are going to be eating up at dips that take place especially if they are around the blue 50 MA and orange 55 EMA.\n\nThe RSI is naturally overbought here, but it still made a higher high from the price pop on Friday, signaling a continuation of the uptrend. Once price moves back down a little bit to a more neutral RSI level I think there got be another pop in price to the $6,760 level. The MACD is also flattening bearishly and the histogram is trending downward.\n\n\n\nOn the daily analog Bitcoin Bitfinex chart, things are looking quite bullish as you can for price is moving away from the down trending pitchfork. I think the target over the next few days here might be that $7,068 level at that turquoise long term .65 Fibonacci line, that was good support in late May and may prove to be decent resistance this time around.\n\nOn this time frame Bitcoin is still in a downtrend and needs to be treated with caution still. You can see how all of the Moving Average Lines here are stacked upside down bearishly and by the time price gets back up to that $7,000 level, we could see some strong resistance at the light blue 50 and orange 55 day moving averages respectively. \n\nIf price doesn’t continue to get bullish volume over the next few days, then the bulls are in big trouble as I could see this being some sort of bull trap that would then roll price slowly back over and plummet back down into the pitchfork into new lows for 2018. That appears unlikely at this point, but we need to be careful to watch what the market gives us.\n\nThe RSI is moving up quite quickly already past the 50 level at 50.38. I have also drawn a pink line on the RSI indicator to show the strong bullish divergence with the up trending higher lows on the indicator while price was making lower lows.\n\nThe MACD is also beginning to trend upwards as well and the histogram is still clearly moving in with upticks above the 0 line. If the blue trigger line breaches the 0 bound line as well that should provide additional price upward movement in maybe in another week or two.\n\nCould be a big inverse head and shoulder bottom in the mix too, but more tomorrow. I always run out of characters here.\n\n-More on vanddar.com\n\n",
"json_metadata": "{\"tags\":[\"bitcoin\",\"btc\",\"crypto\",\"cryptocurrency\"],\"image\":[\"https://cdn.steemitimages.com/DQmYGe6DnetTVL6Jig8DWvU2ewdzw8esMBPjsC7V4GhTJUS/image.png\",\"https://cdn.steemitimages.com/DQmbzQwZThiHTU1zu218qXieGPYd4F9Fg3omi5Ai8xFAre4/image.png\"],\"app\":\"steemit/0.1\",\"format\":\"markdown\"}",
"parent_author": "",
"parent_permlink": "bitcoin",
"permlink": "bitcoin-begins-relief-rally",
"title": "Bitcoin Begins Relief Rally"
}
],
"op_in_trx": 0,
"timestamp": "2018-07-02T22:25:33",
"trx_id": "043cc8d3532225a14ed72a3cb482f8528204b5a0",
"trx_in_block": 18,
"virtual_op": 0
}beautifulklarereplied to @vanddar4 / 20180629t212226521z2018/06/29 21:22:27
beautifulklarereplied to @vanddar4 / 20180629t212226521z
2018/06/29 21:22:27
| author | beautifulklare |
| body | <p><blockquote> I have also drawn a pink up trending line on the RSI that could be decent support around 40</blockquote> </p></p>Dear haters, I’m flattered that I’m a trending topic in your life.</p></p> |
| json metadata | {"tags":["thanks"],"app":"ganeshaway"} |
| parent author | vanddar4 |
| parent permlink | bitcoin-awaiting-bullish-volume-from-dips |
| permlink | 20180629t212226521z |
| title | |
| Transaction Info | Block #23757072/Trx 03d5be94b418b42367d1dbbd6e76c499b2e19318 |
View Raw JSON Data
{
  "block": 23757072,
  "op": [
    "comment",
    {
      "author": "beautifulklare",
      "body": "<p><blockquote> I have also drawn a pink up trending line on the RSI that could be decent support around 40</blockquote> </p></p>Dear haters, I’m flattered that I’m a trending topic in your life.</p></p>",
      "json_metadata": "{\"tags\":[\"thanks\"],\"app\":\"ganeshaway\"}",
      "parent_author": "vanddar4",
      "parent_permlink": "bitcoin-awaiting-bullish-volume-from-dips",
      "permlink": "20180629t212226521z",
      "title": ""
    }
  ],
  "op_in_trx": 0,
  "timestamp": "2018-06-29T21:22:27",
  "trx_id": "03d5be94b418b42367d1dbbd6e76c499b2e19318",
  "trx_in_block": 32,
  "virtual_op": 0
}alquimista1501upvoted (100.00%) @vanddar4 / bitcoin-awaiting-bullish-volume-from-dips2018/06/26 23:43:57
alquimista1501upvoted (100.00%) @vanddar4 / bitcoin-awaiting-bullish-volume-from-dips
2018/06/26 23:43:57
| author | vanddar4 |
| permlink | bitcoin-awaiting-bullish-volume-from-dips |
| voter | alquimista1501 |
| weight | 10000 (100.00%) |
| Transaction Info | Block #23673551/Trx a3bd2751044c4314eb325eb078fc66a88402ab43 |
View Raw JSON Data
{
  "block": 23673551,
  "op": [
    "vote",
    {
      "author": "vanddar4",
      "permlink": "bitcoin-awaiting-bullish-volume-from-dips",
      "voter": "alquimista1501",
      "weight": 10000
    }
  ],
  "op_in_trx": 0,
  "timestamp": "2018-06-26T23:43:57",
  "trx_id": "a3bd2751044c4314eb325eb078fc66a88402ab43",
  "trx_in_block": 32,
  "virtual_op": 0
}vanddar4published a new post: bitcoin-awaiting-bullish-volume-from-dips2018/06/26 23:38:54
vanddar4published a new post: bitcoin-awaiting-bullish-volume-from-dips
2018/06/26 23:38:54
| author | vanddar4 |
| body | The crypto market drifts lower today, after a completed bullish inverse head and shoulder reversal yesterday, but a lack of volume to confirm. Are the bears satiated yet or will the bulls take advantage of their opportunity? On hourly analog Bitcoin Bitfinex chart, there really hasn’t been much of a move since yesterday and price has just been gliding slowly down along the purple channel in the long-term down-trending pitchfork. There have been several wicks pushing price down into the blue 1 standard deviation channel of the pitchfork, but the bulls remain hopeful for a push upward. Earlier today around 9am EST, price broke down through the 50 hour moving average and the bulls have not been able to get price back above there where it now resides at $6,200. The candle from 5pm an hour ago did break to the upside, however it appears to be a fake-out where the bears are desperately attempting to push price lower. As of now they have only been successful pushing price to the bottom of the purple channel. I have drawn a bullish flag formation between the lime green lines, which could indicate a pop higher, but even that looks quite weak. You might have to be crazy trying to trade this, because despite the bullish formations, volume is weakening again and the only thing that seem to generate any buying momentum are new lows. The RSI is fairly neutral at 43.39 and is heading back to oversold levels, making a pop in price reasonable from these levels. I have also drawn a pink up trending line on the RSI that could be decent support around 40. The MACD is also down into below 0 territory again and the break of that level didn’t do a whole lot for the bears either. The trigger line acts like it wants to pull bullishly upwards, but just as easily continue lower. 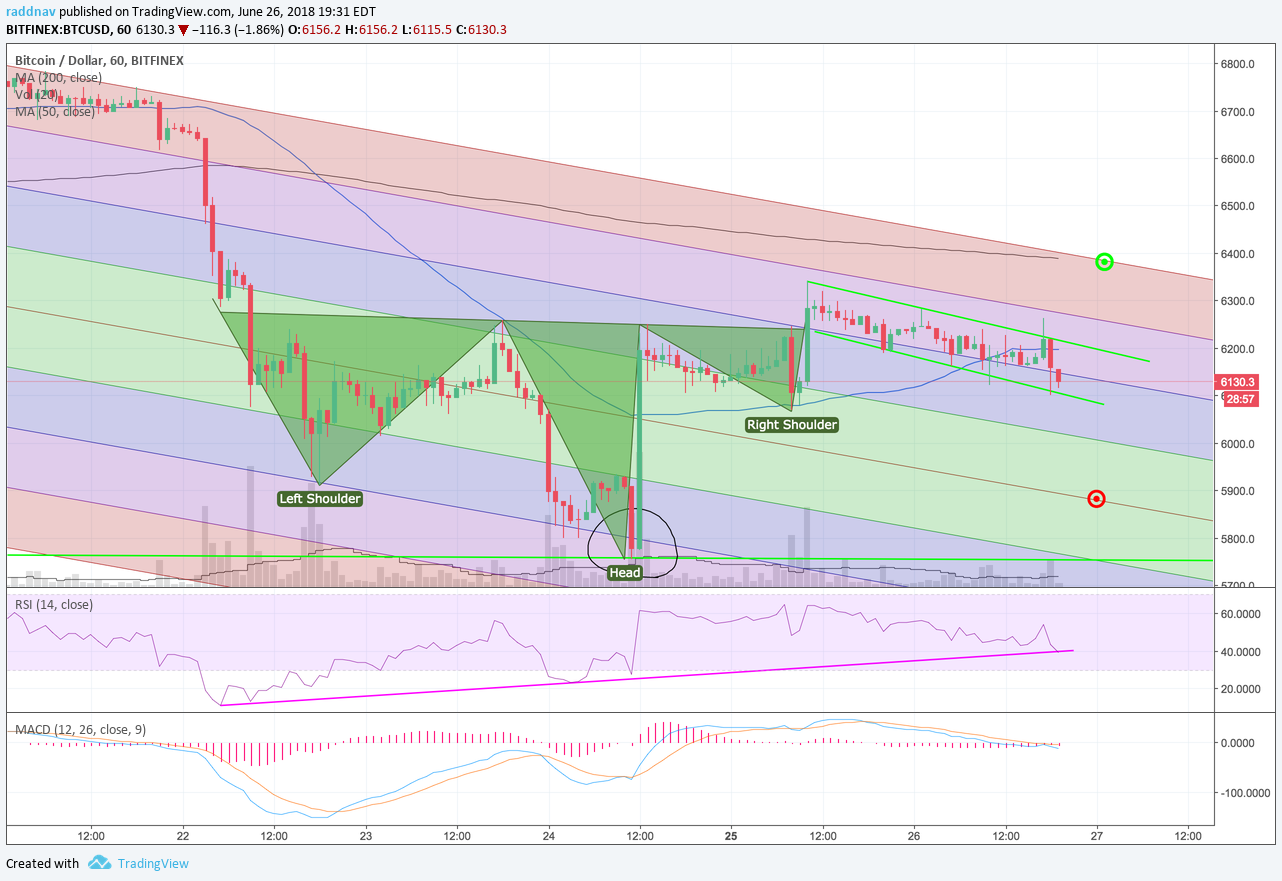 A quick look at the daily analog Bitcoin Bitfinex chart, because not a whole lot has changed since yesterday. With the hourly chart appearing to want to break lower, a decent buy target could be around that median line on the down-trending pitchfork at about $5,750. There is also convergence with that price level on the long-term lime green down-trending support line. RSI and MACD are bot are in a good position to pop higher, but as usual there needs to be an increase in volume which we aren’t seeing. The $250M in Tether that were created yesterday and Charlie Lee warned about on Twitter could be an indication that buyers are coming. If price does continue to break to the downside I would not be surprised to see a huge jump in price out of nowhere. That is where the biggest buy moves are happening in this down-trending market and it’s usually off of some panic selling. This slow price roll over pattern is beginning to get a bit redundant for the bears and shorts and I have to wander if someone is going to rip there faces off to the upside if it happens again. Time will tell. I have a raging headache today, so I will leave it there for now. -More on Vanddar.com 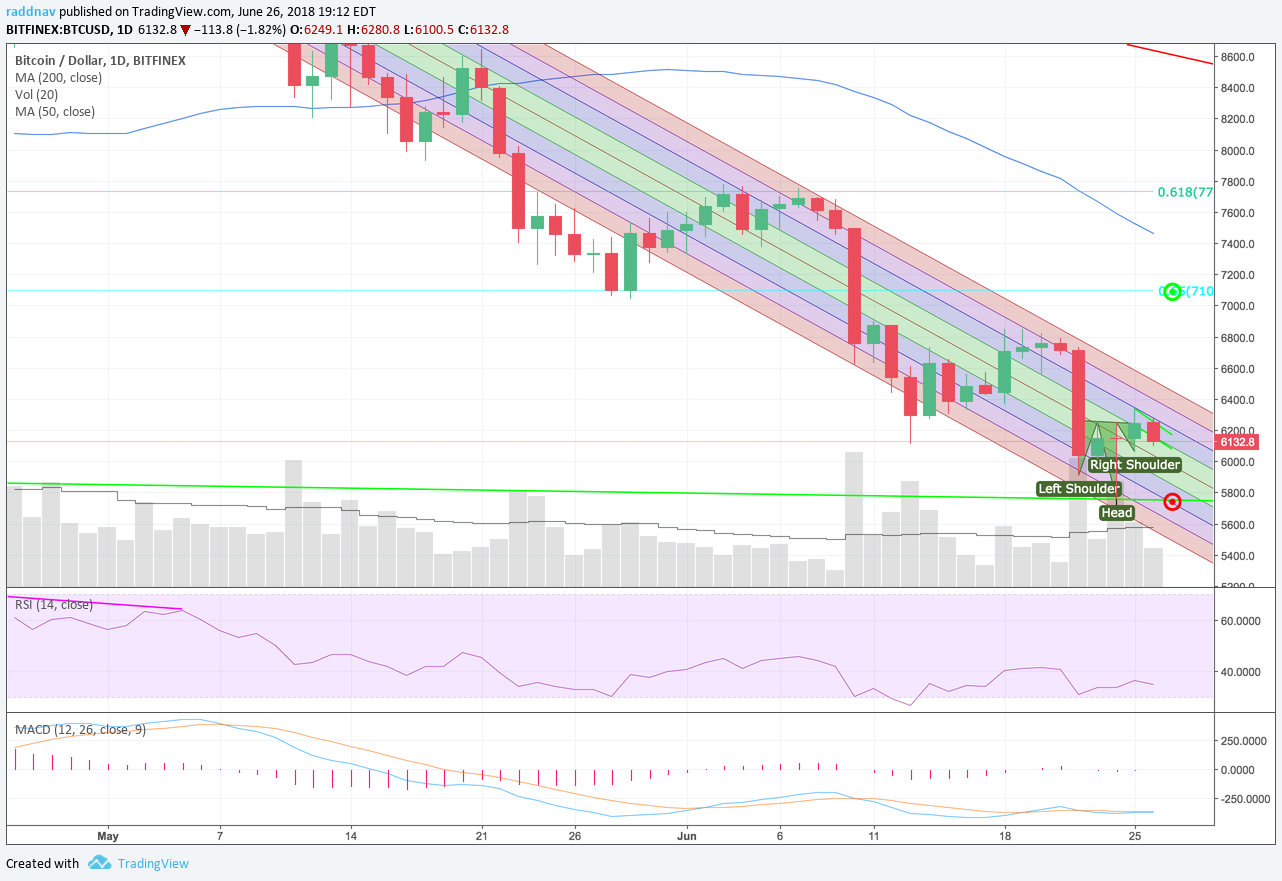 |
| json metadata | {"tags":["btc","bitcoin","crypto"],"image":["https://cdn.steemitimages.com/DQmUxqi4Vkdvwh6TmVsMPbcKPDwWcM8icUZV1YTFqZj3q9r/image.png","https://cdn.steemitimages.com/DQmUUsunBTLy3Kdi9f749BJmsfajSnHb1v8NZgHg2vqdxrE/image.png"],"app":"steemit/0.1","format":"markdown"} |
| parent author | |
| parent permlink | btc |
| permlink | bitcoin-awaiting-bullish-volume-from-dips |
| title | Bitcoin Awaiting Bullish Volume From Dips |
| Transaction Info | Block #23673450/Trx acc0184d3281c54e717567f10c8dea77d5784e03 |
View Raw JSON Data
{
"block": 23673450,
"op": [
"comment",
{
"author": "vanddar4",
"body": "The crypto market drifts lower today, after a completed bullish inverse head and shoulder reversal yesterday, but a lack of volume to confirm. Are the bears satiated yet or will the bulls take advantage of their opportunity?\n\nOn hourly analog Bitcoin Bitfinex chart, there really hasn’t been much of a move since yesterday and price has just been gliding slowly down along the purple channel in the long-term down-trending pitchfork.\n\nThere have been several wicks pushing price down into the blue 1 standard deviation channel of the pitchfork, but the bulls remain hopeful for a push upward. \n\nEarlier today around 9am EST, price broke down through the 50 hour moving average and the bulls have not been able to get price back above there where it now resides at $6,200. \n\nThe candle from 5pm an hour ago did break to the upside, however it appears to be a fake-out where the bears are desperately attempting to push price lower. As of now they have only been successful pushing price to the bottom of the purple channel.\n\nI have drawn a bullish flag formation between the lime green lines, which could indicate a pop higher, but even that looks quite weak. You might have to be crazy trying to trade this, because despite the bullish formations, volume is weakening again and the only thing that seem to generate any buying momentum are new lows. \n\nThe RSI is fairly neutral at 43.39 and is heading back to oversold levels, making a pop in price reasonable from these levels. I have also drawn a pink up trending line on the RSI that could be decent support around 40.\n\nThe MACD is also down into below 0 territory again and the break of that level didn’t do a whole lot for the bears either. The trigger line acts like it wants to pull bullishly upwards, but just as easily continue lower.\n\n\n\nA quick look at the daily analog Bitcoin Bitfinex chart, because not a whole lot has changed since yesterday. With the hourly chart appearing to want to break lower, a decent buy target could be around that median line on the down-trending pitchfork at about $5,750.\n\nThere is also convergence with that price level on the long-term lime green down-trending support line. RSI and MACD are bot are in a good position to pop higher, but as usual there needs to be an increase in volume which we aren’t seeing. \n\nThe $250M in Tether that were created yesterday and Charlie Lee warned about on Twitter could be an indication that buyers are coming. If price does continue to break to the downside I would not be surprised to see a huge jump in price out of nowhere. That is where the biggest buy moves are happening in this down-trending market and it’s usually off of some panic selling.\n\nThis slow price roll over pattern is beginning to get a bit redundant for the bears and shorts and I have to wander if someone is going to rip there faces off to the upside if it happens again. Time will tell.\n\nI have a raging headache today, so I will leave it there for now. \n\n-More on Vanddar.com\n\n",
"json_metadata": "{\"tags\":[\"btc\",\"bitcoin\",\"crypto\"],\"image\":[\"https://cdn.steemitimages.com/DQmUxqi4Vkdvwh6TmVsMPbcKPDwWcM8icUZV1YTFqZj3q9r/image.png\",\"https://cdn.steemitimages.com/DQmUUsunBTLy3Kdi9f749BJmsfajSnHb1v8NZgHg2vqdxrE/image.png\"],\"app\":\"steemit/0.1\",\"format\":\"markdown\"}",
"parent_author": "",
"parent_permlink": "btc",
"permlink": "bitcoin-awaiting-bullish-volume-from-dips",
"title": "Bitcoin Awaiting Bullish Volume From Dips"
}
],
"op_in_trx": 0,
"timestamp": "2018-06-26T23:38:54",
"trx_id": "acc0184d3281c54e717567f10c8dea77d5784e03",
"trx_in_block": 41,
"virtual_op": 0
}davidfnckupvoted (30.00%) @vanddar4 / bitcoin-reverse-head-and-shoulders-completed-on-hourly2018/06/25 23:01:51
davidfnckupvoted (30.00%) @vanddar4 / bitcoin-reverse-head-and-shoulders-completed-on-hourly
2018/06/25 23:01:51
| author | vanddar4 |
| permlink | bitcoin-reverse-head-and-shoulders-completed-on-hourly |
| voter | davidfnck |
| weight | 3000 (30.00%) |
| Transaction Info | Block #23643910/Trx 31e12c7dc943b4330673c394dd8d041c274c465b |
View Raw JSON Data
{
  "block": 23643910,
  "op": [
    "vote",
    {
      "author": "vanddar4",
      "permlink": "bitcoin-reverse-head-and-shoulders-completed-on-hourly",
      "voter": "davidfnck",
      "weight": 3000
    }
  ],
  "op_in_trx": 0,
  "timestamp": "2018-06-25T23:01:51",
  "trx_id": "31e12c7dc943b4330673c394dd8d041c274c465b",
  "trx_in_block": 3,
  "virtual_op": 0
}2018/06/25 22:37:45
2018/06/25 22:37:45
| author | a-0-1 |
| body | # Upvote/Resteem: https://steemit.com/news/@bible.com/6h36cq |
| json metadata | {"tags":["btc"],"links":["https://steemit.com/news/@bible.com/6h36cq"],"app":"steemit/0.1"} |
| parent author | vanddar4 |
| parent permlink | bitcoin-reverse-head-and-shoulders-completed-on-hourly |
| permlink | re-vanddar4-bitcoin-reverse-head-and-shoulders-completed-on-hourly-20180625t223746688z |
| title | |
| Transaction Info | Block #23643428/Trx 6cb7f75e4a9be6fe12184d0675717a5fbe8fc81e |
View Raw JSON Data
{
  "block": 23643428,
  "op": [
    "comment",
    {
      "author": "a-0-1",
      "body": "# Upvote/Resteem: https://steemit.com/news/@bible.com/6h36cq",
      "json_metadata": "{\"tags\":[\"btc\"],\"links\":[\"https://steemit.com/news/@bible.com/6h36cq\"],\"app\":\"steemit/0.1\"}",
      "parent_author": "vanddar4",
      "parent_permlink": "bitcoin-reverse-head-and-shoulders-completed-on-hourly",
      "permlink": "re-vanddar4-bitcoin-reverse-head-and-shoulders-completed-on-hourly-20180625t223746688z",
      "title": ""
    }
  ],
  "op_in_trx": 0,
  "timestamp": "2018-06-25T22:37:45",
  "trx_id": "6cb7f75e4a9be6fe12184d0675717a5fbe8fc81e",
  "trx_in_block": 25,
  "virtual_op": 0
}vanddar4published a new post: bitcoin-reverse-head-and-shoulders-completed-on-hourly2018/06/25 22:37:12
vanddar4published a new post: bitcoin-reverse-head-and-shoulders-completed-on-hourly
2018/06/25 22:37:12
| author | vanddar4 |
| body | The crypto markets took another dip down below critical support over the weekend before an encouraging rally Sunday that leaves some rather interesting scenarios today. Come in and let’s take a look. On the hourly analog Bitcoin Bitfinex chart, you can see how critical that black horizontal line is at $6,000 for long-term and current support, but it was dire straits for the bulls last Friday night heading with price heading down to $5,910. The bulls recovered into Saturday briefly before touching the light blue 50 hour moving average line and quickly heading southward, getting crushed through that $6,000 level on huge volume all the way down to a low of $5,755 before a massive buy wall was hit and rallied price decisively back above the 50 hour MA to $6,230. Since then price has trended sideways for the most part with another quick dip down down to the 50 hour MA this morning and rallying on relatively big volume an hour later. In all the chaos, I have identified a reverse head and shoulders bottom that has already completed on the candle from 10am EST this morning breaking the neckline at $6,235 which is also the outside of the blue 1 standard deviation channel. Price has now come back down to retest this neckline at 3pm EST, and has bounced ever so slightly. I do not like that the volume has not been increasing since then to indicate confirmation of a bullish pop, but it could still come. What I do like overall is the volume that I have circled in black at the shoulder head and shoulder points. The RSI is getting into slightly overbought territory, but still has room where it could run higher. There is also solid bullish divergence showing up from the lows over the weekend here that I have marked with a pink up trending line on the RSI indicator. The MACD also has good bullish divergence now too, even though the trigger line is beginning to curl downward bearishly and the histogram is trending lower. It may take a few hours for price to sit around this level to reset some of these indicator before the next move. I could bullish target could be that 200 hour moving average at $6,421 in the red channel of the pitchfork and to the downside another retest of that $6,100 level at the 50 hour moving average. The goal for the bulls is to break the outside of that red channel on the pitchfork though at about $6,450 and then a relief rally will be on. 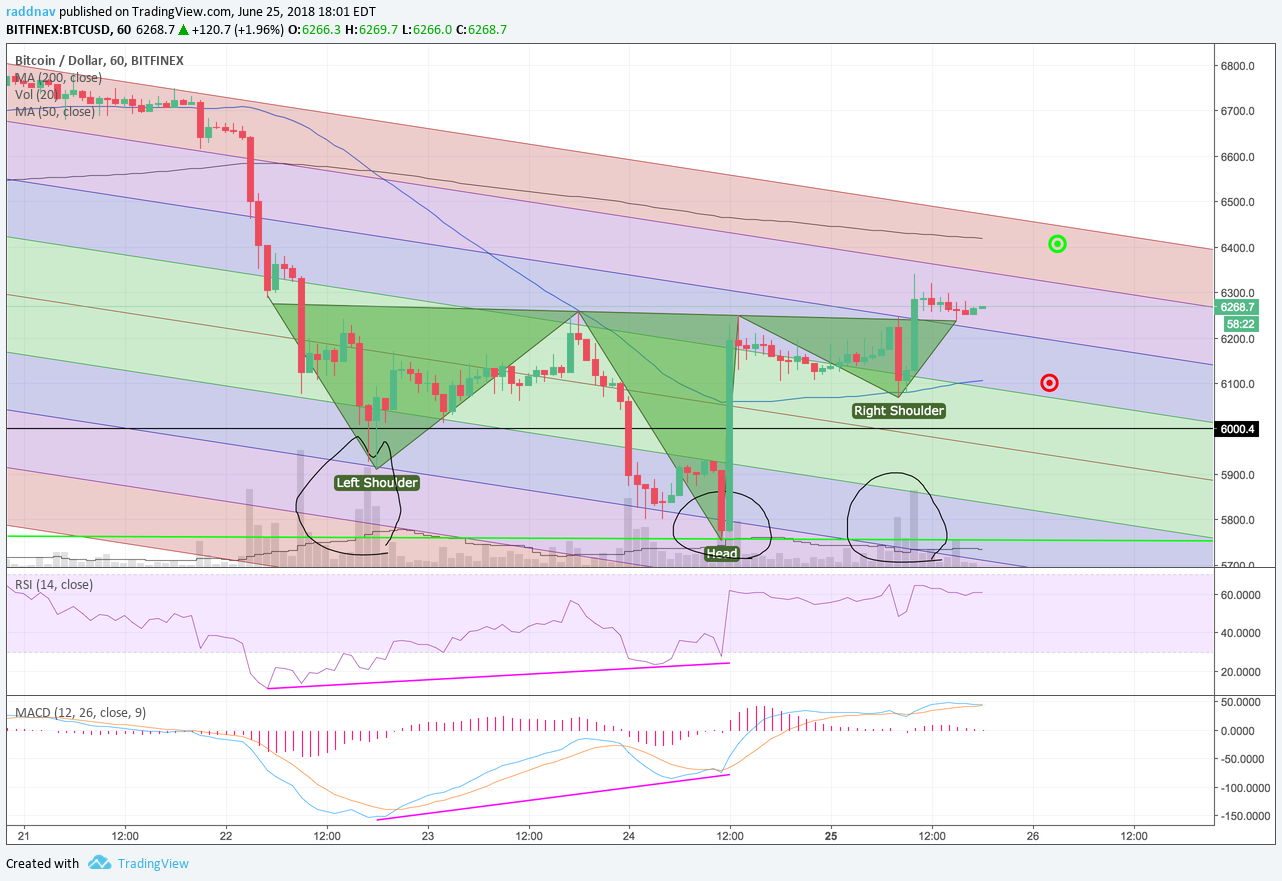 On the daily analog Bitcoin Bitfinex chart, things are looking pretty good for a bullish relief rally. After that big red candle on Friday, the candles over the weekend for the bulls have been quite resilient. If you take a look at the volume on here, there is a distinct uptrend in the volume candles and price is also visibly trending upward as well. The volume wasn't there on past “rallies” on this downtrend over the last few weeks, so this is definitely an encouraging sign, but as usual the volume needs to continue. I have added the Parabolic SAR indicator on here as well to help identity when this downtrend will switch bullish. The indicator is located on the price chart with those little dots above or below price. When the price jumps above or below those dots it is an indication of a trend change. For this chart there is a convergence with the top of the down-trending pitchfork on where the trend will change and that price is agin around $6,600. If price does manage to break above there, a rally up to $7,100 would be a nice level in the short term. On the downside, the bottom of the pitchfork at around $5,500 as a target. I think at some point in the coming days that light blue 50 day moving average will be tested around $7,400 as well. On the RSI indicator there, is a distinct bullish divergence from the price lower lows to the RSI higher lows. I have marked that with a blue up-trending line on the indicator. You can also see how back at the beginning of May the RSI picked up the bearish divergence that I have marked with the pink down-trending line. The MACD has also coiled and looks ready to pop up here as well. There could be more downside here, but overall, you don’t want to be switching bearish on day 50 of a downtrend. -More on Vanddar.com 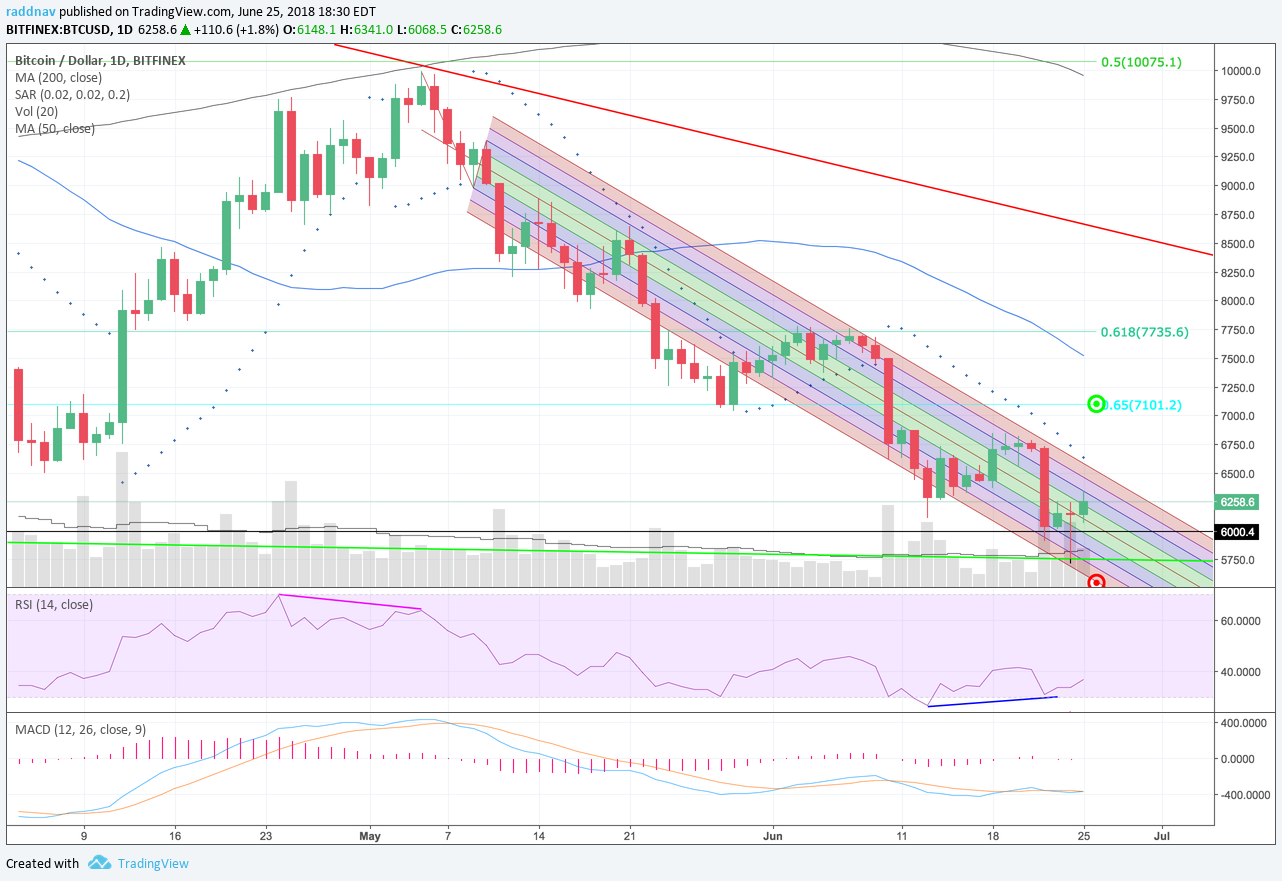 |
| json metadata | {"tags":["btc","bitcoin","cryptocurrencies","crypto"],"image":["https://cdn.steemitimages.com/DQmXUzWJopoo7GHAuLWomJX9Awr1o2UpdBF71NgfHLAdfTx/image.png","https://cdn.steemitimages.com/DQmbHWPUjKEz6TJdaeqoRYJW3kfiXp8k1YMHx7M3nes1jpL/image.png"],"app":"steemit/0.1","format":"markdown"} |
| parent author | |
| parent permlink | btc |
| permlink | bitcoin-reverse-head-and-shoulders-completed-on-hourly |
| title | Bitcoin Reverse Head and Shoulders Completed on Hourly |
| Transaction Info | Block #23643417/Trx 26f11d8181473c301be4d9c2c366338ed4db7521 |
View Raw JSON Data
{
"block": 23643417,
"op": [
"comment",
{
"author": "vanddar4",
"body": "The crypto markets took another dip down below critical support over the weekend before an encouraging rally Sunday that leaves some rather interesting scenarios today. Come in and let’s take a look.\n\nOn the hourly analog Bitcoin Bitfinex chart, you can see how critical that black horizontal line is at $6,000 for long-term and current support, but it was dire straits for the bulls last Friday night heading with price heading down to $5,910.\n\nThe bulls recovered into Saturday briefly before touching the light blue 50 hour moving average line and quickly heading southward, getting crushed through that $6,000 level on huge volume all the way down to a low of $5,755 before a massive buy wall was hit and rallied price decisively back above the 50 hour MA to $6,230.\n\nSince then price has trended sideways for the most part with another quick dip down down to the 50 hour MA this morning and rallying on relatively big volume an hour later. \n\nIn all the chaos, I have identified a reverse head and shoulders bottom that has already completed on the candle from 10am EST this morning breaking the neckline at $6,235 which is also the outside of the blue 1 standard deviation channel.\n\nPrice has now come back down to retest this neckline at 3pm EST, and has bounced ever so slightly. I do not like that the volume has not been increasing since then to indicate confirmation of a bullish pop, but it could still come. What I do like overall is the volume that I have circled in black at the shoulder head and shoulder points. \n\nThe RSI is getting into slightly overbought territory, but still has room where it could run higher. There is also solid bullish divergence showing up from the lows over the weekend here that I have marked with a pink up trending line on the RSI indicator.\n\nThe MACD also has good bullish divergence now too, even though the trigger line is beginning to curl downward bearishly and the histogram is trending lower. It may take a few hours for price to sit around this level to reset some of these indicator before the next move. \n\nI could bullish target could be that 200 hour moving average at $6,421 in the red channel of the pitchfork and to the downside another retest of that $6,100 level at the 50 hour moving average. The goal for the bulls is to break the outside of that red channel on the pitchfork though at about $6,450 and then a relief rally will be on.\n\n\n\nOn the daily analog Bitcoin Bitfinex chart, things are looking pretty good for a bullish relief rally. After that big red candle on Friday, the candles over the weekend for the bulls have been quite resilient.\n\nIf you take a look at the volume on here, there is a distinct uptrend in the volume candles and price is also visibly trending upward as well. The volume wasn't there on past “rallies” on this downtrend over the last few weeks, so this is definitely an encouraging sign, but as usual the volume needs to continue.\n\nI have added the Parabolic SAR indicator on here as well to help identity when this downtrend will switch bullish. The indicator is located on the price chart with those little dots above or below price. When the price jumps above or below those dots it is an indication of a trend change.\n\nFor this chart there is a convergence with the top of the down-trending pitchfork on where the trend will change and that price is agin around $6,600. If price does manage to break above there, a rally up to $7,100 would be a nice level in the short term. On the downside, the bottom of the pitchfork at around $5,500 as a target. I think at some point in the coming days that light blue 50 day moving average will be tested around $7,400 as well.\n\nOn the RSI indicator there, is a distinct bullish divergence from the price lower lows to the RSI higher lows. I have marked that with a blue up-trending line on the indicator. You can also see how back at the beginning of May the RSI picked up the bearish divergence that I have marked with the pink down-trending line.\n\nThe MACD has also coiled and looks ready to pop up here as well. There could be more downside here, but overall, you don’t want to be switching bearish on day 50 of a downtrend.\n\n-More on Vanddar.com\n\n",
"json_metadata": "{\"tags\":[\"btc\",\"bitcoin\",\"cryptocurrencies\",\"crypto\"],\"image\":[\"https://cdn.steemitimages.com/DQmXUzWJopoo7GHAuLWomJX9Awr1o2UpdBF71NgfHLAdfTx/image.png\",\"https://cdn.steemitimages.com/DQmbHWPUjKEz6TJdaeqoRYJW3kfiXp8k1YMHx7M3nes1jpL/image.png\"],\"app\":\"steemit/0.1\",\"format\":\"markdown\"}",
"parent_author": "",
"parent_permlink": "btc",
"permlink": "bitcoin-reverse-head-and-shoulders-completed-on-hourly",
"title": "Bitcoin Reverse Head and Shoulders Completed on Hourly"
}
],
"op_in_trx": 0,
"timestamp": "2018-06-25T22:37:12",
"trx_id": "26f11d8181473c301be4d9c2c366338ed4db7521",
"trx_in_block": 72,
"virtual_op": 0
}2018/06/22 22:40:51
2018/06/22 22:40:51
| author | tomask-de |
| body | Nice read. I leave an upvote for this article *thumbsup* |
| json metadata | {} |
| parent author | vanddar4 |
| parent permlink | bitcoin-searching-for-support-depression-phase |
| permlink | re-vanddar4-bitcoin-searching-for-support-depression-phase-20180622t224053244z |
| title | fossbot voter comment |
| Transaction Info | Block #23557114/Trx 76c801c3bf4c4725415f926f709921e7066d35f1 |
View Raw JSON Data
{
  "block": 23557114,
  "op": [
    "comment",
    {
      "author": "tomask-de",
      "body": "Nice read. I leave an upvote for this article *thumbsup*",
      "json_metadata": "{}",
      "parent_author": "vanddar4",
      "parent_permlink": "bitcoin-searching-for-support-depression-phase",
      "permlink": "re-vanddar4-bitcoin-searching-for-support-depression-phase-20180622t224053244z",
      "title": "fossbot voter comment"
    }
  ],
  "op_in_trx": 0,
  "timestamp": "2018-06-22T22:40:51",
  "trx_id": "76c801c3bf4c4725415f926f709921e7066d35f1",
  "trx_in_block": 38,
  "virtual_op": 0
}tomask-deupvoted (100.00%) @vanddar4 / bitcoin-searching-for-support-depression-phase2018/06/22 22:40:45
tomask-deupvoted (100.00%) @vanddar4 / bitcoin-searching-for-support-depression-phase
2018/06/22 22:40:45
| author | vanddar4 |
| permlink | bitcoin-searching-for-support-depression-phase |
| voter | tomask-de |
| weight | 10000 (100.00%) |
| Transaction Info | Block #23557112/Trx ac671a8b37b85caf0a131d385cd88ca64741502c |
View Raw JSON Data
{
  "block": 23557112,
  "op": [
    "vote",
    {
      "author": "vanddar4",
      "permlink": "bitcoin-searching-for-support-depression-phase",
      "voter": "tomask-de",
      "weight": 10000
    }
  ],
  "op_in_trx": 0,
  "timestamp": "2018-06-22T22:40:45",
  "trx_id": "ac671a8b37b85caf0a131d385cd88ca64741502c",
  "trx_in_block": 56,
  "virtual_op": 0
}2018/06/22 22:19:21
2018/06/22 22:19:21
| author | a-0-1 |
| body | Please Upvote➜https://steemit.com/christianity/@bible.com/verse-of-the-day-revelation-21-8-niv |
| json metadata | {"tags":["btc"],"links":["https://steemit.com/christianity/@bible.com/verse-of-the-day-revelation-21-8-niv"],"app":"steemit/0.1"} |
| parent author | vanddar4 |
| parent permlink | bitcoin-searching-for-support-depression-phase |
| permlink | re-vanddar4-bitcoin-searching-for-support-depression-phase-20180622t221919423z |
| title | |
| Transaction Info | Block #23556684/Trx d0d4436b54b2ecb99f7f1b488c5a4464d912576f |
View Raw JSON Data
{
  "block": 23556684,
  "op": [
    "comment",
    {
      "author": "a-0-1",
      "body": "Please Upvote➜https://steemit.com/christianity/@bible.com/verse-of-the-day-revelation-21-8-niv",
      "json_metadata": "{\"tags\":[\"btc\"],\"links\":[\"https://steemit.com/christianity/@bible.com/verse-of-the-day-revelation-21-8-niv\"],\"app\":\"steemit/0.1\"}",
      "parent_author": "vanddar4",
      "parent_permlink": "bitcoin-searching-for-support-depression-phase",
      "permlink": "re-vanddar4-bitcoin-searching-for-support-depression-phase-20180622t221919423z",
      "title": ""
    }
  ],
  "op_in_trx": 0,
  "timestamp": "2018-06-22T22:19:21",
  "trx_id": "d0d4436b54b2ecb99f7f1b488c5a4464d912576f",
  "trx_in_block": 15,
  "virtual_op": 0
}vanddar4published a new post: bitcoin-searching-for-support-depression-phase2018/06/22 22:18:27
vanddar4published a new post: bitcoin-searching-for-support-depression-phase
2018/06/22 22:18:27
| author | vanddar4 |
| body | A slight drift from the trend line yesterday evening was easily enough to cause a torrent of selling all the way back down to the lows on June 13th. Let’s take a look at when the selling may stop. On the hourly analog Bitcoin Bitfinex chart, you don’t need to be told about the huge plunge taking place as we speak. Overnight the rising wedge between the black lines and the bearish flag between the yellow lines were quickly broken. I thought there might be more of a bounce, but the bears and shorts are crushing it. And here we go. Price just broke the low of $6,000 back in February, currently dipping below $5,970. It’s exciting seeing this action as it’s been so boring otherwise. I took at snapshot already because the screen is shifting the rest of the pricing action to account for the drop. Even the lime green down-trending line that could have been support for the previous lows from February, April and today has been broken as well. Despite price plummeting there is some bullish divergence taking place between the price and RSI, where price is making lower lows and the RSI making higher highs. Be careful not to catch the falling knife right now. The other end of the down-trending pitchfork should provide decent support for this move at around $5,600 and hopefully price could stabilize around there. The MACD did look like it wanted to curl up a few hours ago, however there was a small pink rising wedge that was broken, around the median line of the pitchfork. Price now appears to be getting a pretty decent bounce off the 1 standard deviation (sd) outer blue channel of the pitchfork and back up to that lime green down-trending support line. It’s going to be really interesting to see if that holds. 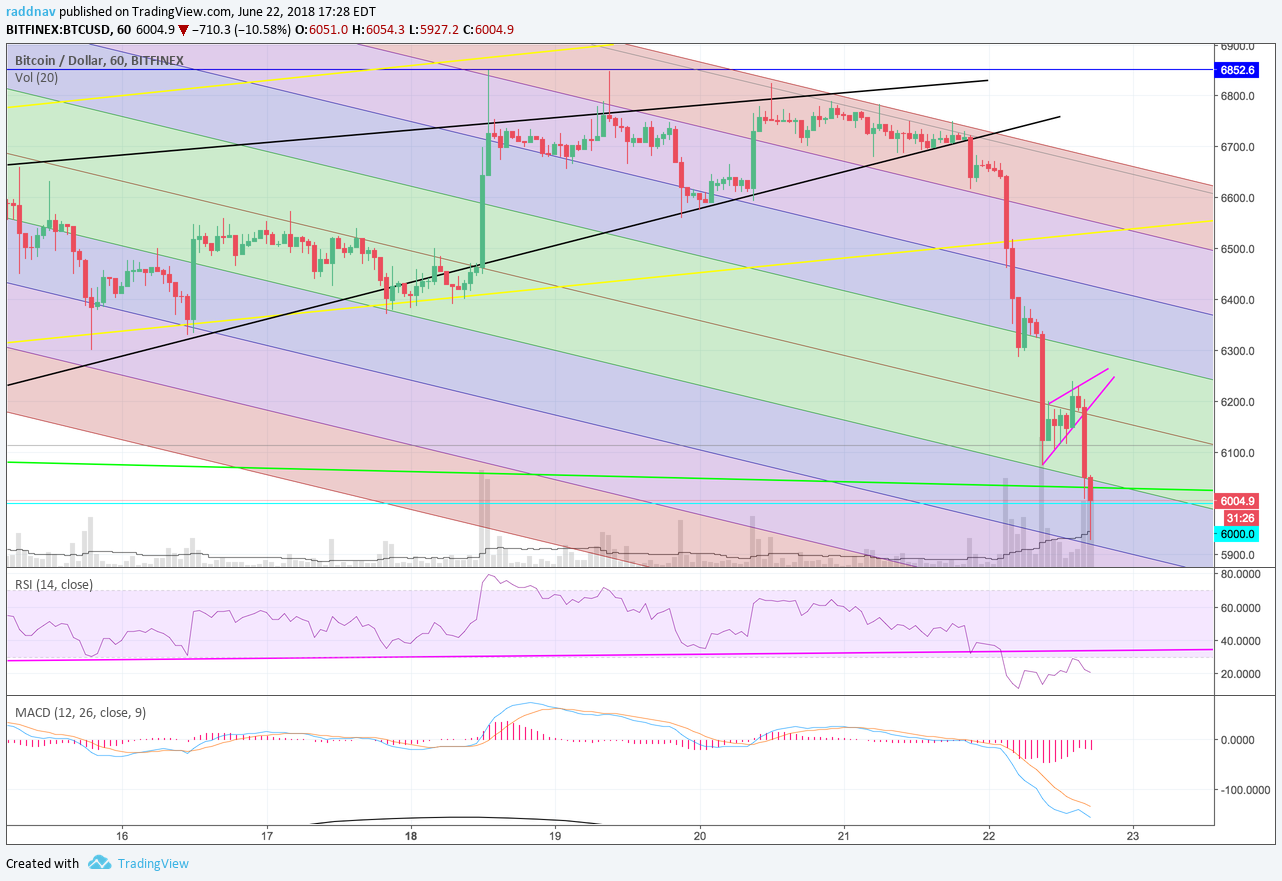 On the daily analog Bitcoin Bitfinex chart, my target from yesterday hit pretty much to a 24 hour tee at $6,000 which is cool, but depending on volume and rally from here, this could be the bounce that that we need yesterday on the RSI and MACD charts. I would say if price can hold this $6,000 level for the next few hours until this pricing candle closes, there is a good chance we could get a nice rally tomorrow. That would give a solid bullish reversal divergence that I have marked with an up-trending pink line on the RSI indicator showing a higher low and price giving the lower low. Additionally the RSI is still very close to over sold levels. The MACD blue trigger line also has not crossed back over bearishly just yet, where if price does rally tomorrow that upward trend between the MACD lines would still be intact with the blue line rising above the orange line. There is still bullish reversal divergence here too. This $6,000 has been very strong for support, but looking at the long term Fibonacci Retracement, there could be a capitulation/ depression event down to the $4,393 level at the blue .786 Fib. Even the $5,000 level would be great psychological support as well. I wouldn’t expect that to take place over the weekend, but over the next few weeks if volume does not pick up drastically. Hopefully today’s action is the start to that. 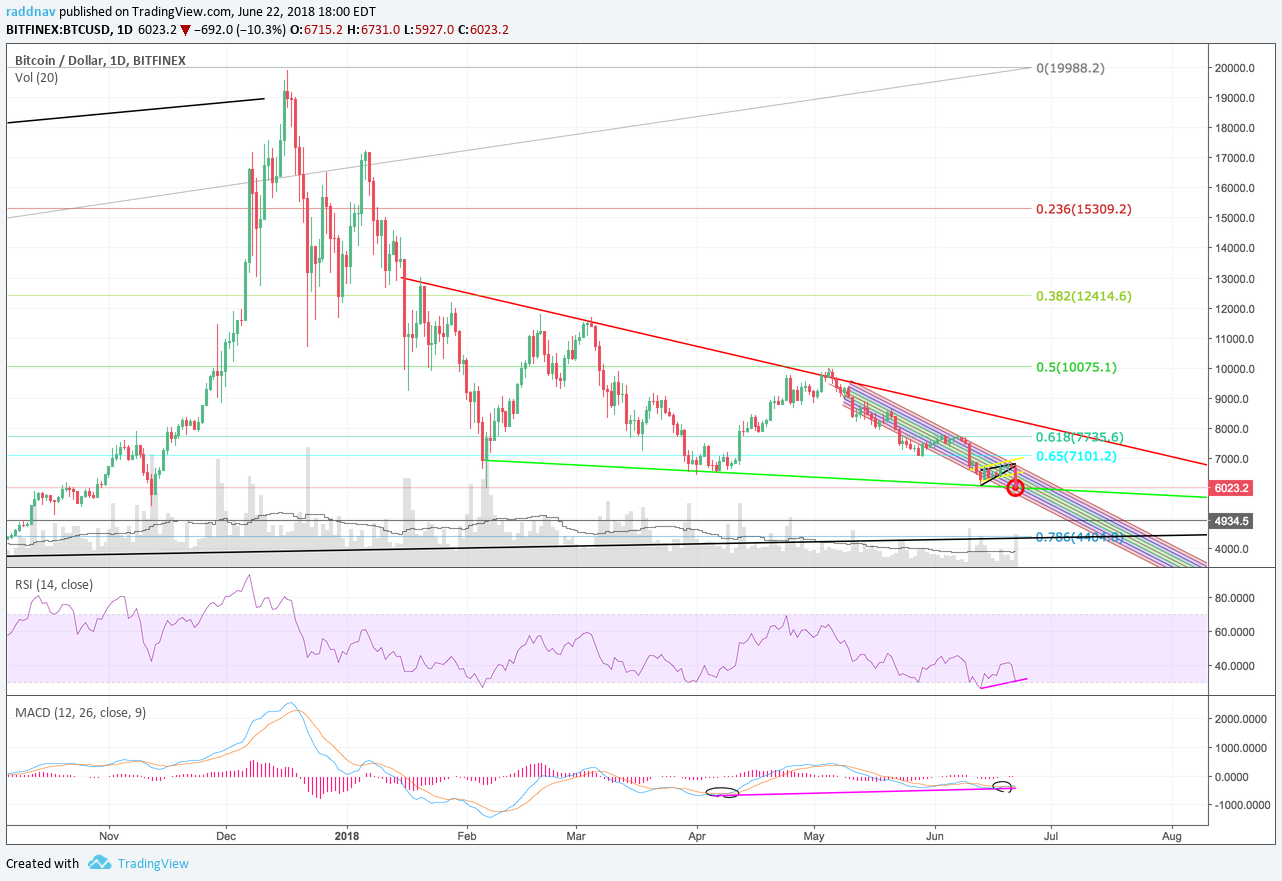 I also added one more bonus chart I made mapping the psychology of a market cycle to the Bitcoin chart. Another interesting point that we may be nearing the end of the bear. Have a good weekend! -More at Vanddar.com 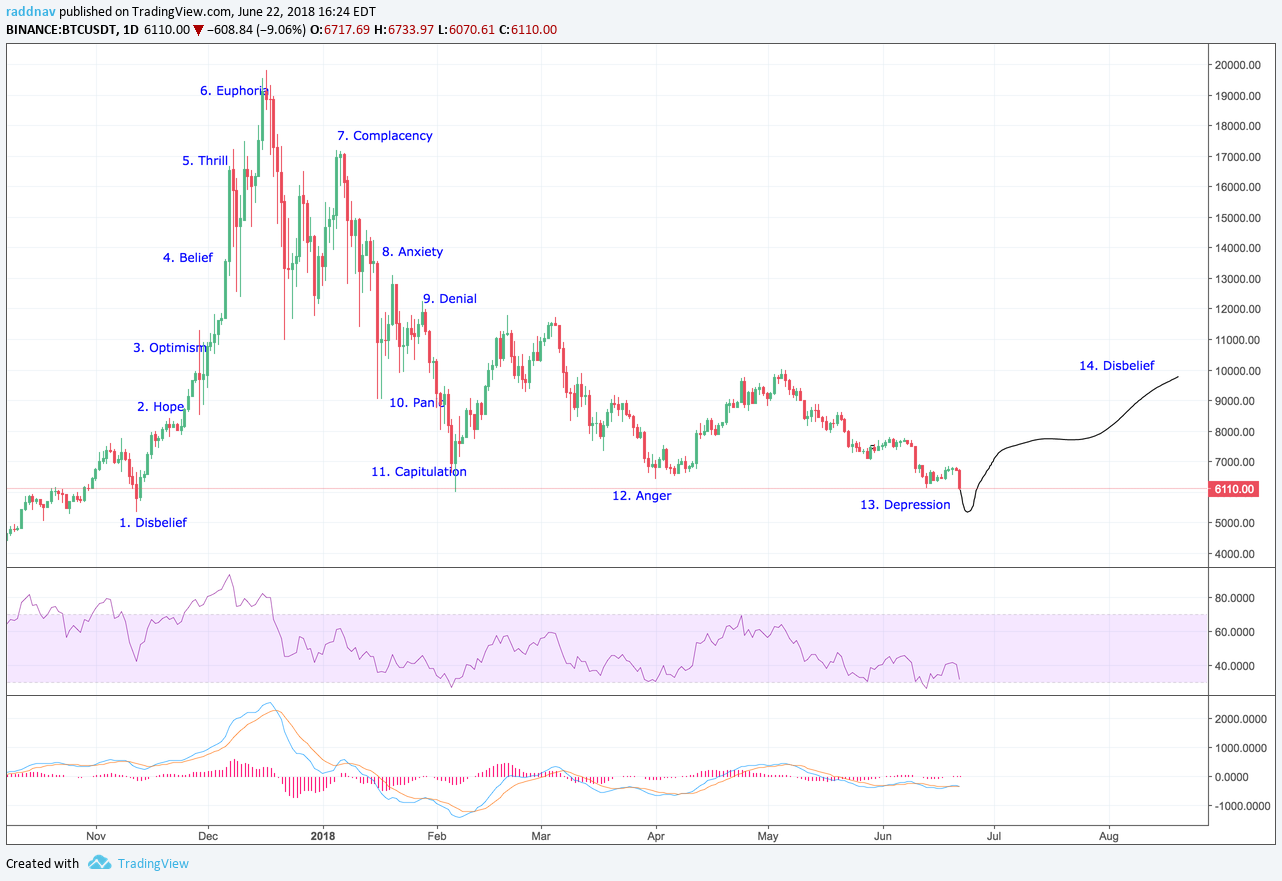 |
| json metadata | {"tags":["btc","bitcoin","crypto","cryptocurrencies"],"image":["https://cdn.steemitimages.com/DQmYwso1UAdU7wg622RqBQ4iJ1oDzXiXhdPnNdvnKh4sEJ5/image.png","https://cdn.steemitimages.com/DQmd146ocbVE9qdpUAWVQhF6GVJpeQsi2ca1ZdcMutYzmgG/image.png","https://cdn.steemitimages.com/DQmYsXUFqWWFrW3NvZLkDhC5JrceUy7jFV94WCY2VBAbnde/image.png"],"app":"steemit/0.1","format":"markdown"} |
| parent author | |
| parent permlink | btc |
| permlink | bitcoin-searching-for-support-depression-phase |
| title | Bitcoin Searching for Support: Depression Phase |
| Transaction Info | Block #23556666/Trx 98c80a0248f2331d0d619599b678485262b72a6d |
View Raw JSON Data
{
"block": 23556666,
"op": [
"comment",
{
"author": "vanddar4",
"body": "A slight drift from the trend line yesterday evening was easily enough to cause a torrent of selling all the way back down to the lows on June 13th. Let’s take a look at when the selling may stop.\n\nOn the hourly analog Bitcoin Bitfinex chart, you don’t need to be told about the huge plunge taking place as we speak. Overnight the rising wedge between the black lines and the bearish flag between the yellow lines were quickly broken. I thought there might be more of a bounce, but the bears and shorts are crushing it.\n\nAnd here we go. Price just broke the low of $6,000 back in February, currently dipping below $5,970. It’s exciting seeing this action as it’s been so boring otherwise.\n\nI took at snapshot already because the screen is shifting the rest of the pricing action to account for the drop. Even the lime green down-trending line that could have been support for the previous lows from February, April and today has been broken as well.\n\nDespite price plummeting there is some bullish divergence taking place between the price and RSI, where price is making lower lows and the RSI making higher highs. Be careful not to catch the falling knife right now. The other end of the down-trending pitchfork should provide decent support for this move at around $5,600 and hopefully price could stabilize around there. \n\nThe MACD did look like it wanted to curl up a few hours ago, however there was a small pink rising wedge that was broken, around the median line of the pitchfork. \n\nPrice now appears to be getting a pretty decent bounce off the 1 standard deviation (sd) outer blue channel of the pitchfork and back up to that lime green down-trending support line. It’s going to be really interesting to see if that holds.\n\n\n\nOn the daily analog Bitcoin Bitfinex chart, my target from yesterday hit pretty much to a 24 hour tee at $6,000 which is cool, but depending on volume and rally from here, this could be the bounce that that we need yesterday on the RSI and MACD charts.\n\nI would say if price can hold this $6,000 level for the next few hours until this pricing candle closes, there is a good chance we could get a nice rally tomorrow. That would give a solid bullish reversal divergence that I have marked with an up-trending pink line on the RSI indicator showing a higher low and price giving the lower low. Additionally the RSI is still very close to over sold levels.\n\nThe MACD blue trigger line also has not crossed back over bearishly just yet, where if price does rally tomorrow that upward trend between the MACD lines would still be intact with the blue line rising above the orange line. There is still bullish reversal divergence here too.\n\nThis $6,000 has been very strong for support, but looking at the long term Fibonacci Retracement, there could be a capitulation/ depression event down to the $4,393 level at the blue .786 Fib. Even the $5,000 level would be great psychological support as well. \n\nI wouldn’t expect that to take place over the weekend, but over the next few weeks if volume does not pick up drastically. Hopefully today’s action is the start to that. \n\n\n\nI also added one more bonus chart I made mapping the psychology of a market cycle to the Bitcoin chart. Another interesting point that we may be nearing the end of the bear. Have a good weekend!\n\n-More at Vanddar.com\n\n",
"json_metadata": "{\"tags\":[\"btc\",\"bitcoin\",\"crypto\",\"cryptocurrencies\"],\"image\":[\"https://cdn.steemitimages.com/DQmYwso1UAdU7wg622RqBQ4iJ1oDzXiXhdPnNdvnKh4sEJ5/image.png\",\"https://cdn.steemitimages.com/DQmd146ocbVE9qdpUAWVQhF6GVJpeQsi2ca1ZdcMutYzmgG/image.png\",\"https://cdn.steemitimages.com/DQmYsXUFqWWFrW3NvZLkDhC5JrceUy7jFV94WCY2VBAbnde/image.png\"],\"app\":\"steemit/0.1\",\"format\":\"markdown\"}",
"parent_author": "",
"parent_permlink": "btc",
"permlink": "bitcoin-searching-for-support-depression-phase",
"title": "Bitcoin Searching for Support: Depression Phase"
}
],
"op_in_trx": 0,
"timestamp": "2018-06-22T22:18:27",
"trx_id": "98c80a0248f2331d0d619599b678485262b72a6d",
"trx_in_block": 6,
"virtual_op": 0
}2018/06/21 23:46:24
2018/06/21 23:46:24
| author | a-0-1 |
| body | @bible.com |
| json metadata | {"tags":["btc"],"users":["bible.com"],"app":"steemit/0.1"} |
| parent author | vanddar4 |
| parent permlink | bitcoin-at-edge-of-downtrending-pitchfork-will-bulls-show-up |
| permlink | re-vanddar4-bitcoin-at-edge-of-downtrending-pitchfork-will-bulls-show-up-20180621t234623718z |
| title | |
| Transaction Info | Block #23529625/Trx c77bc6de4d53e273c3fea6ab2e45d9de888fd40f |
View Raw JSON Data
{
  "block": 23529625,
  "op": [
    "comment",
    {
      "author": "a-0-1",
      "body": "@bible.com",
      "json_metadata": "{\"tags\":[\"btc\"],\"users\":[\"bible.com\"],\"app\":\"steemit/0.1\"}",
      "parent_author": "vanddar4",
      "parent_permlink": "bitcoin-at-edge-of-downtrending-pitchfork-will-bulls-show-up",
      "permlink": "re-vanddar4-bitcoin-at-edge-of-downtrending-pitchfork-will-bulls-show-up-20180621t234623718z",
      "title": ""
    }
  ],
  "op_in_trx": 0,
  "timestamp": "2018-06-21T23:46:24",
  "trx_id": "c77bc6de4d53e273c3fea6ab2e45d9de888fd40f",
  "trx_in_block": 4,
  "virtual_op": 0
}vanddar4published a new post: bitcoin-at-edge-of-downtrending-pitchfork-will-bulls-show-up2018/06/21 23:45:48
vanddar4published a new post: bitcoin-at-edge-of-downtrending-pitchfork-will-bulls-show-up
2018/06/21 23:45:48
| author | vanddar4 |
| body | On the hourly analog Bitcoin Bitfinex chart, I have been tracking a pitchfork that I went over in some detail yesterday that has been tracking the downdraft since May 5th. As expected, price has pretty much trended sideways over the past 24 hours without making a significant move, but that appears likely to change quite soon. Price is still in this red down-trending channel on the upper band of the pitchfork and while it’s showing signs of wanting to make a breakout to the upside there are many bearish cases to be made too. The light blue line that is wiggling across the snapshot is the 50 hour moving average and just as before price has been hugging, testing and retesting this line for the past 12 hours constantly. This pricing movement is reminiscent of the bear flag that was painted on June 8th with the 50 hour MA battle and the subsequent breakdown from $7,600 to $6,100. Price is still on the bull side of the 50 hour MA and I am betting there is at least an attempt to move outside the pitchfork over the next few hours. Once again, the volume is going to be key to see if the bulls can push price significantly higher. If price can’t make a close above the $6,825 level, which is the upper black trend-line on the bearish wedge running up through the pitchfork, then I can see price heading back to $6,475 near the bottom range of the bearish flag and the outside of the 1sd blue channel on the pitchfork. I have marked it with a target. On the bullish case, making a higher high above the blue horizontal line at $6,852 will be critical over the next 24 hours. There are many different patterns that could take place here, but I find the bullish flag between the pink lines also compelling for a potential pop to the upside. The upper yellow line of the bearish flag at $6,950 is a decent start for now. The RSI is relatively neutral for now and could go both ways, and I am liking the look of the MACD which has the histogram starting to trend upwards and blue trigger line starting to curl upwards bullishly as well. Even when the trigger line crossed bearishly under 0 on the indicator earlier today there was very little follow-through from the bears, so it appears upward first is the next target. 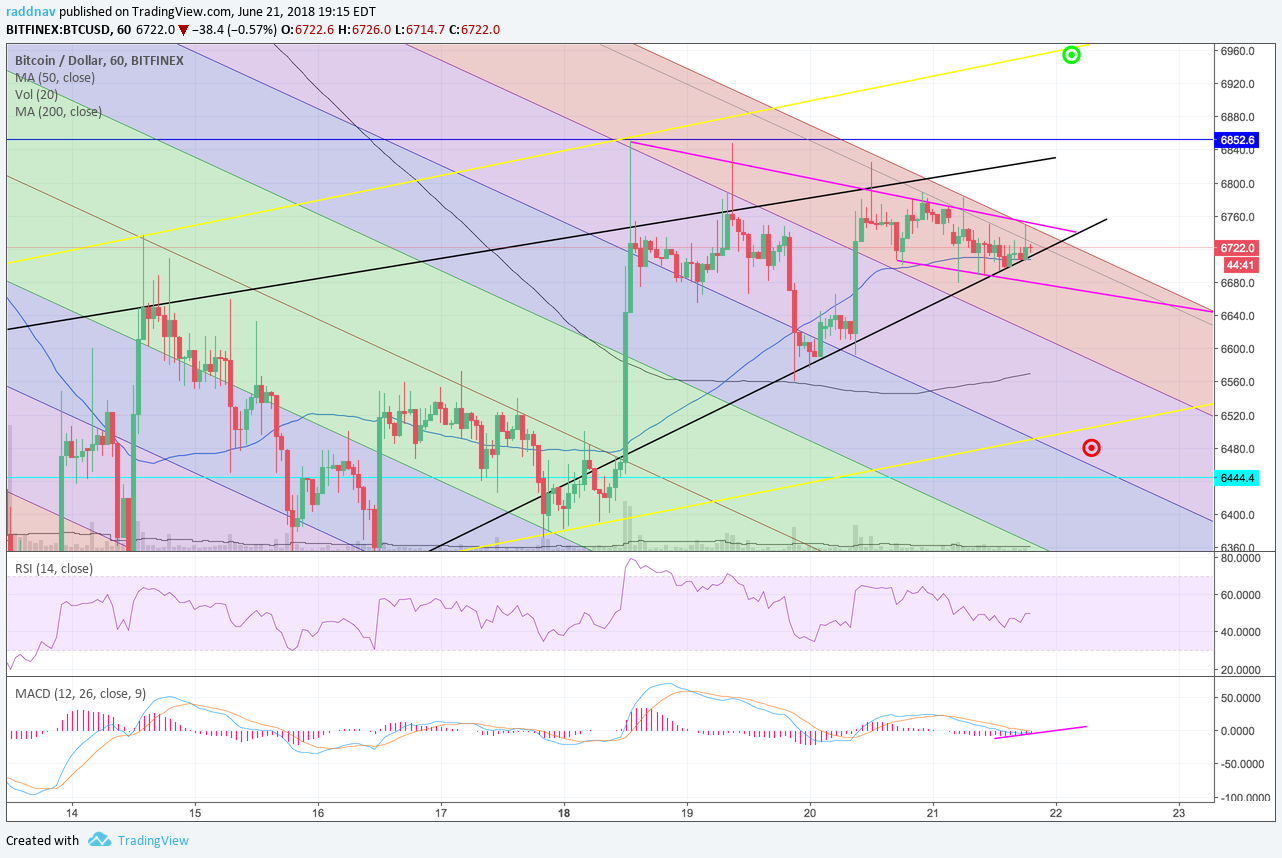 On the daily analog Bitcoin Bitfinex chart, you can see some of the formations taking place a bit better. There has been a slightly increasing volume over the past few days still and if price does break either direction, it could paint another day of escalating volume. I think worse case scenario on the daily chart for right now would be a total inverse and opposite reaction on the pitchfork back down to the $6,100 lows. Maybe it wouldn’t go that far and only to the median line of the pitchfork. What I don’t like is when comparing the price to the RSI indicator there is no bullish divergence forming yet. A break back down to the median of the pitchfork could possibly provide that opportunity. There is bullish divergence on the MACD still as I have circled in black and connected with a pink line showing the higher lows and you can see price over that same period is providing lower lows. Hopefully, there will be some more volatility by tomorrow with increasing volume. The key here is if you are trading to keep your stop losses tight and do your own research, because there is potential for price to break to the upside and then back to the downside quickly. Have a good evening. -More on Vanddar.com 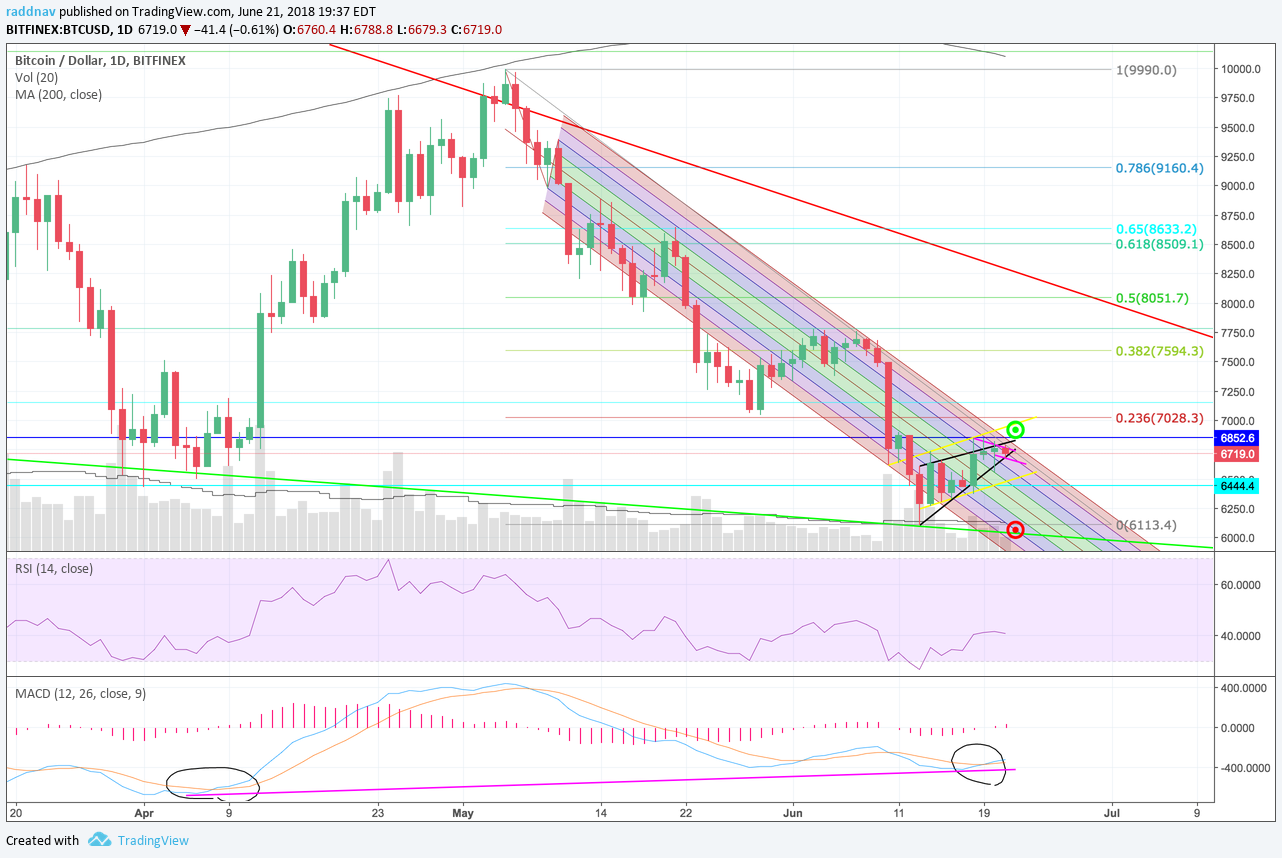 |
| json metadata | {"tags":["btc","bitcoin","crypto"],"image":["https://cdn.steemitimages.com/DQmXAWsfQJwh7coWTdsfBRDDym8qksnrpEfKSBn1TBhrUwu/image.png","https://cdn.steemitimages.com/DQmZNeMjmhWNHxdXGwggEvyuETvdutXcrafJcTKDnuGKj4Y/image.png"],"app":"steemit/0.1","format":"markdown"} |
| parent author | |
| parent permlink | btc |
| permlink | bitcoin-at-edge-of-downtrending-pitchfork-will-bulls-show-up |
| title | Bitcoin at Edge of Downtrending Pitchfork: Will Bulls Show Up? |
| Transaction Info | Block #23529613/Trx a99933c4ab8f1880d39c3cc5b7e935768b2072e4 |
View Raw JSON Data
{
"block": 23529613,
"op": [
"comment",
{
"author": "vanddar4",
"body": "On the hourly analog Bitcoin Bitfinex chart, I have been tracking a pitchfork that I went over in some detail yesterday that has been tracking the downdraft since May 5th. As expected, price has pretty much trended sideways over the past 24 hours without making a significant move, but that appears likely to change quite soon. \n\nPrice is still in this red down-trending channel on the upper band of the pitchfork and while it’s showing signs of wanting to make a breakout to the upside there are many bearish cases to be made too.\n\nThe light blue line that is wiggling across the snapshot is the 50 hour moving average and just as before price has been hugging, testing and retesting this line for the past 12 hours constantly. \n\nThis pricing movement is reminiscent of the bear flag that was painted on June 8th with the 50 hour MA battle and the subsequent breakdown from $7,600 to $6,100. Price is still on the bull side of the 50 hour MA and I am betting there is at least an attempt to move outside the pitchfork over the next few hours. Once again, the volume is going to be key to see if the bulls can push price significantly higher. \n\nIf price can’t make a close above the $6,825 level, which is the upper black trend-line on the bearish wedge running up through the pitchfork, then I can see price heading back to $6,475 near the bottom range of the bearish flag and the outside of the 1sd blue channel on the pitchfork. I have marked it with a target.\n\nOn the bullish case, making a higher high above the blue horizontal line at $6,852 will be critical over the next 24 hours. There are many different patterns that could take place here, but I find the bullish flag between the pink lines also compelling for a potential pop to the upside. The upper yellow line of the bearish flag at $6,950 is a decent start for now.\n\nThe RSI is relatively neutral for now and could go both ways, and I am liking the look of the MACD which has the histogram starting to trend upwards and blue trigger line starting to curl upwards bullishly as well. Even when the trigger line crossed bearishly under 0 on the indicator earlier today there was very little follow-through from the bears, so it appears upward first is the next target.\n\n\n\nOn the daily analog Bitcoin Bitfinex chart, you can see some of the formations taking place a bit better. There has been a slightly increasing volume over the past few days still and if price does break either direction, it could paint another day of escalating volume.\n\nI think worse case scenario on the daily chart for right now would be a total inverse and opposite reaction on the pitchfork back down to the $6,100 lows. Maybe it wouldn’t go that far and only to the median line of the pitchfork. \n\nWhat I don’t like is when comparing the price to the RSI indicator there is no bullish divergence forming yet. A break back down to the median of the pitchfork could possibly provide that opportunity. \n\nThere is bullish divergence on the MACD still as I have circled in black and connected with a pink line showing the higher lows and you can see price over that same period is providing lower lows.\n\nHopefully, there will be some more volatility by tomorrow with increasing volume. The key here is if you are trading to keep your stop losses tight and do your own research, because there is potential for price to break to the upside and then back to the downside quickly. Have a good evening.\n\n-More on Vanddar.com\n\n",
"json_metadata": "{\"tags\":[\"btc\",\"bitcoin\",\"crypto\"],\"image\":[\"https://cdn.steemitimages.com/DQmXAWsfQJwh7coWTdsfBRDDym8qksnrpEfKSBn1TBhrUwu/image.png\",\"https://cdn.steemitimages.com/DQmZNeMjmhWNHxdXGwggEvyuETvdutXcrafJcTKDnuGKj4Y/image.png\"],\"app\":\"steemit/0.1\",\"format\":\"markdown\"}",
"parent_author": "",
"parent_permlink": "btc",
"permlink": "bitcoin-at-edge-of-downtrending-pitchfork-will-bulls-show-up",
"title": "Bitcoin at Edge of Downtrending Pitchfork: Will Bulls Show Up?"
}
],
"op_in_trx": 0,
"timestamp": "2018-06-21T23:45:48",
"trx_id": "a99933c4ab8f1880d39c3cc5b7e935768b2072e4",
"trx_in_block": 18,
"virtual_op": 0
}vanddar4published a new post: bitcoin-testing-schiff-downtrending-pitchfork-for-breakout2018/06/20 22:34:00
vanddar4published a new post: bitcoin-testing-schiff-downtrending-pitchfork-for-breakout
2018/06/20 22:34:00
| author | vanddar4 |
| body | After a failed motherboard and hard drive Monday morning I have some new tech to continue the writing. The cryptos have been decently unimpressive after some glimpses of hope the past few days, so come in and let's dig a little deeper. On the hourly analog Bitcoin Bitfinex chart below, I have been tracking this down-trending pitchfork which I have revised slightly to an Schiff pitchfork from the high of May 5th to the swing low on May 9th and back again to the swing high on May 10th. The Schiff pitchfork has contained price pretty well within 2 standard deviations (sd) for almost the entire downtrend and today price is right on the precipice of making a move again. On the screenshot below you will see how, price was denied right at the outside of that red 2 sd line. Throughout the remainder of last week and the weekend price rallied back up to the red median line in the middle of the pitchfork, retest the blue 1 sd line twice, before hugging the median line pretty tightly before exploding through the median line on Monday at 12pm EST. Price then popped up to the 1.5 sd purple channel and then back to the black 200 hour moving average before finally giving the 2 sd red channel a test today. Over the next few hours here, it looks like price will test the bottom side of that upper red channel which is also converging with the light blue 50 hour moving average at $6,694. Next I would think a retest of the top of that upper red channel at maybe $6,800. Depending on the volume around there, and the strength of the bulls will determine the next fate for Bitcoin. A decisive green candle could easily lead to a rally back up to $7,500, but if there is no volume a trip down to the mid $5,000’s could be possible. I have also drawn a bearish flag between the two parallel yellow lines and if the bulls don’t break that $6,950 level at the top of that channel the bears could take over there again. The RSI is currently heading to overbought levels, so that needs to be worked off a bit over the next few hours for a move higher and the MACD is concordantly curling downward as well. It may be another 24 hours before any big price moves happen. 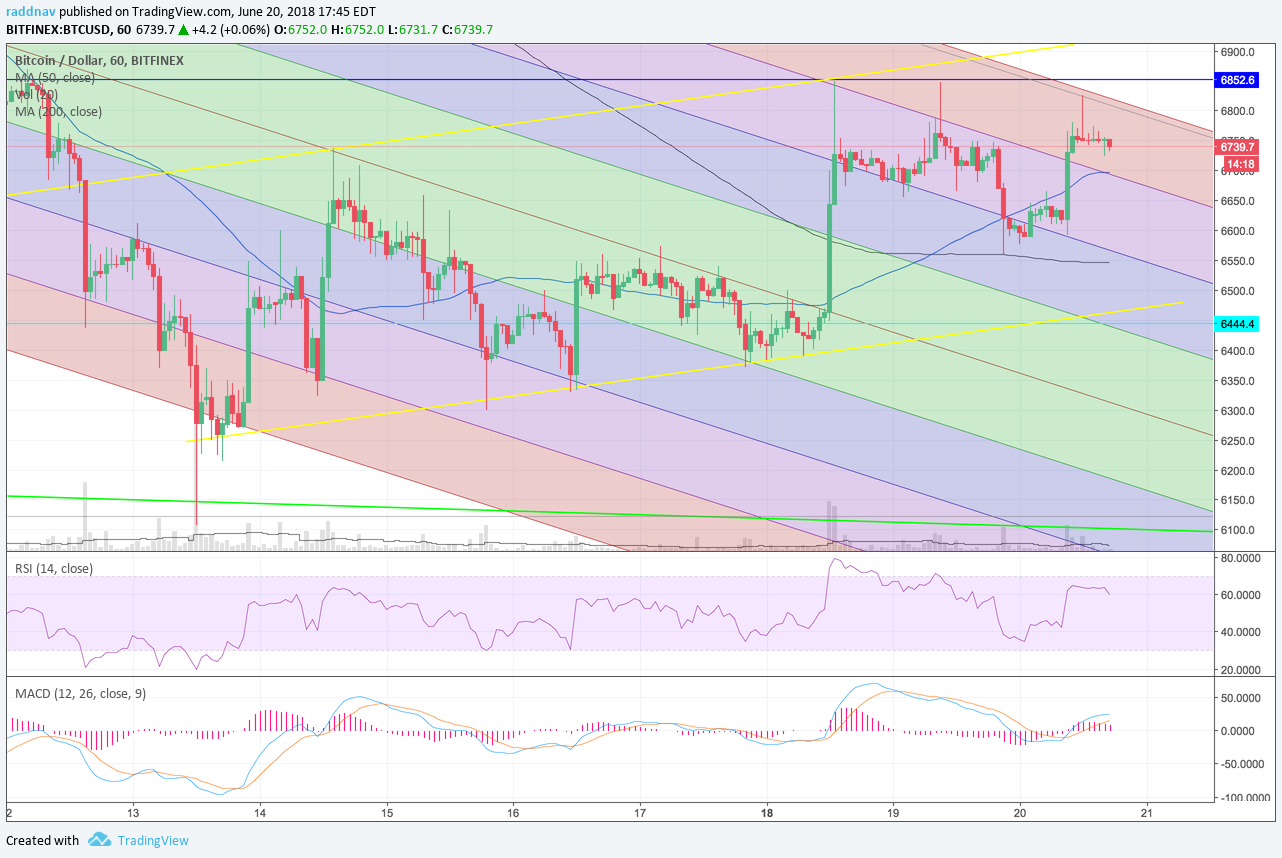 On the daily analog Bitcoin Bitfinex chart below, I have drawn an upside down Fibonacci retracement line based on the top on May 5th to the bottom on June 13th at $6,108 and if this is the 5th Elliot Wave in this bearish downdraft a revisit to $7,594 at the 0.382 retracement appears likely over the next week. The candles are pretty indecisive right now and may continue to be for the next few days, but volume does appear to be picking up slightly at least over the last 3 days. The good news is the MACD does have a bullish crossover as well now, which I have circled and the last time this happened back in April it took 3 days to have it’s bullish pop to take price up $1,300. The histogram is still gradually trending upward as well. The RSI is still pretty oversold, but also appears like it wants to move higher. Still don’t like that bearish flag between the yellow parallel lines. Best to wait and see what happens over the next 24 hours. Overall, the past few months of trading action looks quite similar to a Wyckoff Accumulation Phase C, where price could head a bit lower, but this could be the last leg down before price begins to get marked up again. I’ll keep an eye on it, if that pattern continues. -More on Vanddar.com 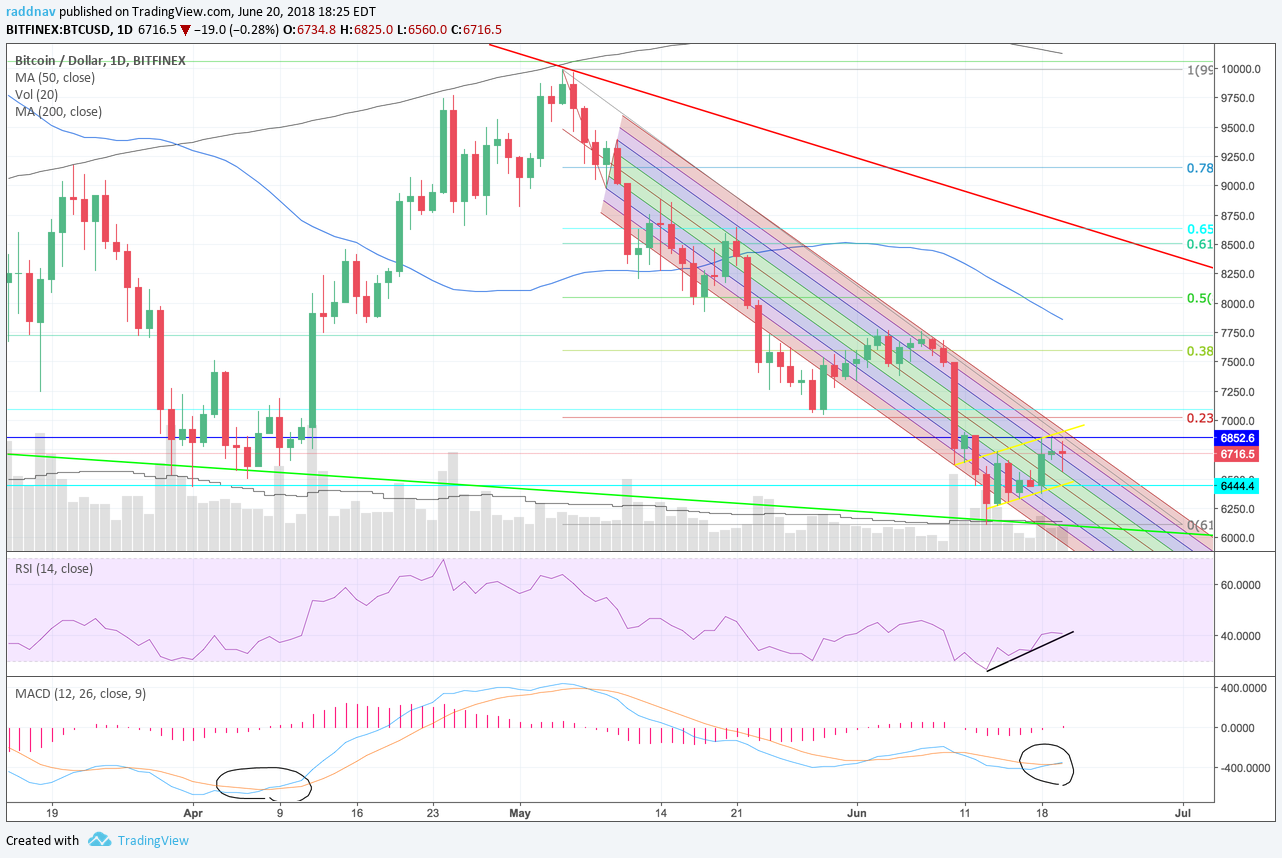 |
| json metadata | {"tags":["btc","bitcoin","cryptocurrency"],"image":["https://cdn.steemitimages.com/DQmTNiwAubch3SqhJUCLnm9xnszdxhkFPnhY8foPFzdi2ku/image.png","https://cdn.steemitimages.com/DQmQ1znpP7nRRHigVKWEcNPU9aEBLbWD1eVU8qGKs6trbz5/image.png"],"app":"steemit/0.1","format":"markdown"} |
| parent author | |
| parent permlink | btc |
| permlink | bitcoin-testing-schiff-downtrending-pitchfork-for-breakout |
| title | Bitcoin Testing Schiff Downtrending Pitchfork for Breakout |
| Transaction Info | Block #23499382/Trx 88e632e03e46d4f8fd87a4dca63e02b87feb4adc |
View Raw JSON Data
{
"block": 23499382,
"op": [
"comment",
{
"author": "vanddar4",
"body": "After a failed motherboard and hard drive Monday morning I have some new tech to continue the writing. The cryptos have been decently unimpressive after some glimpses of hope the past few days, so come in and let's dig a little deeper.\n\nOn the hourly analog Bitcoin Bitfinex chart below, I have been tracking this down-trending pitchfork which I have revised slightly to an Schiff pitchfork from the high of May 5th to the swing low on May 9th and back again to the swing high on May 10th. \n\nThe Schiff pitchfork has contained price pretty well within 2 standard deviations (sd) for almost the entire downtrend and today price is right on the precipice of making a move again.\n\nOn the screenshot below you will see how, price was denied right at the outside of that red 2 sd line. Throughout the remainder of last week and the weekend price rallied back up to the red median line in the middle of the pitchfork, retest the blue 1 sd line twice, before hugging the median line pretty tightly before exploding through the median line on Monday at 12pm EST.\n\nPrice then popped up to the 1.5 sd purple channel and then back to the black 200 hour moving average before finally giving the 2 sd red channel a test today.\n\nOver the next few hours here, it looks like price will test the bottom side of that upper red channel which is also converging with the light blue 50 hour moving average at $6,694. Next I would think a retest of the top of that upper red channel at maybe $6,800.\n\nDepending on the volume around there, and the strength of the bulls will determine the next fate for Bitcoin. A decisive green candle could easily lead to a rally back up to $7,500, but if there is no volume a trip down to the mid $5,000’s could be possible.\n\nI have also drawn a bearish flag between the two parallel yellow lines and if the bulls don’t break that $6,950 level at the top of that channel the bears could take over there again.\n\nThe RSI is currently heading to overbought levels, so that needs to be worked off a bit over the next few hours for a move higher and the MACD is concordantly curling downward as well. It may be another 24 hours before any big price moves happen.\n\n\n\nOn the daily analog Bitcoin Bitfinex chart below, I have drawn an upside down Fibonacci retracement line based on the top on May 5th to the bottom on June 13th at $6,108 and if this is the 5th Elliot Wave in this bearish downdraft a revisit to $7,594 at the 0.382 retracement appears likely over the next week. \n\nThe candles are pretty indecisive right now and may continue to be for the next few days, but volume does appear to be picking up slightly at least over the last 3 days.\n\nThe good news is the MACD does have a bullish crossover as well now, which I have circled and the last time this happened back in April it took 3 days to have it’s bullish pop to take price up $1,300. The histogram is still gradually trending upward as well.\n\nThe RSI is still pretty oversold, but also appears like it wants to move higher. Still don’t like that bearish flag between the yellow parallel lines. Best to wait and see what happens over the next 24 hours. \n\nOverall, the past few months of trading action looks quite similar to a Wyckoff Accumulation Phase C, where price could head a bit lower, but this could be the last leg down before price begins to get marked up again. I’ll keep an eye on it, if that pattern continues.\n\n-More on Vanddar.com\n\n",
"json_metadata": "{\"tags\":[\"btc\",\"bitcoin\",\"cryptocurrency\"],\"image\":[\"https://cdn.steemitimages.com/DQmTNiwAubch3SqhJUCLnm9xnszdxhkFPnhY8foPFzdi2ku/image.png\",\"https://cdn.steemitimages.com/DQmQ1znpP7nRRHigVKWEcNPU9aEBLbWD1eVU8qGKs6trbz5/image.png\"],\"app\":\"steemit/0.1\",\"format\":\"markdown\"}",
"parent_author": "",
"parent_permlink": "btc",
"permlink": "bitcoin-testing-schiff-downtrending-pitchfork-for-breakout",
"title": "Bitcoin Testing Schiff Downtrending Pitchfork for Breakout"
}
],
"op_in_trx": 0,
"timestamp": "2018-06-20T22:34:00",
"trx_id": "88e632e03e46d4f8fd87a4dca63e02b87feb4adc",
"trx_in_block": 7,
"virtual_op": 0
}2018/06/16 16:39:57
2018/06/16 16:39:57
| author | vanddar4 |
| permlink | bitcoin-potential-double-reverse-head-and-shoulder-bottom |
| voter | martin.starosta |
| weight | 1000 (10.00%) |
| Transaction Info | Block #23377157/Trx f42b3bc080fdc7fd30aca2e8e706c806c24983b8 |
View Raw JSON Data
{
  "block": 23377157,
  "op": [
    "vote",
    {
      "author": "vanddar4",
      "permlink": "bitcoin-potential-double-reverse-head-and-shoulder-bottom",
      "voter": "martin.starosta",
      "weight": 1000
    }
  ],
  "op_in_trx": 0,
  "timestamp": "2018-06-16T16:39:57",
  "trx_id": "f42b3bc080fdc7fd30aca2e8e706c806c24983b8",
  "trx_in_block": 0,
  "virtual_op": 0
}pinoyupvoted (10.00%) @vanddar4 / bitcoin-potential-double-reverse-head-and-shoulder-bottom2018/06/15 20:41:24
pinoyupvoted (10.00%) @vanddar4 / bitcoin-potential-double-reverse-head-and-shoulder-bottom
2018/06/15 20:41:24
| author | vanddar4 |
| permlink | bitcoin-potential-double-reverse-head-and-shoulder-bottom |
| voter | pinoy |
| weight | 1000 (10.00%) |
| Transaction Info | Block #23353188/Trx 04efb3bac6d1232cb2cffea1e2e5c4cc50cfd064 |
View Raw JSON Data
{
  "block": 23353188,
  "op": [
    "vote",
    {
      "author": "vanddar4",
      "permlink": "bitcoin-potential-double-reverse-head-and-shoulder-bottom",
      "voter": "pinoy",
      "weight": 1000
    }
  ],
  "op_in_trx": 0,
  "timestamp": "2018-06-15T20:41:24",
  "trx_id": "04efb3bac6d1232cb2cffea1e2e5c4cc50cfd064",
  "trx_in_block": 38,
  "virtual_op": 0
}vanddar4published a new post: bitcoin-potential-double-reverse-head-and-shoulder-bottom2018/06/15 20:08:24
vanddar4published a new post: bitcoin-potential-double-reverse-head-and-shoulder-bottom
2018/06/15 20:08:24
| author | vanddar4 |
| body | There seems to be overwhelming bearish sentiment on social media, so is it a foregone conclusion the bears will get worse? Let's discuss. On the hourly analog Bitcoin Bitfinex chart, price is essentially in the same place as yesterday. I had indicated that price could ride the blue 1 standard deviation (sd) line for a while before breaking down to the 50 hour moving average. Fortunately, this has been the story so far, but the question is which way will it break now? I have placed two reverse head and shoulders formations on this hourly chart below and one of which had been completed yesterday, but the other stands a chance to complete and head upward bullishly tonight or by tomorrow Saturday morning EST. Both patterns have a downward sloping neckline and decent volume to indicate that the trend is about to change on the each head and shoulder. However, the last right shoulder here on the bigger formation is lacking volume to convince me it’s going to breakout. The 1sd upward side of the pitchfork is providing good resistance and more importantly that dark blue horizontal line at $6,610. The RSI indicator is fairly neutral at 49.51, but the MACD much more interesting. You can see how the blue trigger line is barely holding the 0 line bound, currently sitting at 0.40. If it breaks down through there you can expect further downward pressure. Overall, it appears as if the trigger is line wants to curl up and bullishly reverse, but needs to some other players to join the bandwagon. The red lines on the histogram are also bullishly trending upward, but may be losing some steam the past few hours as well. It’s a close call, but I am leaning bullish for now, especially given these potential reverse head and shoulders formations. 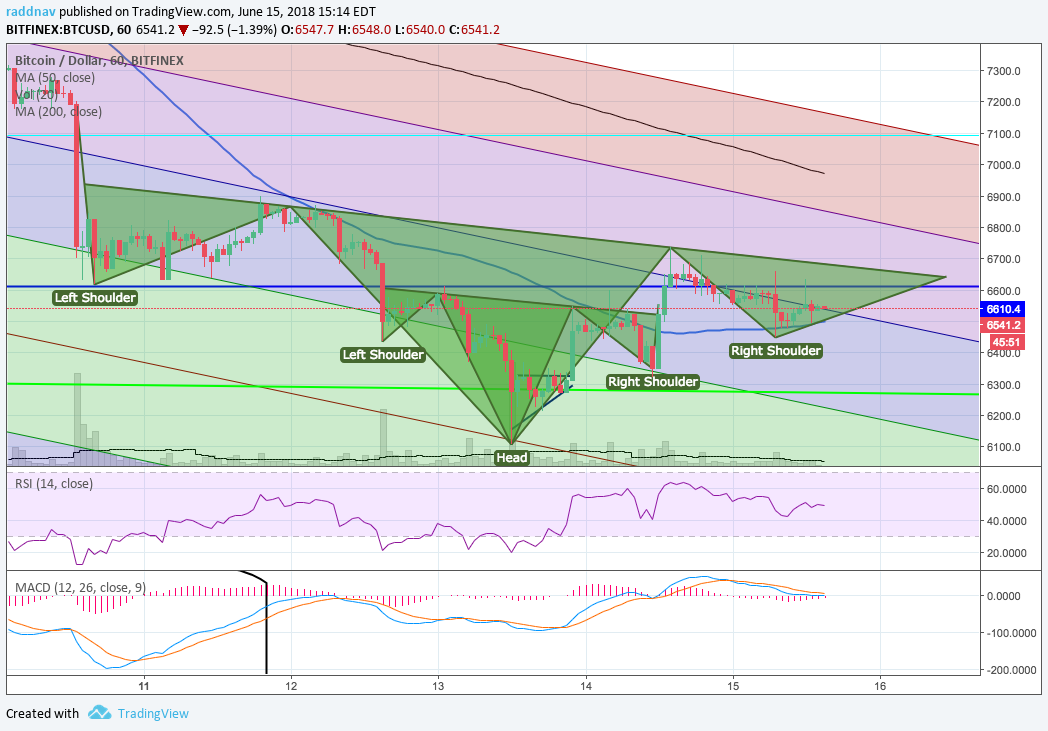 On the daily analog Bitcoin Bitfinex chart, there is not a whole lot that has changed. Yesterday’s close put in a nice bullish engulfing candle to signal a reverse of the trend. Today’s candle so far has a red doji signaling some indecision in the market, however does not mean a lot for one trend or another. There was also a green indecision doji on Monday and look how much price fell on Tuesday and Wednesday. If going by that logic, a red closing doji today could lead to a more complete reversal especially in conjunction with the inverted head and shoulder patterns we have been looking at on the hourly chart. The RSI is still just a shade from being oversold, sitting at 34.06 and appears to be showing a continuation of the downward pattern, however the MACD still has has some strong bullish divergence from the past few months. The histogram bars are also trending upward bullishly which are marked with a small purple line on the indicator. The biggest indicator lacking right now is the volume, which would have to increase significantly over the next few hours to show a reversal. If price does reverse, I think a bullish target of $6,800 is in the cards over the weekend and possibly closer to $7,100. If a breakdown occurs, there should be further support at the lime green down-trending line of $6,250. I have marked them with little targets. 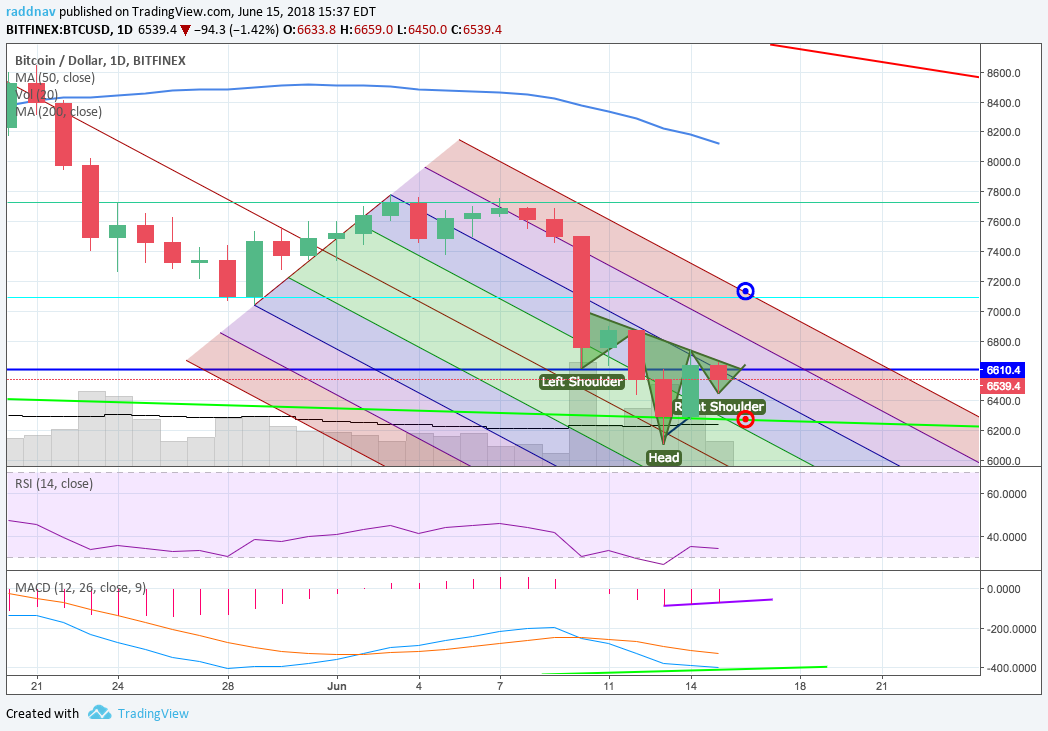 Another potential point to keep an eye on would be the Bitcoin USD Shorts on Bitfinex. Back on April 12th when price popped about $1,300 dollars in one day, this large short squeeze candle was the main contributor. Someone had see that the shorts were over leveraged and boy did they get squeezed out of their money hard. Something similar could happen again with the current run up in the short contracts. They are just a fraction from being overbought on the RSI at 68.41 and could withstanding losing some more money. If the BTC price starts heading upward quickly, you can be sure this will be moving down inversely. Have a good weekend! -More at Vanddar.com 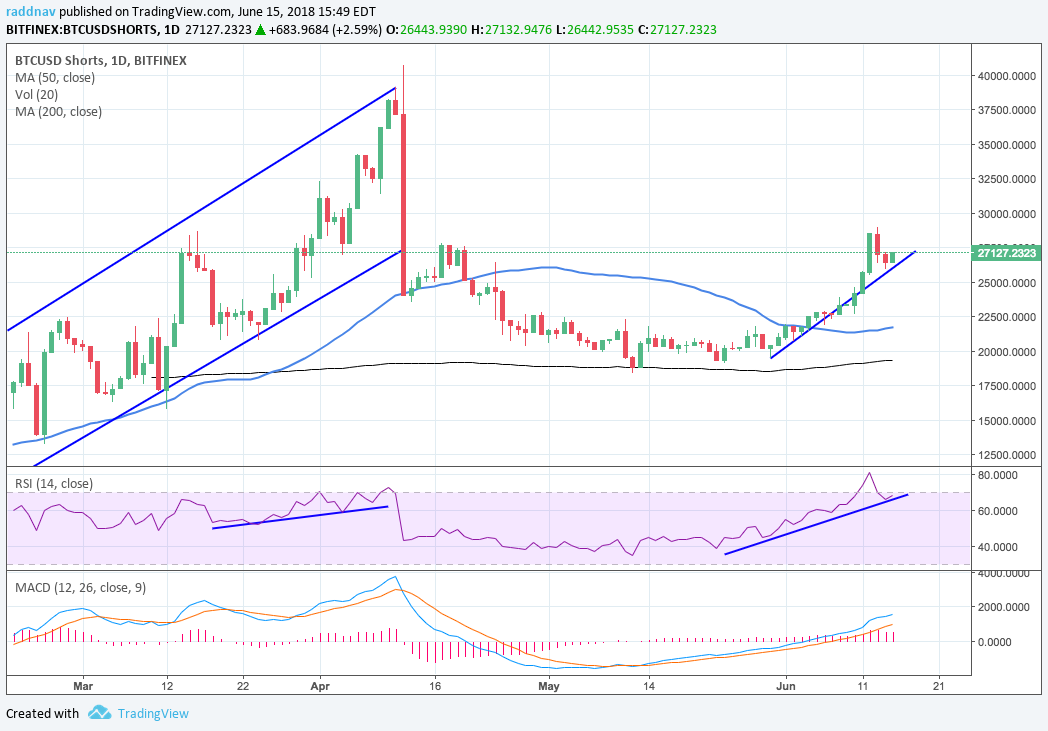 |
| json metadata | {"tags":["btc","bitcoin","crypto","cryptocurrencies","ta"],"image":["https://cdn.steemitimages.com/DQmRsiA9zkgCtXj7Kccf3zRS27DXQ3X8Kc8WBK6Jfvj9RFL/image.png","https://cdn.steemitimages.com/DQmYfRHNCaeDfdjmxo6qkTGZt21Q9jiPUsmRMRy84o1a42y/image.png","https://cdn.steemitimages.com/DQmNvx3ssVoiYM9ikfLv3D95tW95TGfUAZFXkFcTm1ZBZn3/image.png"],"app":"steemit/0.1","format":"markdown"} |
| parent author | |
| parent permlink | btc |
| permlink | bitcoin-potential-double-reverse-head-and-shoulder-bottom |
| title | Bitcoin Potential Double Reverse Head and Shoulder Bottom |
| Transaction Info | Block #23352528/Trx 8b9096c80af976a267a7526a30d5d9c3dd69e102 |
View Raw JSON Data
{
"block": 23352528,
"op": [
"comment",
{
"author": "vanddar4",
"body": "There seems to be overwhelming bearish sentiment on social media, so is it a foregone conclusion the bears will get worse? Let's discuss.\n\nOn the hourly analog Bitcoin Bitfinex chart, price is essentially in the same place as yesterday. I had indicated that price could ride the blue 1 standard deviation (sd) line for a while before breaking down to the 50 hour moving average. Fortunately, this has been the story so far, but the question is which way will it break now?\n\nI have placed two reverse head and shoulders formations on this hourly chart below and one of which had been completed yesterday, but the other stands a chance to complete and head upward bullishly tonight or by tomorrow Saturday morning EST.\n\nBoth patterns have a downward sloping neckline and decent volume to indicate that the trend is about to change on the each head and shoulder. However, the last right shoulder here on the bigger formation is lacking volume to convince me it’s going to breakout. The 1sd upward side of the pitchfork is providing good resistance and more importantly that dark blue horizontal line at $6,610.\n\nThe RSI indicator is fairly neutral at 49.51, but the MACD much more interesting. You can see how the blue trigger line is barely holding the 0 line bound, currently sitting at 0.40. If it breaks down through there you can expect further downward pressure.\n\nOverall, it appears as if the trigger is line wants to curl up and bullishly reverse, but needs to some other players to join the bandwagon. The red lines on the histogram are also bullishly trending upward, but may be losing some steam the past few hours as well. \n\nIt’s a close call, but I am leaning bullish for now, especially given these potential reverse head and shoulders formations.\n\n\n\nOn the daily analog Bitcoin Bitfinex chart, there is not a whole lot that has changed. Yesterday’s close put in a nice bullish engulfing candle to signal a reverse of the trend. Today’s candle so far has a red doji signaling some indecision in the market, however does not mean a lot for one trend or another. \n\nThere was also a green indecision doji on Monday and look how much price fell on Tuesday and Wednesday. If going by that logic, a red closing doji today could lead to a more complete reversal especially in conjunction with the inverted head and shoulder patterns we have been looking at on the hourly chart. \n\nThe RSI is still just a shade from being oversold, sitting at 34.06 and appears to be showing a continuation of the downward pattern, however the MACD still has has some strong bullish divergence from the past few months. The histogram bars are also trending upward bullishly which are marked with a small purple line on the indicator.\n\nThe biggest indicator lacking right now is the volume, which would have to increase significantly over the next few hours to show a reversal. \n\nIf price does reverse, I think a bullish target of $6,800 is in the cards over the weekend and possibly closer to $7,100. If a breakdown occurs, there should be further support at the lime green down-trending line of $6,250. I have marked them with little targets.\n\n\n\nAnother potential point to keep an eye on would be the Bitcoin USD Shorts on Bitfinex. Back on April 12th when price popped about $1,300 dollars in one day, this large short squeeze candle was the main contributor. \n\nSomeone had see that the shorts were over leveraged and boy did they get squeezed out of their money hard. Something similar could happen again with the current run up in the short contracts. They are just a fraction from being overbought on the RSI at 68.41 and could withstanding losing some more money. \n\nIf the BTC price starts heading upward quickly, you can be sure this will be moving down inversely. Have a good weekend!\n\n-More at Vanddar.com\n\n",
"json_metadata": "{\"tags\":[\"btc\",\"bitcoin\",\"crypto\",\"cryptocurrencies\",\"ta\"],\"image\":[\"https://cdn.steemitimages.com/DQmRsiA9zkgCtXj7Kccf3zRS27DXQ3X8Kc8WBK6Jfvj9RFL/image.png\",\"https://cdn.steemitimages.com/DQmYfRHNCaeDfdjmxo6qkTGZt21Q9jiPUsmRMRy84o1a42y/image.png\",\"https://cdn.steemitimages.com/DQmNvx3ssVoiYM9ikfLv3D95tW95TGfUAZFXkFcTm1ZBZn3/image.png\"],\"app\":\"steemit/0.1\",\"format\":\"markdown\"}",
"parent_author": "",
"parent_permlink": "btc",
"permlink": "bitcoin-potential-double-reverse-head-and-shoulder-bottom",
"title": "Bitcoin Potential Double Reverse Head and Shoulder Bottom"
}
],
"op_in_trx": 0,
"timestamp": "2018-06-15T20:08:24",
"trx_id": "8b9096c80af976a267a7526a30d5d9c3dd69e102",
"trx_in_block": 100,
"virtual_op": 0
}martin.starostaupvoted (10.00%) @vanddar4 / bitcoin-daily-macd-strong-bullish-divergence2018/06/15 20:07:24
martin.starostaupvoted (10.00%) @vanddar4 / bitcoin-daily-macd-strong-bullish-divergence
2018/06/15 20:07:24
| author | vanddar4 |
| permlink | bitcoin-daily-macd-strong-bullish-divergence |
| voter | martin.starosta |
| weight | 1000 (10.00%) |
| Transaction Info | Block #23352508/Trx 10861a3f402eadc6cd088667021131c8ac983351 |
View Raw JSON Data
{
  "block": 23352508,
  "op": [
    "vote",
    {
      "author": "vanddar4",
      "permlink": "bitcoin-daily-macd-strong-bullish-divergence",
      "voter": "martin.starosta",
      "weight": 1000
    }
  ],
  "op_in_trx": 0,
  "timestamp": "2018-06-15T20:07:24",
  "trx_id": "10861a3f402eadc6cd088667021131c8ac983351",
  "trx_in_block": 12,
  "virtual_op": 0
}vanddar4published a new post: bitcoin-daily-macd-strong-bullish-divergence2018/06/14 23:24:03
vanddar4published a new post: bitcoin-daily-macd-strong-bullish-divergence
2018/06/14 23:24:03
| author | vanddar4 |
| body | I am back today after some frustrating tech issues and a bloody crypto market yesterday. Bitcoin is showing some signs of life with a nice bounce today, but how long can this last? First one is the standard hourly analog Bitcoin Bitfinex chart. Price is recovering nicely from the past two days of capitulation where price touched $6,108 just a $108 shy from the lows back in February. I have drawn two orange lines indicating a descending wedge on price over that period and you can see how price broke up and out of that wedge around 10pm EST last night. The candle there made a beeline for the thick blue line which represents the 50 hour moving average, but fell just short of it. A few hours later price did push through their briefly before being shoved lower back down to $6,322. But the bulls were not to be denied this time as we have big $150 candle from around noon EST today pushing price back up to $6,642 where price resides now. This 50 hour MA has been a tough level to breakthrough for the bulls the past few days, with the last crossover occurring last Friday night June 8th, to begin the bear smash signal. Thus this will be an important level to keep an eye on for continued bull momentum. You also probably notice the zoomed in view of a down-trending pitchfork that has a pivot anchor back on May 5th and covers the swing low and high on May 28th to June 3rd respectively. Since the price smashes on June 9th, it’s been holding the price action pretty nicely. Notice how the low yesterday bounced right off the red median line and has since bounced all the way back to the outside of the blue channel now. This is a good sign that price could continue to fight upward for a while. However if price continues to stall here at this blue channel line, it will definitely head back to that 50 hour MA at $6,464 before deciding what to do next. If price breaks up, $6,900 at the top of the purple channel will be the next target. RSI and the MACD are a bit high and appear to be turning over as well as the volume dying off, so I believe a revisit to the 50 hour MA is most likely first. 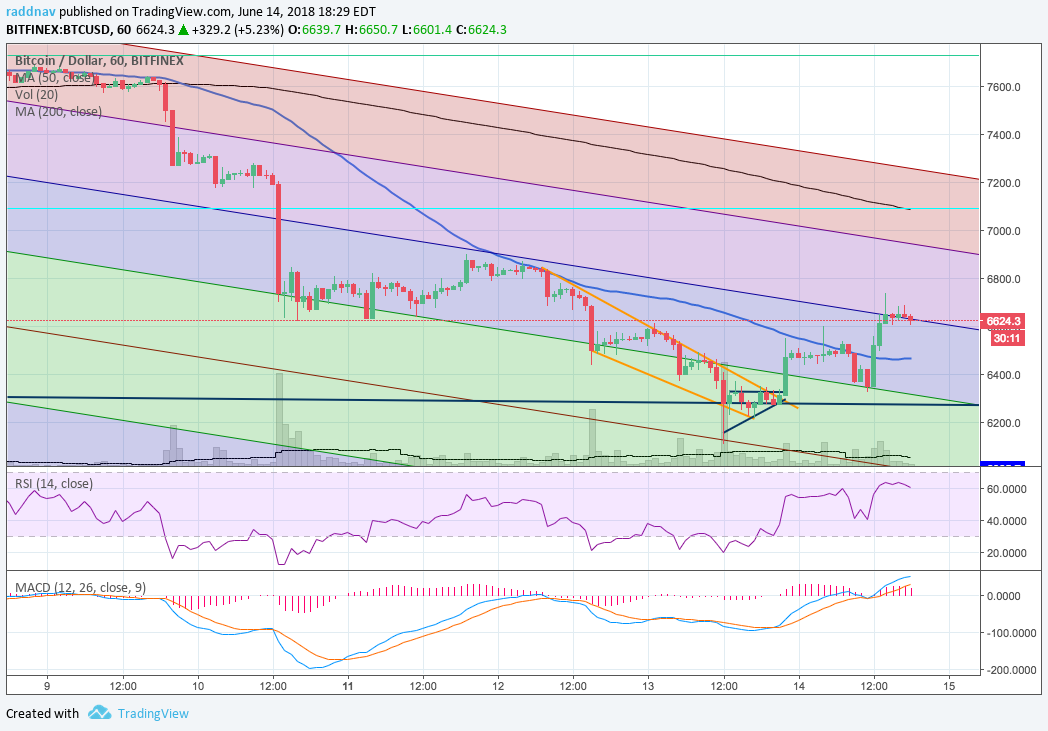 On the daily analog Bitcoin Bitfinex chart the lime green line will be a critical level for support to the downside around $6,250. I have drawn a blue horizontal support line at $6,610 and a red down-trending line all the way back up at $8,850 which forms a descending triangle. Many people see this as a bearish breakout from yesterday, however if you see price has fought all the way back to that level on bigger volume today. Is that enough to reverse the bearish trend? Additionally, that red line and the lime green line are forming another descending wedge and if price can stay within it, it could carry some weight on the next bullish upswing. Bitcoin is still recovering from the lowest RSI indicator level yesterday (26.81) since August 15th, 2015 (26.26) and unfortunately eliminated the bullish divergence that we were hoping might form by taking out the February 5th RSI low (27.00). The RSI has only dropped into these oversold levels 4 times since the beginning of 2016, and some of the bear market action of 2014 is appearing quite similar compared to some of the pricing and RSI levels. However a look at the MACD and there is some contrary evidence. I have circled 3 level in black on the MACD line where the blue trigger line bullishly crossed over the trailing orange line only for it to be a fake out and price then continued lower. The good news is the next the crossover did occur it lead to a nice bull run. Additionally I have drawn lime green lines on the MACD to show the higher lows, but price is giving lower lows, this is a sign of strong bullish reversal divergence and I like the way that looks.If price heads back to the 50 hour MA and holds strong there could be a giant price pop in volume from there. -More on Vanddar.com 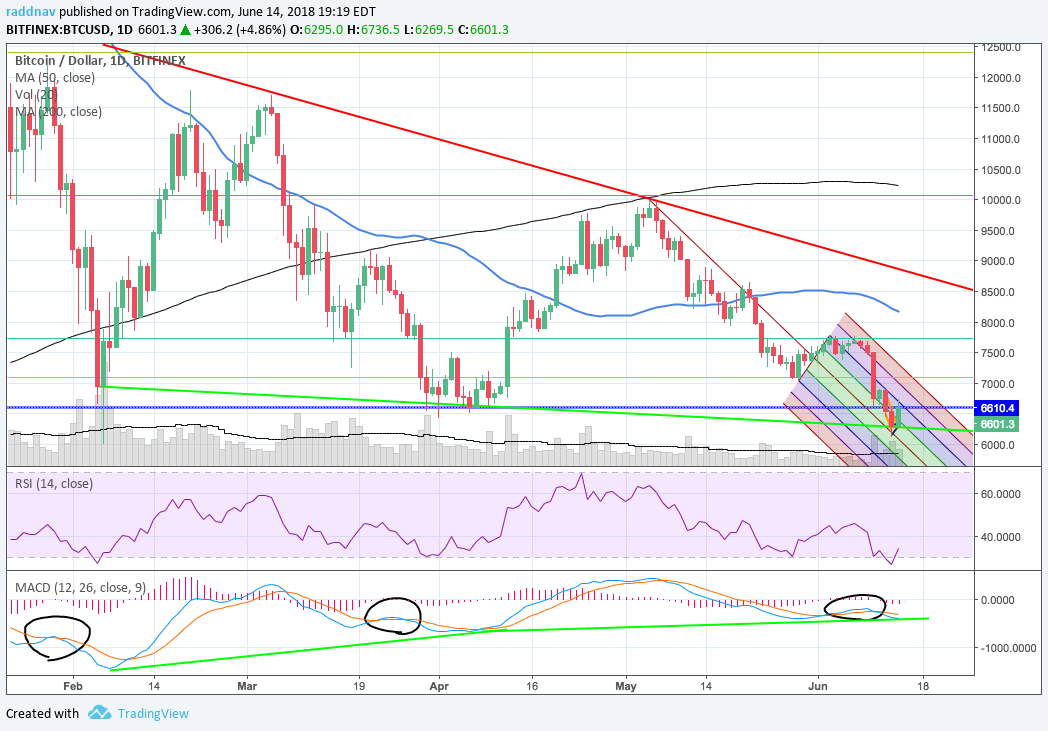 |
| json metadata | {"tags":["btc","crypto","bitcoin","cryptocurrencies"],"image":["https://cdn.steemitimages.com/DQmSV71BADj4UPQ6X5iVV5wfqY8gYgTGCiwdiqaXbcgModU/image.png","https://cdn.steemitimages.com/DQmWh4S5w3e2pj7jDTtEQkSMqBwDwDkw23Rfcn3pfdVBH52/image.png"],"app":"steemit/0.1","format":"markdown"} |
| parent author | |
| parent permlink | btc |
| permlink | bitcoin-daily-macd-strong-bullish-divergence |
| title | Bitcoin Daily MACD Strong Bullish Divergence |
| Transaction Info | Block #23327645/Trx ce5cf6a8e31d2e17ba94f9b74cd2af1b70f396c4 |
View Raw JSON Data
{
"block": 23327645,
"op": [
"comment",
{
"author": "vanddar4",
"body": "I am back today after some frustrating tech issues and a bloody crypto market yesterday. Bitcoin is showing some signs of life with a nice bounce today, but how long can this last?\n\nFirst one is the standard hourly analog Bitcoin Bitfinex chart. Price is recovering nicely from the past two days of capitulation where price touched $6,108 just a $108 shy from the lows back in February. \n\nI have drawn two orange lines indicating a descending wedge on price over that period and you can see how price broke up and out of that wedge around 10pm EST last night. \n\nThe candle there made a beeline for the thick blue line which represents the 50 hour moving average, but fell just short of it. A few hours later price did push through their briefly before being shoved lower back down to $6,322. But the bulls were not to be denied this time as we have big $150 candle from around noon EST today pushing price back up to $6,642 where price resides now.\n\nThis 50 hour MA has been a tough level to breakthrough for the bulls the past few days, with the last crossover occurring last Friday night June 8th, to begin the bear smash signal. Thus this will be an important level to keep an eye on for continued bull momentum. \n\nYou also probably notice the zoomed in view of a down-trending pitchfork that has a pivot anchor back on May 5th and covers the swing low and high on May 28th to June 3rd respectively. Since the price smashes on June 9th, it’s been holding the price action pretty nicely. \n\nNotice how the low yesterday bounced right off the red median line and has since bounced all the way back to the outside of the blue channel now. This is a good sign that price could continue to fight upward for a while. \n\nHowever if price continues to stall here at this blue channel line, it will definitely head back to that 50 hour MA at $6,464 before deciding what to do next. If price breaks up, $6,900 at the top of the purple channel will be the next target.\n\nRSI and the MACD are a bit high and appear to be turning over as well as the volume dying off, so I believe a revisit to the 50 hour MA is most likely first.\n\n\n\nOn the daily analog Bitcoin Bitfinex chart the lime green line will be a critical level for support to the downside around $6,250. I have drawn a blue horizontal support line at $6,610 and a red down-trending line all the way back up at $8,850 which forms a descending triangle. \n\nMany people see this as a bearish breakout from yesterday, however if you see price has fought all the way back to that level on bigger volume today. Is that enough to reverse the bearish trend?\n\nAdditionally, that red line and the lime green line are forming another descending wedge and if price can stay within it, it could carry some weight on the next bullish upswing. \n\nBitcoin is still recovering from the lowest RSI indicator level yesterday (26.81) since August 15th, 2015 (26.26) and unfortunately eliminated the bullish divergence that we were hoping might form by taking out the February 5th RSI low (27.00).\n\nThe RSI has only dropped into these oversold levels 4 times since the beginning of 2016, and some of the bear market action of 2014 is appearing quite similar compared to some of the pricing and RSI levels. \n\nHowever a look at the MACD and there is some contrary evidence. I have circled 3 level in black on the MACD line where the blue trigger line bullishly crossed over the trailing orange line only for it to be a fake out and price then continued lower. The good news is the next the crossover did occur it lead to a nice bull run. \n\nAdditionally I have drawn lime green lines on the MACD to show the higher lows, but price is giving lower lows, this is a sign of strong bullish reversal divergence and I like the way that looks.If price heads back to the 50 hour MA and holds strong there could be a giant price pop in volume from there.\n\n-More on Vanddar.com\n\n",
"json_metadata": "{\"tags\":[\"btc\",\"crypto\",\"bitcoin\",\"cryptocurrencies\"],\"image\":[\"https://cdn.steemitimages.com/DQmSV71BADj4UPQ6X5iVV5wfqY8gYgTGCiwdiqaXbcgModU/image.png\",\"https://cdn.steemitimages.com/DQmWh4S5w3e2pj7jDTtEQkSMqBwDwDkw23Rfcn3pfdVBH52/image.png\"],\"app\":\"steemit/0.1\",\"format\":\"markdown\"}",
"parent_author": "",
"parent_permlink": "btc",
"permlink": "bitcoin-daily-macd-strong-bullish-divergence",
"title": "Bitcoin Daily MACD Strong Bullish Divergence"
}
],
"op_in_trx": 0,
"timestamp": "2018-06-14T23:24:03",
"trx_id": "ce5cf6a8e31d2e17ba94f9b74cd2af1b70f396c4",
"trx_in_block": 46,
"virtual_op": 0
}2018/06/12 23:09:12
2018/06/12 23:09:12
| author | iacobonechri |
| permlink | re-vanddar4-bitcoin-targets-after-50-week-ma-broken-20180611t225227666z |
| voter | vanddar4 |
| weight | 10000 (100.00%) |
| Transaction Info | Block #23269761/Trx 6b711761c2b20efa191ebcaaf4c858bd6e92e59f |
View Raw JSON Data
{
  "block": 23269761,
  "op": [
    "vote",
    {
      "author": "iacobonechri",
      "permlink": "re-vanddar4-bitcoin-targets-after-50-week-ma-broken-20180611t225227666z",
      "voter": "vanddar4",
      "weight": 10000
    }
  ],
  "op_in_trx": 0,
  "timestamp": "2018-06-12T23:09:12",
  "trx_id": "6b711761c2b20efa191ebcaaf4c858bd6e92e59f",
  "trx_in_block": 22,
  "virtual_op": 0
}vanddar4published a new post: bitcoin-falls-to-oversold-rsi-on-daily-bullish-divergence2018/06/12 23:07:42
vanddar4published a new post: bitcoin-falls-to-oversold-rsi-on-daily-bullish-divergence
2018/06/12 23:07:42
| author | vanddar4 |
| body | Another Bitcoin knockdown occurred in the past few hours here as the trend is the bears friend for now. Let’s look at how much further this can fall. On the hourly analog Bitcoin Bitfinex chart, you can see how price had a fairly sideways and uneventful majority of the day. I had drawn that blue box on the chart yesterday focusing on that range between $6,825 and $6,625 indicating that whichever direction price should break out of there should give it some momentum. Price meekly did break upward around 19 EST yesterday evening testing the light blue 50 hour moving average, and as similar as this past weekend was unable to break through that level. Price then made its way back down into the blue box, attempted to head to the 50 hour MA again, only to give up on little volume and tumble past the lows yesterday to a new low today of $6,436. I drew a black horizontal support line at $6,500 which supports previous lows in April and encompasses the wicks on the February 5th low as well. That low back from 3pm EST today at $6,436 also barely stays above the wick low from April 1st at 6,425. No bulls seem motivated to do any knife catching either because there is barely any push back up on these drops and the bears are in full control reveling in the bloody market. I have a last of $6,529 for now. The RSI is intriguing for a buy at this level since there is again some strong bullish divergence taking place with the RSI making higher lows and the price making lower lows. I marked these on the chart and indicator with blue and green arrows respectively. There could be additional downside, however it would be a good idea to wait a few more candles to see if price continues lower. The MACD on the other hand is looking quite bearish still. It’s curling downward and the red histogram lines are also sloping downward. Once the histogram lines begin flatting and returning back toward the median. We could see a temporary trend change. The fact that price also was halted right before the zero line on the indicator is not a good sign for the bulls as well. We can look for price target on the daily chart. 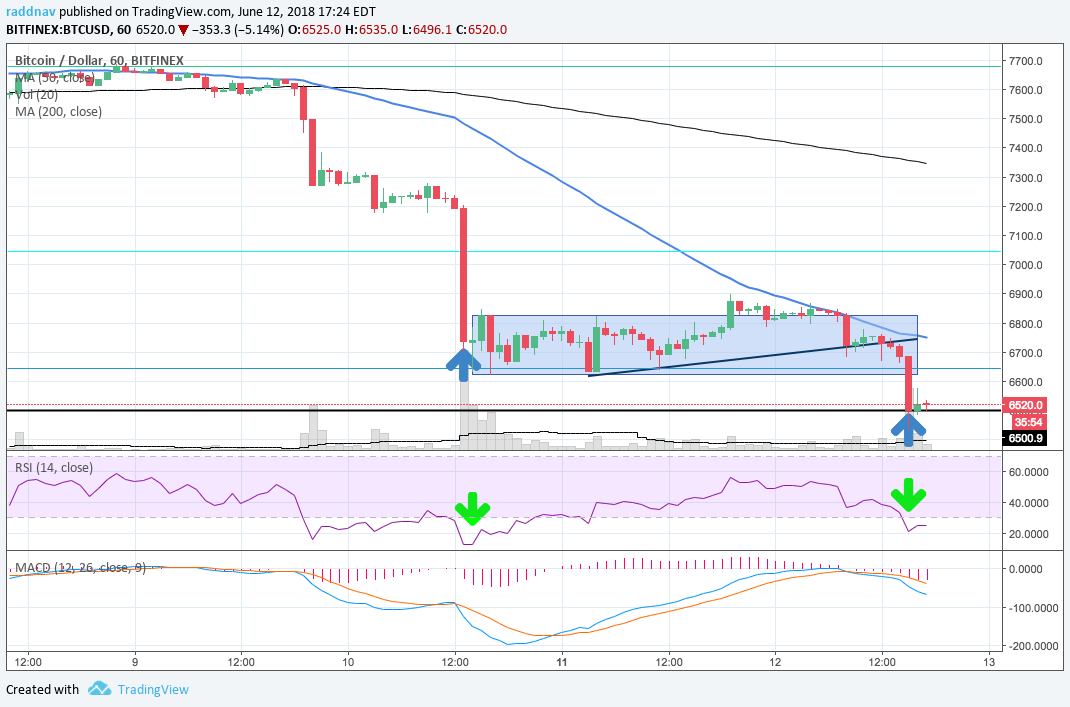 On the daily analog Bitcoin Bitfinex chart, you can see the dire situation the bulls find themselves in. Price is all the way back at the lows of $6,500 and it certainly looks like the wick from back in April at $6,425 will be breached this time. I would not be surprised to see a retest of the February 5th low at $6,000 this week. I have marked that on the chart with a maroon horizontal support line. I have also drawn a Fibonacci retracement on this chart from the price move on September 15th to the highs on December 17th and by that metric price has completed a .786 retracement at that blue line at about $6,607. The major pattern I see here is the descending triangle with the red down-trending line from January and the black horizontal support line we have been discussing. The descending triangle typically has bearish overtones to it and the declining volume the past few weeks has been confirming that. However, it can also signal the a reversal if price begins increasing in volume again. Some people have mentioned that this could be a triple bottom, however I am not sure it fits the criteria with the previous price peak at the end of April. I’ll take a look at this again tomorrow. RSI is now is oversold territory for the first time since Feb 5th sitting currently at 29.29. RSI would have to get down past 27, too signal a continuation of the bearish trend. If this candle closes here and price reverses there would be an indication of bullish reversal divergence, which I have marked with arrows again. We will need a few more days to confirm that. -More on Vanddar.com 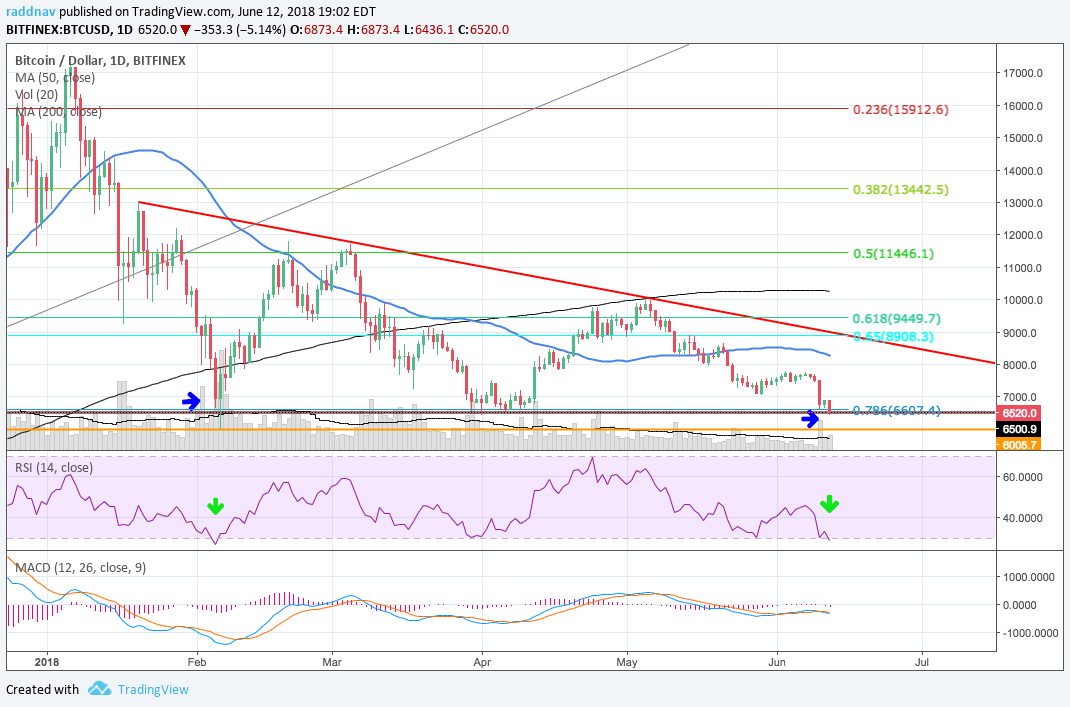 |
| json metadata | {"tags":["btc","bitcoin","crypto"],"image":["https://cdn.steemitimages.com/DQmUFDqAsgdGX774f62HgVE3La1LfniwDPb3rjBgZ5NLyog/image.png","https://cdn.steemitimages.com/DQmRxJhK7Yzjqtd25UfGfs9G1oh1YJyGdJGRGWYrJEG7inh/image.png"],"app":"steemit/0.1","format":"markdown"} |
| parent author | |
| parent permlink | btc |
| permlink | bitcoin-falls-to-oversold-rsi-on-daily-bullish-divergence |
| title | Bitcoin Falls to Oversold RSI on Daily; Bullish Divergence? |
| Transaction Info | Block #23269731/Trx 39b4866524f9287884f1497bbe5f649ed00e72ea |
View Raw JSON Data
{
"block": 23269731,
"op": [
"comment",
{
"author": "vanddar4",
"body": "Another Bitcoin knockdown occurred in the past few hours here as the trend is the bears friend for now. Let’s look at how much further this can fall.\n\nOn the hourly analog Bitcoin Bitfinex chart, you can see how price had a fairly sideways and uneventful majority of the day. \n\nI had drawn that blue box on the chart yesterday focusing on that range between $6,825 and $6,625 indicating that whichever direction price should break out of there should give it some momentum. Price meekly did break upward around 19 EST yesterday evening testing the light blue 50 hour moving average, and as similar as this past weekend was unable to break through that level. \n\nPrice then made its way back down into the blue box, attempted to head to the 50 hour MA again, only to give up on little volume and tumble past the lows yesterday to a new low today of $6,436.\n\nI drew a black horizontal support line at $6,500 which supports previous lows in April and encompasses the wicks on the February 5th low as well. \n\nThat low back from 3pm EST today at $6,436 also barely stays above the wick low from April 1st at 6,425. No bulls seem motivated to do any knife catching either because there is barely any push back up on these drops and the bears are in full control reveling in the bloody market. I have a last of $6,529 for now.\n\nThe RSI is intriguing for a buy at this level since there is again some strong bullish divergence taking place with the RSI making higher lows and the price making lower lows. I marked these on the chart and indicator with blue and green arrows respectively. There could be additional downside, however it would be a good idea to wait a few more candles to see if price continues lower.\n\nThe MACD on the other hand is looking quite bearish still. It’s curling downward and the red histogram lines are also sloping downward. Once the histogram lines begin flatting and returning back toward the median. We could see a temporary trend change. The fact that price also was halted right before the zero line on the indicator is not a good sign for the bulls as well. \n\nWe can look for price target on the daily chart.\n\n\n\nOn the daily analog Bitcoin Bitfinex chart, you can see the dire situation the bulls find themselves in. Price is all the way back at the lows of $6,500 and it certainly looks like the wick from back in April at $6,425 will be breached this time.\n\nI would not be surprised to see a retest of the February 5th low at $6,000 this week. I have marked that on the chart with a maroon horizontal support line. \n\nI have also drawn a Fibonacci retracement on this chart from the price move on September 15th to the highs on December 17th and by that metric price has completed a .786 retracement at that blue line at about $6,607.\n\nThe major pattern I see here is the descending triangle with the red down-trending line from January and the black horizontal support line we have been discussing. The descending triangle typically has bearish overtones to it and the declining volume the past few weeks has been confirming that. \n\nHowever, it can also signal the a reversal if price begins increasing in volume again. Some people have mentioned that this could be a triple bottom, however I am not sure it fits the criteria with the previous price peak at the end of April. I’ll take a look at this again tomorrow.\n\nRSI is now is oversold territory for the first time since Feb 5th sitting currently at 29.29. RSI would have to get down past 27, too signal a continuation of the bearish trend. If this candle closes here and price reverses there would be an indication of bullish reversal divergence, which I have marked with arrows again. We will need a few more days to confirm that. \n\n-More on Vanddar.com\n\n",
"json_metadata": "{\"tags\":[\"btc\",\"bitcoin\",\"crypto\"],\"image\":[\"https://cdn.steemitimages.com/DQmUFDqAsgdGX774f62HgVE3La1LfniwDPb3rjBgZ5NLyog/image.png\",\"https://cdn.steemitimages.com/DQmRxJhK7Yzjqtd25UfGfs9G1oh1YJyGdJGRGWYrJEG7inh/image.png\"],\"app\":\"steemit/0.1\",\"format\":\"markdown\"}",
"parent_author": "",
"parent_permlink": "btc",
"permlink": "bitcoin-falls-to-oversold-rsi-on-daily-bullish-divergence",
"title": "Bitcoin Falls to Oversold RSI on Daily; Bullish Divergence?"
}
],
"op_in_trx": 0,
"timestamp": "2018-06-12T23:07:42",
"trx_id": "39b4866524f9287884f1497bbe5f649ed00e72ea",
"trx_in_block": 21,
"virtual_op": 0
}2018/06/12 01:52:45
2018/06/12 01:52:45
| author | steemitboard |
| body | Congratulations @vanddar4! You have completed some achievement on Steemit and have been rewarded with new badge(s) : [](http://steemitboard.com/@vanddar4) You published your First Post [](http://steemitboard.com/@vanddar4) You got a First Vote <sub>_Click on the badge to view your Board of Honor._</sub> <sub>_If you no longer want to receive notifications, reply to this comment with the word_ `STOP`</sub> **Do not miss the [last announcement](https://steemit.com/steemitboard/@steemitboard/steemcleaners-and-steemitboard-to-offer-a-badge-to-users-who-verified-their-profile) from @steemitboard!** > Do you like [SteemitBoard's project](https://steemit.com/@steemitboard)? Then **[Vote for its witness](https://v2.steemconnect.com/sign/account-witness-vote?witness=steemitboard&approve=1)** and **get one more award**! |
| json metadata | {"image":["https://steemitboard.com/img/notify.png"]} |
| parent author | vanddar4 |
| parent permlink | bitcoin-targets-after-50-week-ma-broken |
| permlink | steemitboard-notify-vanddar4-20180612t015247000z |
| title | |
| Transaction Info | Block #23244237/Trx e6f092ce77ca50efb53a835830b03fd2135efd2f |
View Raw JSON Data
{
"block": 23244237,
"op": [
"comment",
{
"author": "steemitboard",
"body": "Congratulations @vanddar4! You have completed some achievement on Steemit and have been rewarded with new badge(s) :\n\n[](http://steemitboard.com/@vanddar4) You published your First Post\n[](http://steemitboard.com/@vanddar4) You got a First Vote\n\n<sub>_Click on the badge to view your Board of Honor._</sub>\n<sub>_If you no longer want to receive notifications, reply to this comment with the word_ `STOP`</sub>\n\n\n\n**Do not miss the [last announcement](https://steemit.com/steemitboard/@steemitboard/steemcleaners-and-steemitboard-to-offer-a-badge-to-users-who-verified-their-profile) from @steemitboard!**\n\n> Do you like [SteemitBoard's project](https://steemit.com/@steemitboard)? Then **[Vote for its witness](https://v2.steemconnect.com/sign/account-witness-vote?witness=steemitboard&approve=1)** and **get one more award**!",
"json_metadata": "{\"image\":[\"https://steemitboard.com/img/notify.png\"]}",
"parent_author": "vanddar4",
"parent_permlink": "bitcoin-targets-after-50-week-ma-broken",
"permlink": "steemitboard-notify-vanddar4-20180612t015247000z",
"title": ""
}
],
"op_in_trx": 0,
"timestamp": "2018-06-12T01:52:45",
"trx_id": "e6f092ce77ca50efb53a835830b03fd2135efd2f",
"trx_in_block": 27,
"virtual_op": 0
}youngogmarqsupvoted (0.02%) @vanddar4 / bitcoin-targets-after-50-week-ma-broken2018/06/11 23:10:03
youngogmarqsupvoted (0.02%) @vanddar4 / bitcoin-targets-after-50-week-ma-broken
2018/06/11 23:10:03
| author | vanddar4 |
| permlink | bitcoin-targets-after-50-week-ma-broken |
| voter | youngogmarqs |
| weight | 2 (0.02%) |
| Transaction Info | Block #23240989/Trx 0665bdcf7d79defa6c2e81714ae724506525a970 |
View Raw JSON Data
{
  "block": 23240989,
  "op": [
    "vote",
    {
      "author": "vanddar4",
      "permlink": "bitcoin-targets-after-50-week-ma-broken",
      "voter": "youngogmarqs",
      "weight": 2
    }
  ],
  "op_in_trx": 0,
  "timestamp": "2018-06-11T23:10:03",
  "trx_id": "0665bdcf7d79defa6c2e81714ae724506525a970",
  "trx_in_block": 0,
  "virtual_op": 0
}alquimista1501upvoted (100.00%) @vanddar4 / bitcoin-targets-after-50-week-ma-broken2018/06/11 22:54:18
alquimista1501upvoted (100.00%) @vanddar4 / bitcoin-targets-after-50-week-ma-broken
2018/06/11 22:54:18
| author | vanddar4 |
| permlink | bitcoin-targets-after-50-week-ma-broken |
| voter | alquimista1501 |
| weight | 10000 (100.00%) |
| Transaction Info | Block #23240689/Trx 4919ea478e7248e6d8b38399d308479b45af82ad |
View Raw JSON Data
{
  "block": 23240689,
  "op": [
    "vote",
    {
      "author": "vanddar4",
      "permlink": "bitcoin-targets-after-50-week-ma-broken",
      "voter": "alquimista1501",
      "weight": 10000
    }
  ],
  "op_in_trx": 0,
  "timestamp": "2018-06-11T22:54:18",
  "trx_id": "4919ea478e7248e6d8b38399d308479b45af82ad",
  "trx_in_block": 15,
  "virtual_op": 0
}Manabar
Voting Power100.00%
Downvote Power100.00%
Resource Credits100.00%
Reputation Progress0.00%
{
  "voting_manabar": {
    "current_mana": "8143659806",
    "last_update_time": 1779090792
  },
  "downvote_manabar": {
    "current_mana": 2035914951,
    "last_update_time": 1779090792
  },
  "rc_account": {
    "account": "vanddar4",
    "rc_manabar": {
      "current_mana": "10164408779",
      "last_update_time": 1779090792
    },
    "max_rc_creation_adjustment": {
      "amount": "2020748973",
      "precision": 6,
      "nai": "@@000000037"
    },
    "max_rc": "10164408779"
  }
}
Account Metadata
| POSTING JSON METADATA | |
| None | |
| JSON METADATA | |
| None |
{
  "posting_json_metadata": {},
  "json_metadata": {}
}
Auth Keys
Owner
Single Signature
Public Keys
STM76oUzMiXSYi6vwhTt4NhsTpc1Xz7Fb9pZCkWaRGbPR7TX12As81/1
Active
Single Signature
Public Keys
STM5E81NHdyv7Eq93nysTkr6q7xwVbjYMxc6EjpoC6YqJkVLVZk9c1/1
Posting
Single Signature
Public Keys
STM53rYxcgMBm1Hj1xaY6hq1VG33wU6RGpnVab5tcHQq4dMAyqJLb1/1
Memo
STM69bvgnQVoLztrb7zu1GvQrfw5k9RdkXiwUR34AwsBUFMpCuLji
{
  "owner": {
    "account_auths": [],
    "key_auths": [
      [
        "STM76oUzMiXSYi6vwhTt4NhsTpc1Xz7Fb9pZCkWaRGbPR7TX12As8",
        1
      ]
    ],
    "weight_threshold": 1
  },
  "active": {
    "account_auths": [],
    "key_auths": [
      [
        "STM5E81NHdyv7Eq93nysTkr6q7xwVbjYMxc6EjpoC6YqJkVLVZk9c",
        1
      ]
    ],
    "weight_threshold": 1
  },
  "posting": {
    "account_auths": [],
    "key_auths": [
      [
        "STM53rYxcgMBm1Hj1xaY6hq1VG33wU6RGpnVab5tcHQq4dMAyqJLb",
        1
      ]
    ],
    "weight_threshold": 1
  },
  "memo": "STM69bvgnQVoLztrb7zu1GvQrfw5k9RdkXiwUR34AwsBUFMpCuLji"
}
Witness Votes
0 / 30
No active witness votes.
[]